Trade Idea: Long on XAUUSD (15min)Trade Idea: Long on XAUUSD (15min) OANDA:XAUUSD
I'm going long on gold after spotting a liquidity sweep below the previous low. Price aggressively grabbed liquidity from the downside and showed a bullish reaction — a clear sign of smart money accumulation.
The market structure remains bullish on higher timeframes, and this entry aligns with a potential trend continuation after a stop-hunt move. The entry is placed just after the liquidity grab, aiming for a clean upside move toward the imbalance and minor resistance zone.
🟢 Entry: 3353.30
🔴 Stop Loss: 3350.67 (Below liquidity sweep)
🎯 Take Profit Zone: 3362–3366
🧠 RR Ratio: Favorable
#XAUUSD #Gold #SmartMoneyConcepts #LiquiditySweep #TrendFollowing #PriceAction #ForexTrader #GoldTrading #OrderBlock #SupplyAndDemand #SwingTrade #DayTrading #MarketStructure #ForexAnalysis #TradingView #RiskReward
Xauusd(w)

Gold XAUUSD Possible Move🚨 Trade Setup Alert
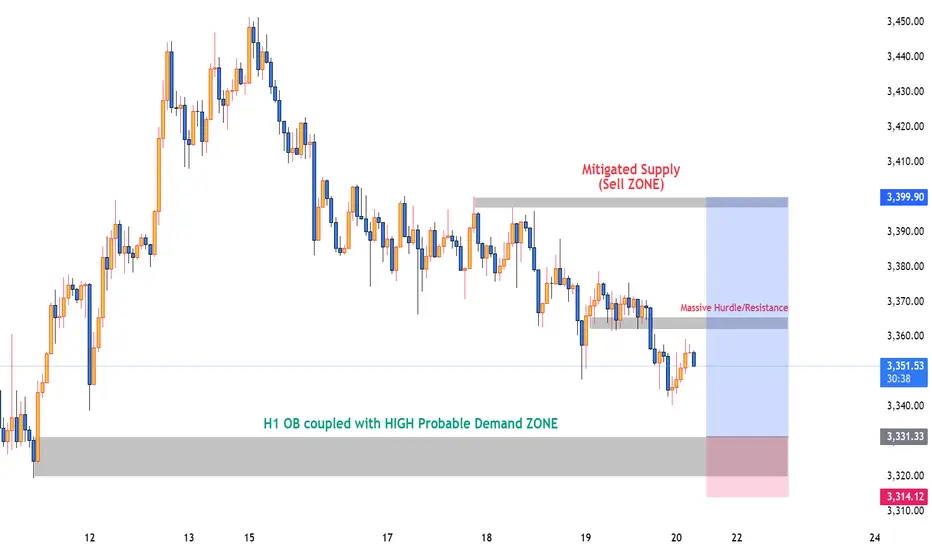
📍 H1 Orderblock Zone at 3330–3320
🔑 High-probability BUY setup after liquidity sweep 🟢
🎯 Target: 3362 and possibly 3396+
🛑 SL below 3315
📍 Mitigated Supply Zone at 3396–3400
🔻 Possible SELL setup if price rejects that level 🔴
🎯 Target: 3365 / 3340
🛑 SL above 3412
⚠️ Key Level: 3362–3365 must break to reach upper supply zone.
✅ A level viz. 3340 shared yesterday, I bought from 3340 and bagged +180 pips 💸
👀 Watch price action closely near these zones for confirmation.
📊 Trade with proper risk management! 💼
XAUUSD: Market Analysis and Strategy for June 20Gold technical analysis
Daily chart resistance 3450, support 3338
4-hour chart resistance 3372, support 3338
1-hour chart resistance 3363, support 3340
After the sharp drop at the beginning of this week, the bulls were weak, and each rebound was swallowed by a larger decline. Although there was a counterattack, the overall trend was oscillating downward. Yesterday, it rebounded from above 3362 to 3387, and then fell below 3362 to set a new low at 3347.
After today's shock, it broke through the low of 3347 again and fell to 3340. The short-term trend was weak. The Asian session high was at 3370, and the second high was at 3375. The ideal position is to rebound around 3370/75 during the day and choose to go short. Short-term shocks and declines can wait for rebounds and then go short. It is also easy to rebound quickly after the decline. If the support of 3340/38 is maintained, you can try to buy on the scalp. The second consideration is to sell in advance near 3356 to prevent weakness without a pullback and the NY market directly falling to a new low

Gold Ready to Shine Again? Watch This Battle Zone Closely!Gold is consolidating above the 50% retracement (3372) after defending key structure at 3368–3378. Bullish momentum is building as Silver continues to lead, and the US Dollar (DXY) weakens post-FOMC. If buyers step in here, we could see a clean breakout toward 3415–3450 and beyond. But if 3368 breaks, the bull case is temporarily invalidated.
🧭 Technical Highlights:
✅ Support Zone: 3368–3378 (Fibonacci + bullish order block)
✅ Resistance Targets: 3395, 3415.84, 3451.84, 3470+
🔄 Silver Divergence: XAGUSD broke higher → leading XAU bullishly
🔼 Bias: Bullish (as long as 3368 holds)
🌐 Fundamental Drivers:
🏦 Fed dot plot turns dovish – Only 1–2 cuts, but no hikes planned; supports gold upside.
⚔️ Middle East tensions rising – Iran vs. Israel/US rhetoric keeps risk premium high.
📉 DXY weakens after Powell avoided hawkish tone; real yields remain capped.
💬 Silver outperforming on safe-haven + industrial hedge flows.
💡 Trading Plan Summary:
Buy Zone: 3372–3380
TP Zones: 3395, 3415, 3450+
Invalidation: Close below 3368
Confirmation: Break and close above 3395 with volume = signal to scale in
🔔 Keep an eye on:
US Jobless Claims, SNB & BoE Decisions
DXY 98.70 key level
Silver reaction near 36.70–37.20

Gold corrective pullback supporta t 3330Gold’s price action sentiment remains bullish, underpinned by a well-established rising trend. However, recent intraday movement suggests a corrective pullback or short-term consolidation, likely in response to overbought conditions or short-term profit-taking.
Key Technical Levels:
Support:
3,330 – Key short-term support and previous consolidation zone; the critical pivot level for trend continuation.
3,315 – Secondary support; minor structural level.
3,300 – Psychological and technical support; near-term bearish target on a breakdown.
Resistance:
3,390 – Immediate upside target on a bullish continuation.
3,420 – Medium-term resistance; aligns with prior highs.
3,450 – Longer-term target, marking the upper boundary of the current bullish channel.
Scenario Analysis:
Bullish Continuation (Base Case):
If Gold maintains above the 3,330 level and confirms a bullish bounce, the broader uptrend is expected to resume, with upside targets at 3,390, followed by 3,420 and 3,450 over time.
Bearish Reversal (Alternative Scenario):
A daily close below 3,330 would negate the short-term bullish structure, exposing the market to deeper retracements toward 3,315 and 3,300, where further demand could emerge.
Conclusion:
Gold remains in a bullish trend, with the current pullback seen as corrective. The 3,330 level is a critical inflection point: holding above it supports further upside momentum, while a breakdown below this level would challenge the bullish outlook and potentially signal a deeper retracement. Traders should monitor price action around this zone for directional confirmation.
This communication is for informational purposes only and should not be viewed as any form of recommendation as to a particular course of action or as investment advice. It is not intended as an offer or solicitation for the purchase or sale of any financial instrument or as an official confirmation of any transaction. Opinions, estimates and assumptions expressed herein are made as of the date of this communication and are subject to change without notice. This communication has been prepared based upon information, including market prices, data and other information, believed to be reliable; however, Trade Nation does not warrant its completeness or accuracy. All market prices and market data contained in or attached to this communication are indicative and subject to change without notice.

THE KOG REPORT - FOMCTHE KOG REPORT – FOMC
This is our view for FOMC, please do your own research and analysis to make an informed decision on the markets. It is not recommended you try to trade the event if you have less than 6 months trading experience and have a trusted risk strategy in place. The markets are extremely volatile, and these events can cause aggressive swings in price.
A you can see traders the pre-event price action started yesterday with the hourly now playing between the MA’s and waiting for FOMC for a potential breakout. As usual, we have highlighted the key levels and added the red boxes for all of you to help navigate the movement should this not be priced in.
Also remember, there is a press conference after the release, this is usually the time the market will react to anything Powell says about future plans for the economy.
Now, looking at the 4H, we have support at the 3370-65 level and below that 3355. If these are attacked and give a RIP, opportunity for the long trade may be available into the 3395 red box which price will need to break to go higher. If we can break above this red box, we can then look to attempt higher price with the levels 3430, 3445 and above that 3455-60 on the horizon. It’s that red box sitting higher up around the 3470-75 region which needs to be watched if we do get up there as an opportunity to attempt the reverse trade may present itself from there depending on the volume.
So in summary, we have 3 key levels in play, ideally a move upside and rejection from the 3400-6 level giving a further dip would suit buyers to get better pricing.
KOG’s RED BOX TARGETS:
BREAK ABOVE 3395 for 3404, 3406, 3410, 3420, 3430, 3435 and 3459 in extension of the move
BREAK BELOW 3380 FOR 3375, 3364, 3351, 3342, 3333 AND 3327 IN EXTENSION OF THE MOVE
LEARN AND GENERATE YOUR OWN SIGNALS. You don't need any of us to guide you.
Please do support us by hitting the like button, leaving a comment, and giving us a follow. We’ve been doing this for a long time now providing traders with in-depth free analysis on Gold, so your likes and comments are very much appreciated.
As always, trade safe.
KOG

Gold (XAU/USD) 4-Hour Analysis- 20 June 2025On the 4-hour chart, gold has been trading in a fairly wide range.
The market has not clearly broken down, and many analysts see it as still structurally bullish as long as key support holds. Currently price is pulling back toward a confluence of support around $3,353–$3,355 (a zone overlapping a trendline and prior demand).
In other words, buyers have defended roughly the 3,340–3,355 area recently. Resistance lies just above in the $3,370–$3,380 region, with a major psychological pivot at $3,400. One analyst notes gold is “boxed between resistance at $3,450 and support at $3,340–$3,335”, so the immediate bias depends on these zones.
A clean break above 3,380–3,400 would signal bullish continuation (targeting 3,450+), while a drop below the 3,340–3,350 support zone would shift the bias bearish.
Overall, the market structure on H4 is mixed-to-bullish: we see higher swings in larger timeframes, and only a minor short-term down leg so far. As one analysis notes, gold remains “structurally bullish” and an upside break could chase the $3,500–$3,550 area.
Key Zones and Levels (4H)
Strong Support (Demand) Zone: ~$3,340–$3,355. This zone (around the recent swing lows) has attracted buying. Analysts mark $3,350–$3,355 as a key buy zone. Breaking below ~$3,340 would be a warning, putting 3,300 as the next floor.
Supply Zone / Resistance: ~$3,370–$3,380. This is the near-term resistance cluster (multiple analysts cite 3,370–3,380 as key). A rejection here would keep gold rangebound.
Major Pivot: $3,400. This round number is acting as an important hurdle. A decisive close above $3,400 would open the door to the $3,434–$3,450 area (prior highs). Conversely, failure at $3,400 can push price back toward the support zone.
Larger Resistances: If the uptrend resumes, look to ~$3,450 (April swing high) and beyond. Many long-range targets point to $3,500+ in a strong bull move.
Secondary Supports: Below the main support zone, watch ~$3,300 and down at $3,281 (the 50-day moving average). These act as deeper floors if weakness continues.
4-Hour Bias
In plain terms, as long as $3,340–$3,355 holds as support, the bias tilts bullish or neutral. We can say bullish bias above that zone: buyers will look to enter on pullbacks there. If price stays under $3,370, gains will likely be capped short-term. A break above $3,380/$3,400 would confirm a bullish breakout. On the flip side, a break below $3,340 shifts us to a bearish bias, with attention turning to lower support levels. On indicators, shorter-term momentum has eased (recent RSI is flattening around 60), suggesting some fatigue. But the longer-term trend is up, supported by strong safe-haven demand (central bank buying, geopolitical risk).
In summary: neutral-to-bullish on 4H, favor buyers near support but cautious near overhead supply.
Intraday (1H) Setups
Zooming into the 1-hour chart, we look for trades that align with the above bias. The clearest setups involve buying around demand zones and selling near supply areas:
Buy the Dip (~$3,344–$3,355): Wait for gold to dip into the 3,340–3,350 area. If you see a bullish price-action signal (e.g. a clear hammer or bullish engulfing candle), that’s a potential buy. Place a stop just below (~$3,335). Initial targets are around $3,370–$3,380 (near resistance). For example, one analysis suggests: “Buy XAU/USD at 3,344–3,348, TP 3,365–3,370, SL 3,335”.
Sell the Rally (~$3,375–$3,380): If price runs up to $3,375–$3,380 and shows signs of stalling (e.g. bearish candle), consider a short. Stop would be just above (~$3,385), with a target back down toward $3,355–$3,360 or the 1H demand zone. (One example from analysis: “Sell XAU/USD at 3,375–3,380, TP 3,355–3,360, SL 3,385”.) This aligns with fading the high of the range.
Breakout Strategy: If momentum is strong and gold breaks convincingly above ~$3,380–$3,400 on the 1H, one can enter long on the breakout. The next resistances are ~$3,434 and $3,450.
Stops should be very tight in that case (just under the breakout candle).
Risk Management: Keep position sizes small (1–2% risk). Use stops under/above the structural levels. Always wait for a clear 1H candle signal before pulling the trigger, to avoid false moves.
Key 1H levels: We can cite the strong short-term zones: support ~$3,344–$3,348 and resistance ~$3,375–$3,380.
If price skims these areas, watch carefully for a signal to buy or sell as described above. If 1H breaks below $3,340, be ready for a move toward the lower demand zone (around $3,335) or even $3,300–$3,280.
Takeaway
Gold is currently trading between ~$3,340 and $3,380 on the 4H chart. The simplest guidance is to trade the range: buy on dips near $3,340–$3,355 with stops just below, aiming for the $3,370–$3,380 area, and sell near $3,375–$3,380 if rallies stall. Maintain a bullish tilt as long as that $3,340+ support holds, but be ready to switch bearish if gold decisively closes under ~$3,340.
Single Takeaway: Treat ~$3,340–$3,355 as a key demand zone – a bounce here would be a high-probability long entry (targeting $3,370–$3,380), whereas a break below would turn the bias lower.

Gold Spot / U.S. Dollar (XAU/USD) 4-Hour Chart4-hour chart displays the price movement of Gold Spot against the U.S. Dollar (XAU/USD) from early June to mid-June 2025. The price, currently at $3,350.76, has experienced a recent decline of $19.76 (-0.59%) as of 01:06:10. The chart highlights a downward trend with a shaded area indicating a potential support or resistance zone between $3,310.41 and $3,374.21. Key price levels are marked, showing fluctuations between $3,300.00 and $3,374.21 over the observed period.

XAUUSD Analysis todayHello traders, this is a complete multiple timeframe analysis of this pair. We see could find significant trading opportunities as per analysis upon price action confirmation we may take this trade. Smash the like button if you find value in this analysis and drop a comment if you have any questions or let me know which pair to cover in my next analysis.

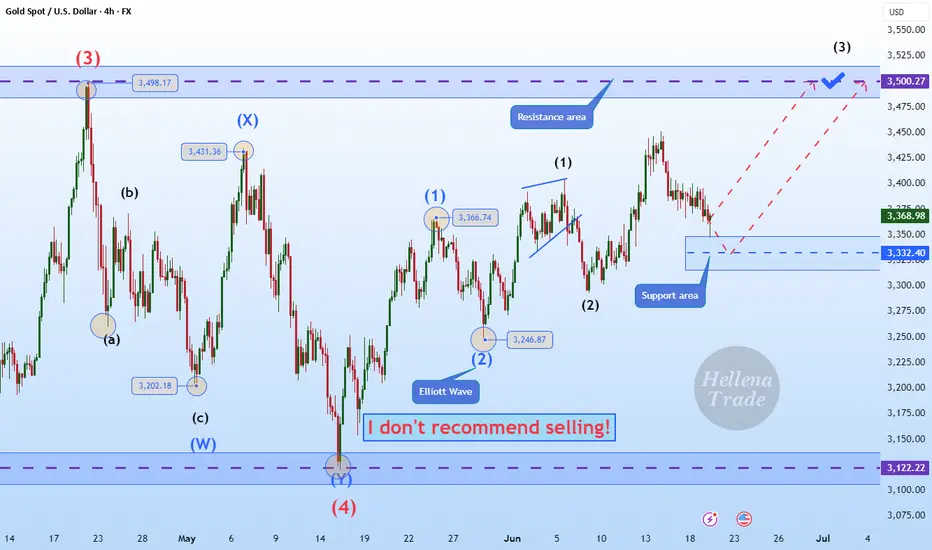
Hellena | GOLD (4H): LONG to resistance area of 3500 (Wave 3).Colleagues, the correction did take place and was quite deep, as I wrote earlier.
However, I am leaving my target unchanged—the resistance area and the maximum of wave “3” of the higher order at 3500.
The waves remain in their previous places, because none of the rules of wave analysis have been violated.
Manage your capital correctly and competently! Only enter trades based on reliable patterns!
Can Crude Oil Spike to 150 USD / bbl ? Scenario Analysis.With Mid East tensions rising and overall unpredictable
situation around Strait of Hormuz, let's review potential
scenarios for the Crude Oil Prices. I've outlined three
scenarios with projected oil prices for each scenario below.
🚨 Market Alert: Israel-Iran Conflict Impact Forecast 📈
🔴 Worst-Case Scenario: Regional War + U.S. Military Involvement
🚢 Oil (Brent): Soars to $150–$200+ if Strait of Hormuz closes
🥇 Gold: Skyrockets to $4,500–$5,000 (safe-haven rush)
₿ Bitcoin: Initial volatility; settles at $80k–$100k
📉 SPX: Crashes to 4,000–4,500
💻 NDX: Drops sharply to 15,000–16,000
🟠 Base-Case Scenario: Protracted Tension, No Major Disruption
🛢 Oil: Stabilizes at elevated $75–$95, occasional spikes
🥇 Gold: Moves higher, trading $3,500–$3,800
₿ Bitcoin: Trades steady, $90k–$110k range
📊 SPX: Pullback moderate, around 5,200–5,500
💻 NDX: Moderately lower, 18,000–19,000 range
🟢 Best-Case Scenario: Diplomatic De-Escalation
🌊 Oil: Eases down to $65–$75
🥇 Gold: Mild decline, holds at $3,300–$3,500
₿ Bitcoin: Positive sentiment, lifts to $100k–$120k
📈 SPX: Slight dip; stays strong near 5,800–6,200
💻 NDX: Minor correction, remains high at 20,000–22,000

Trading Guide for Long-Short Game under Oscillating PressureI. Yesterday's Market Performance and Trend
Yesterday, the price of gold exhibited a "V-shaped" oscillation pattern. In the morning session, it faced selling pressure around $3,380 and declined to a low of $3,347. Subsequently, it rebounded and returned to the trading range of $3,360 - $3,375. On the daily chart, it closed with a doji star, and trading volume contracted, indicating a stalemate between bulls and bears and the entry into a narrow trading range.
II. Outlook for Today's Weekly Close
As today marks the end of the weekly trading cycle, there are no clear factors driving a unidirectional trend. Key macroeconomic data has not been released yet, and the market remains divided on the Federal Reserve's future monetary policy. Technically, the daily moving averages have flattened out, and the Bollinger Bands have narrowed, suggesting that the consolidation pattern is likely to persist.
III. Technical Analysis of the 4-Hour Timeframe
In the 4-hour timeframe, the price of gold has been trading below the middle band of the Bollinger Bands. The MACD has formed a bearish crossover below the zero line, with the green bars expanding. It has also broken below the upward trend line. The support level at $3,340 is now under threat. With a weak RSI, the market is expected to move lower in a volatile manner.
IV. Trading Strategies
Focus on Short Positions: Initiate small - scale short positions when bearish K - line patterns appear around $3,360, with a stop - loss set at $3,375 and a target price of $3,340. Consider adding to short positions if the price drops below $3,365, with a stop - loss at $3,380 and targets at $3,350 - $3,340. Supplement with Long Positions: Open small long positions if the price stabilizes at $3,340, with a stop - loss at $3,330 and a target price of $3,355. Add to long positions if bullish patterns emerge at the strong support level of $3,315, with a stop - loss at $3,300 and targets at $3,330 - $3,340.
Pay close attention to the release of the US initial jobless claims data in the evening. Limit each position to no more than 10% of the total capital and strictly adhere to stop - loss and take - profit levels.
XAUUSD
sell@3360-3370
tp:3350-3340
buy@3335-3345
tp:3355-3365
I am committed to sharing trading signals every day. Among them, real-time signals will be flexibly pushed according to market dynamics. All the signals sent out last week accurately matched the market trends, helping numerous traders achieve substantial profits. Regardless of your previous investment performance, I believe that with the support of my professional strategies and timely signals, I will surely be able to assist you in breaking through investment bottlenecks and achieving new breakthroughs in the trading field.

High possibility of XAUUSD creating higher highs for June 2025 If Price Action activates above 3379 USD on spotgold XAUUSD on 20 June 2025 , we might just see a new high created for June 2025 . (90% probability)
However , this may change if the next week patterns disrupt current analysis.

Gold on the Edge: Will US Debt Fears Spark a Breakout?XAUUSD – Gold on the Edge: Will US Debt Fears Spark a Breakout?
After weeks of muted movement, gold is coiling within a bearish channel — but a fresh warning from Goldman Sachs may be the trigger that changes everything. With concerns mounting over America’s fiscal future, gold could be preparing for a decisive shift.
🌐 Macro View – Goldman Sachs Sounds the Alarm
🔺 Goldman Sachs recently issued a critical warning:
US national debt is expected to exceed WWII levels, with interest payments topping $1 trillion by 2025, outpacing spending on defense and healthcare.
If urgent fiscal reforms aren’t implemented, the US could face a tightening cycle that slows GDP growth without reducing the debt-to-GDP ratio.
The root causes? Excessive spending, rising interest rates, and deep political gridlock.
📌 For global investors, this type of uncertainty is often bullish for gold — especially as a hedge against both inflation and US dollar instability.
📉 Technical Outlook (Updated – M30 to H1)
Gold is still trading inside a well-defined descending channel, with sellers firmly in control.
Price is currently hovering around the pivot zone at 3,338.42, with a possible short-term bounce toward 3,368.04, the upper edge of the channel.
EMA ribbons (13–200) are sharply aligned to the downside, signaling strong bearish momentum.
If the price fails to break above 3,368, the next key support zones lie at 3,325.78, and potentially 3,309.25, where unfilled fair value gaps (FVG) await.
✅ Trade Plan
🟢 BUY ZONE: 3310 – 3308
Stop-Loss: 3303
Targets: 3314 → 3318 → 3322 → 3326 → 3330 → 3340 → 3350 → 3360 →
🟢 BUY SCALP: 3325 – 3323
Stop-Loss: 3318
Targets: 3330 → 3334 → 3338 → 3342 → 3346 → 3350 → 3360 → 3370 →
🔴 SELL ZONE: 3418 – 3420
Stop-Loss: 3424
Targets: 3414 → 3410 → 3405 → 3400 → 3396 → 3390 → 3385 → 3380
🔻 SELL SCALP: 3396 – 3398
Stop-Loss: 3403
Targets: 3392 → 3388 → 3384 → 3380 → 3375 → 3370
💬 Closing Thoughts – A Volatile End to the Week?
With US markets returning from a bank holiday and macro pressure rising, volatility could spike to close the week.
✅ Stick to disciplined SL/TP levels. Avoid premature entries and let price confirm direction.
Gold remains technically bearish — but the global debt narrative could turn this market on its head.
Prepare. Observe. Strike only when the structure aligns.

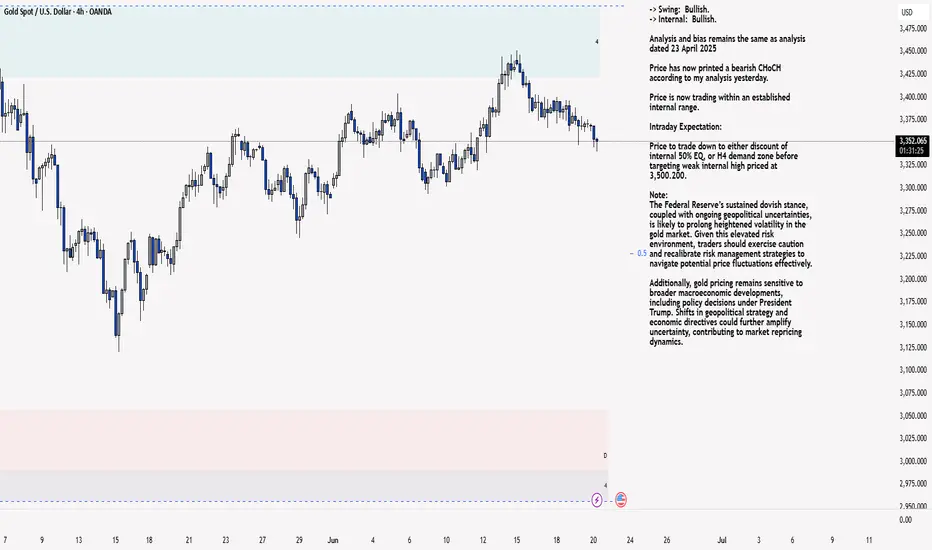
XAU/USD 20 June 2025 Intraday AnalysisH4 Analysis:
-> Swing: Bullish.
-> Internal: Bullish.
Analysis and bias remains the same as analysis dated 23 April 2025
Price has now printed a bearish CHoCH according to my analysis yesterday.
Price is now trading within an established internal range.
Intraday Expectation:
Price to trade down to either discount of internal 50% EQ, or H4 demand zone before targeting weak internal high priced at 3,500.200.
Note:
The Federal Reserve’s sustained dovish stance, coupled with ongoing geopolitical uncertainties, is likely to prolong heightened volatility in the gold market. Given this elevated risk environment, traders should exercise caution and recalibrate risk management strategies to navigate potential price fluctuations effectively.
Additionally, gold pricing remains sensitive to broader macroeconomic developments, including policy decisions under President Trump. Shifts in geopolitical strategy and economic directives could further amplify uncertainty, contributing to market repricing dynamics.
H4 Chart:
M15 Analysis:
-> Swing: Bullish.
-> Internal: Bullish.
Following previous high, and printing of bearish CHoCH, price has pulled back to an M15 supply zone, where we are currently seeing a reaction. Therefore, I shall now confirm internal high.
Price is now trading within an established internal range.
The remainder of my analysis shall remain the same as analysis dated 13 June 2025, apart from target price.
As per my analysis dated 22 May 2025 whereby I mentioned price can be seen to be reacting at discount of 50% EQ on H4 timeframe, therefore, it is a viable alternative that price could potentially print a bullish iBOS on M15 timeframe despite internal structure being bearish.
Price has printed a bullish iBOS followed by a bearish CHoCH, which indicates, but does not confirm, bearish pullback phase initiation. I will however continue to monitor, with respect to depth of pullback.
Intraday Expectation:
Price to continue bearish, react at either M15 supply zone, or discount of 50% internal EQ before targeting weak internal high priced at 3,451.375.
Note:
Gold remains highly volatile amid the Federal Reserve's continued dovish stance, persistent and escalating geopolitical uncertainties. Traders should implement robust risk management strategies and remain vigilant, as price swings may become more pronounced in this elevated volatility environment.
Additionally, President Trump’s recent tariff announcements are expected to further amplify market turbulence, potentially triggering sharp price fluctuations and whipsaws.
M15 Chart:
The bear market is over? Short at high and long at low📰 Impact of news:
1. The interest rate remains unchanged and leads to new lows in the short term
2. Geopolitical tensions provide support for risk aversion
📈 Market analysis:
Due to the early closing yesterday, the volatility of the US market was limited and the market seemed relatively flat. From a technical perspective and the current trend, 3340 is a key defensive support level. If it retreats to this level, you can consider going long. If the gold price continues to rise and reaches 3375, from the perspective of trading strategy, you can choose to place a short order here. Focus on the resistance line of 3370-3375 during the day, and pay attention to the support of 3345-3335 below.
🏅 Trading strategies:
SELL 3370-3375
TP 3360-3355-3345
BUY 3345-3335
TP 3360-3370
If you agree with this view, or have a better idea, please leave a message in the comment area. I look forward to hearing different voices.
OANDA:XAUUSD FX:XAUUSD FOREXCOM:XAUUSD FXOPEN:XAUUSD TVC:GOLD

Gold Longlooking to the upside on Gold from Asia lows. This is a prelim entry (forecast) need to seek bullish PA around the FVG if we get a pull back. If a pull back does not form we will wait for a break and RT above 3,352 and plan entries accordingly.

Gold Outlook: Sharp Breakout or Pullback Ahead?Despite heightened geopolitical tensions alongside a weak US Dollar, gold's price action remains in pullback mode below the $3,400 level, awaiting a catalyst.
Technically, gold remains at the upper boundary of a long-term ascending channel, anchored by the 2016 and 2020 highs. It also sits just beneath the projected breakout zone of a large cup-and-handle pattern, with a potential target near $4,000.
If gold manages a firm close above $3,500 and clears the upper boundary of the channel, bullish momentum could lift prices toward $3,700, and possibly $4,000, during the second half of 2025.
Conversely, sustained weakness below the $3,300 level would open the door to near-term support zones at $3,290, $3,240, $3,100, and $2,800, which may offer "buy-the-dip" opportunities along its primary uptrend.
- Razan Hilal, CMT

Choppy Gold Action Hides a Bigger Drop on Weekly Chart?After Monday’s correction, Gold continued lower – but the drop has been extremely choppy, making swing trading nearly impossible in this environment.
🔄 Short-term vs. Weekly Picture
On the 1H chart, price action is messy and directionless. However, the weekly chart tells a clearer story – which is not bullish at this moment.
❗ Let’s not rush into the “new ATH” narrative
Last week, I pointed out around the 3360 zone that we may get a rise above 3400. That move happened – but it seems more driven by Middle East tensions than by any structural strength in Gold itself.
📉 Why I’m leaning bearish on higher timeframes at this moment:
• This week’s price action almost fully negates last week’s strong green candle
• A close near the bottom of the range could form a Dark Cloud Cover pattern – a strong bearish signal
• Unless we see a reversal above 3400, downside remains the higher probability
📌 Next Target?
If the weekly close confirms this bearish setup, a drop to 3150 is not only possible – it’s becoming likely.
Disclosure: I am part of TradeNation's Influencer program and receive a monthly fee for using their TradingView charts in my analyses and educational articles.

GOLD H1 Intraday Chart Update For 20 JUNE 25Hello Traders we are now at closing day of the week, for today market expected is in tight range and better to wait for closing of the week
strong resistance for the day is 3382 level while strong support for the day is 3333
scalping range for today is 3340-3375
Disclaimer: Forex is Risky

Could the Gold bounce from here?The price is falling towards the pivot which acts as a pullback support and could bounce from this level to the 1st resistance which is also a pullback resistance.
Pivot: 3,337.35
1st Support: 3,294.91
1st Resistance: 3,413.32
Risk Warning:
Trading Forex and CFDs carries a high level of risk to your capital and you should only trade with money you can afford to lose. Trading Forex and CFDs may not be suitable for all investors, so please ensure that you fully understand the risks involved and seek independent advice if necessary.
Disclaimer:
The above opinions given constitute general market commentary, and do not constitute the opinion or advice of IC Markets or any form of personal or investment advice.
Any opinions, news, research, analyses, prices, other information, or links to third-party sites contained on this website are provided on an "as-is" basis, are intended only to be informative, is not an advice nor a recommendation, nor research, or a record of our trading prices, or an offer of, or solicitation for a transaction in any financial instrument and thus should not be treated as such. The information provided does not involve any specific investment objectives, financial situation and needs of any specific person who may receive it. Please be aware, that past performance is not a reliable indicator of future performance and/or results. Past Performance or Forward-looking scenarios based upon the reasonable beliefs of the third-party provider are not a guarantee of future performance. Actual results may differ materially from those anticipated in forward-looking or past performance statements. IC Markets makes no representation or warranty and assumes no liability as to the accuracy or completeness of the information provided, nor any loss arising from any investment based on a recommendation, forecast or any information supplied by any third-party.

Gold Broke Out – Another Drop Loading?OANDA:XAUUSD TVC:GOLD Gold is attempting a rebound but faces strong resistance near $3,364–$3,368, where previous support converges with the descending trendline (TL1). A clear rejection here could resume the bearish momentum.
Technically, the price is hovering just below the TL1 resistance. The zone around $3,368 is critical — if bulls fail to reclaim this area, we could see a move back toward the $3,326 support, with a deeper target near weekly support at $3,310.
📉 A rejection around current levels = high probability drop
📈 Break and hold above TL1 = potential short-term reversal
🧠 Macro Check:
Despite intensifying Middle East tensions (Israel-Iran conflict escalating, Trump weighing intervention), gold remains under pressure. The Fed’s hawkish hold, persistent inflation, and a strong dollar continue to weigh on bullion in the near term.
🔍 Key Levels:
Resistance: $3,364–$3,368 (structure + TL1)
Support: $3,326 / $3,310
Bias: Bearish below $3,368
Setup Idea: Watch for rejection near resistance for short setups toward $3,326 and $3,310

XAUUSD M15 I Bearish Reversal Based on the M15chart, the price is approaching our sell entry level at 3361.93, a pullback resistance that aligns with the 50% Fib retracement.
Our take profit is set at 3342.62, an overlap support.
The stop loss is set at 3379.02, a swing high resistance.
High Risk Investment Warning
Trading Forex/CFDs on margin carries a high level of risk and may not be suitable for all investors. Leverage can work against you.
Stratos Markets Limited (tradu.com ):
CFDs are complex instruments and come with a high risk of losing money rapidly due to leverage. 63% of retail investor accounts lose money when trading CFDs with this provider. You should consider whether you understand how CFDs work and whether you can afford to take the high risk of losing your money.
Stratos Europe Ltd (tradu.com ):
CFDs are complex instruments and come with a high risk of losing money rapidly due to leverage. 63% of retail investor accounts lose money when trading CFDs with this provider. You should consider whether you understand how CFDs work and whether you can afford to take the high risk of losing your money.
Stratos Global LLC (tradu.com ):
Losses can exceed deposits.
Please be advised that the information presented on TradingView is provided to Tradu (‘Company’, ‘we’) by a third-party provider (‘TFA Global Pte Ltd’). Please be reminded that you are solely responsible for the trading decisions on your account. There is a very high degree of risk involved in trading. Any information and/or content is intended entirely for research, educational and informational purposes only and does not constitute investment or consultation advice or investment strategy. The information is not tailored to the investment needs of any specific person and therefore does not involve a consideration of any of the investment objectives, financial situation or needs of any viewer that may receive it. Kindly also note that past performance is not a reliable indicator of future results. Actual results may differ materially from those anticipated in forward-looking or past performance statements. We assume no liability as to the accuracy or completeness of any of the information and/or content provided herein and the Company cannot be held responsible for any omission, mistake nor for any loss or damage including without limitation to any loss of profit which may arise from reliance on any information supplied by TFA Global Pte Ltd.
The speaker(s) is neither an employee, agent nor representative of Tradu and is therefore acting independently. The opinions given are their own, constitute general market commentary, and do not constitute the opinion or advice of Tradu or any form of personal or investment advice. Tradu neither endorses nor guarantees offerings of third-party speakers, nor is Tradu responsible for the content, veracity or opinions of third-party speakers, presenters or participants.
