GOLD ROUTE MAP UPDATEHey Everyone,
Once again our levels deliver the magic!!
Yesterdays update, we stated that we got the move into 3393 just like we analysed for the first level of swing and that we will now look for ema5 to cross and lock 3372 or 3393 to confirm direction.
🔄 Update:
No ema5 lock above 3393 confirmed the rejection into 3372 followed with ema5 cross and lock opening the full swing range test into 3353. We got the test and the perfect bounce back into 3372. A move into 3393 will complete the full swing range.
We will keep the above in mind when taking buys from dips. Our updated levels and weighted levels will allow us to track the movement down and then catch bounces up.
We will continue to buy dips using our support levels, taking 20 to 40 pips. As stated before, each of our level structures gives 20 to 40 pip bounces, which is enough for a nice entry and exit. If you back-test the levels we shared every week for the past 24 months, you can see how effectively they were used to trade with or against short/mid-term swings and trends.
🌀 The swing ranges give bigger bounces than our weighted levels - that's the difference between the two.
BULLISH TARGET
3440 - DONE
EMA5 CROSS AND LOCK ABOVE 3340 WILL OPEN THE FOLLOWING BULLISH TARGETS
3463
EMA5 CROSS AND LOCK ABOVE 3463 WILL OPEN THE FOLLOWING BULLISH TARGET
3483
EMA5 CROSS AND LOCK ABOVE 3483 WILL OPEN THE FOLLOWING BULLISH TARGET
3508
BEARISH TARGETS
3418 -DONE
EMA5 CROSS AND LOCK BELOW 3418 WILL OPEN THE FOLLOWING BEARISH TARGET
3393 - DONE
EMA5 CROSS AND LOCK BELOW 3393 WILL OPEN THE SWING RANGE
3372 - DONE
3353 - DONE
EMA5 CROSS AND LOCK BELOW 3353 WILL OPEN THE SECONDARY SWING RANGE
3330
3306
As always, we will keep you all updated with regular updates throughout the week and how we manage the active ideas and setups. Thank you all for your likes, comments and follows, we really appreciate it!
Mr Gold
GoldViewFX
Xauusd(w)

buy in GOLD ??After gold reached a strong support area and was successfully confirmed, I think it is good to take a buy trade.

Analysis of the Latest Market Trends of Gold's LowThe gold price experienced a sharp decline after a gap-up opening on Monday this week, followed by a doji doji bullish candle for sideways correction on Tuesday, and a generally range-bound trend on Wednesday. However, after the Federal Reserve's interest rate decision was announced on Wednesday, the gold price dipped to around 3,362, where the low point coincided with the support from the 10-day moving average. Technically, the role of the 10-day moving average support at 3,350 has now become a key focus. If this support holds effectively, the gold price is expected to maintain a consolidative pattern. In terms of upper resistance, the 5-day moving average currently at around 3,390 will act as a suppression for the gold price's upward movement, with further resistance contingent on the breakthrough of 3,405.
The 4-hour chart shows no significant changes either, as the lower Bollinger Band has not widened, indicating strong support at 3,360, which still suggests a bullish trend. Notably, however, during the consecutive rebounds, the gold price has failed to break through the resistance of the middle Bollinger Band, implying a relatively weak mid-term range-bound trend for gold. For intraday trading, a strategy of "shorting at highs and longing at lows" is recommended, pending a breakout from the trend momentum to create trading space. Intraday, long positions are favored above the support at 3,350.
you are currently struggling with losses,or are unsure which of the numerous trading strategies to follow,You have the option to join our VIP program. I will assist you and provide you with accurate trading signals, enabling you to navigate the financial markets with greater confidence and potentially achieve optimal trading results.
Trading Strategy:
buy@3350-3355
TP:3375-3380
sell@3375-3380
TP:3350-3355

The market is closed today. How to arrange gold in the evening?📰 Impact of news:
1. The interest rate remains unchanged and leads to new lows in the short term
2. Geopolitical tensions provide support for risk aversion
📈 Market analysis:
The market is expected to not fluctuate much today. Generally speaking, it is difficult to stand on one foot to form a short-term bottom. There should be a second wave of bottom exploration, a secondary low point, and then the bottom is explored and pulled up to break through the previous high point. Only then can the turning point be officially established and the decline end. Moreover, the 1H moving average is spreading downward. Therefore, in the short term, we still pay attention to the 3375-3385 line of resistance and the 3360-3355 line of support below.
🏅 Trading strategies:
SELL 3375-3385
TP 3365-3360-3355
BUY 3360-3355
TP 3370-3380-3405-3420
If you agree with this view, or have a better idea, please leave a message in the comment area. I look forward to hearing different voices.
TVC:GOLD FXOPEN:XAUUSD FOREXCOM:XAUUSD FX:XAUUSD OANDA:XAUUSD

GOLD - WAVE 5 BULLISH TO $3,622 (UPDATE)Like I said on the last update, Gold is currently going through a strong 'accumulation' phase for buyers, hence why we're seeing these choppy price actions, trying to liquidate buyers.
As long as Gold is ABOVE THE WAVE 2 LOW, market structure still favours buyers. Breaking below this low, will invalidate bullish structure.
Wave 2 Invalidation Level - $3,245❌

GOLD My Opinion! BUY!
My dear friends,
Please, find my technical outlook for GOLD below:
The price is coiling around a solid key level - 3367.9
Bias - Bullish
Technical Indicators: Pivot Points Low anticipates a potential price reversal.
Super trend shows a clear buy, giving a perfect indicators' convergence.
Goal - 3379.6
Safe Stop Loss - 3360.8
About Used Indicators:
The pivot point itself is simply the average of the high, low and closing prices from the previous trading day.
Disclosure: I am part of Trade Nation's Influencer program and receive a monthly fee for using their TradingView charts in my analysis.
———————————
WISH YOU ALL LUCK

EURUSD ||| Elite traders see the trap
EUR/USD 4H 🔍 – Greenfire Forex Outlook
🟦 Rising channel structure spotted
🔸 Liquidity zones mapped
🟪 Buyer blocks identified (1.137 & 1.117)
📉 Let price dive deeper into the trap...
📈 Then catch the reversal with precision.
This is not a prediction, it's a reaction plan based on price behavior.
🔥 Structure + Zones + Patience = Greenfire Setup
.
#EURUSD #SmartMoneyConcepts #ForexAnalysis #ElliottWave #SMC #PriceAction #ForexIndia #4HChart

SPY/QQQ Plan Your Trade For 6-19: GAP Reversal Counter TrendToday's pattern is a GAP Reversal in Counter Trend mode. I believe this could represent a breakdown in the ES/NQ as the US stock market is closed for the Juneteenth holiday.
Obviously, after the Fed comments yesterday (stating "uncertainty") and with the continued Israel/Iran conflict playing out, it makes sense to me that the US markets would move into a pre-weekend consolidation phase.
Even though the US stock market will be closed, the futures market will likely stay open and will carry some general market sentiment and reactions to news.
Watching Gold/Silver and Bitcoin should be very interesting today. I suspect the markets will continue to consolidate downward today - leading to a potential breakdown seeking support day on Friday.
Buckle up. We'll likely have 3-5+ days of news related to the Israel/Iran conflict and other issues over this weekend. It could be very interesting to see how the global markets move through this news.
Get some.
Happy Juneteenth
#trading #research #investing #tradingalgos #tradingsignals #cycles #fibonacci #elliotwave #modelingsystems #stocks #bitcoin #btcusd #cryptos #spy #gold #nq #investing #trading #spytrading #spymarket #tradingmarket #stockmarket #silver

GOLD Finally Breakout , Short Setup Valid To Get 200 Pips !Here is my opinion , after this amazing 4H / Daily Breakout , we should sell Gold From Area Between 3377.00 / 3375.00 And Targeting 250 Pips At Least .

DeGRAM | GOLD aim to test the lower boundary📊 Technical Analysis
● Hourly price is defending the channel’s lower half: three consecutive wicks bounced at 3 360, forming a descending flag whose base coincides with the dynamic support.
● OBV is edging higher while the flag narrows; a close above 3 408 would unlock the flag-measured move toward the upper rail / horizontal target at 3 444–3 450.
💡 Fundamental Analysis
● World Gold Council reports India’s jewellery demand rebounded 8 % w/w as monsoon concerns eased, while CME data show fresh 6 K-lot COMEX short-covering after the latest FOMC testimony tempered rate-hike talk.
✨ Summary
Long 3 360–3 380; flag break > 3 408 eyes 3 444 → 3 450. Bull view void on an H1 close below 3 343.
-------------------
Share your opinion in the comments and support the idea with a like. Thanks for your support!

XAUUSD: Market Analysis and Strategy for June 19Gold technical analysis
Daily chart resistance 3450, support below 3338
Four-hour chart resistance 3400, support below 3338
One-hour chart resistance 3375, support below 3350
Fundamentally, the geopolitical situation has eased. The market was affected by the Fed's decision this week to keep interest rates unchanged and not cut interest rates, which weakened the bullish momentum and buyers took profits, leading to a decline.
From the current trend analysis, the support below focuses on the four-hour level 3338 and the one-hour level 3350 support. The upper pressure focuses on the suppression near the daily level 3450, and the short-term long-short strength and weakness dividing line 3400. Keep the high-selling and low-buying range operation during the day.
Sell: 3375near SL: 3380
Sell: 3350near SL: 3355
Buy: 3338near SL: 3333

Fed Rate Decision: Gold's 3,400 Threshold as Bull-Bear DivideToday, the market has consolidated in a range throughout the day, with neither price direction nor volatility breaking through the range. However, our trading approach proved accurate: short positions were initiated near 3,400 during rebounds, and long positions were entered near the key level of 3,370 during pullbacks. Investors following our strategy have achieved profits from both directions. With limited price movement currently, the Fed's interest rate decision due to land in an hour will become the core variable dominating the market trend for the rest of the month.
Currently, gold prices continue to trade below the 3,400 threshold, maintaining a weak market structure. The 3,400 level serves as a key watershed between bulls and bears, and the validity of its breakthrough will determine the trend inflection point: if prices effectively hold above 3,400 after the data release, it indicates that gold will break out of its weak pattern, with the potential for an accelerated rally ahead. Conversely, if prices remain suppressed below 3,400, it is highly likely to trigger further downward exploration. It is recommended to closely monitor the breakthrough signal at the 3,400 threshold after the data release, using this as the operational basis for trend switching.
XAUUSD
buy@3370-3380
tp:3400-3420-3450
Investment itself is not the source of risk; it is only when investment behavior escapes rational control that risks lie in wait. In the trading process, always bear in mind that restraining impulsiveness is the primary criterion for success. I share trading signals daily, and all signals have been accurate without error for a full month. Regardless of your past profits or losses, with my assistance, you have the hope to achieve a breakthrough in your investment.

XAUUSD:Today's Trading Strategy
Yesterday, gold prices fluctuated greatly in the US, and around 3400 has become an important pressure level at present. If you want to short, you can consider 3395-3400. At present, the price is near 3362, and the trading idea is mainly long first.
Trading Strategy:
BUY@3357-62
TP:3375-80
↓↓↓ More detailed strategies and trading will be notified here ↗↗↗
↓↓↓ Keep updated, come to "get" ↗↗↗

Gold Falls Back Despite Geopolitical Tensions,Eyes on 3404 BreakGOLD – Overview
Gold Falls, Erasing War-Driven Gains
Gold has reversed all gains made since Israel launched strikes against Iran, despite rising geopolitical tensions.
The precious metal failed to hold its safe-haven bid and now appears to be entering a technical correction phase.
While the Federal Reserve struck a dovish tone during Wednesday’s meeting — signaling potential rate cuts this year — real rates remain elevated, which continues to weigh on non-yielding assets like gold.
Technical Outlook:
Gold corrected perfectly to our support level at 3347, as forecasted in the previous idea.
• As long as price trades above 3365, bullish momentum remains active
• Next targets: 3393 → 3404
• A 1H candle close above 3404 would confirm bullish continuation toward 3430 and 3448
A break below 3347 would shift the structure bearish.
Key Levels:
• Support: 3365 / 3347 / 3322
• Resistance: 3393 / 3404 / 3430 / 3448
previous idea:

XAUUSD: Trading Strategy for Technical Correction CycleThe morning strategy has realized profits, and the gold price has entered a technical correction cycle. From a technical perspective, gold prices were resisted near $3,380, with short-term moving averages forming suppression, and the RSI indicator falling back from overbought territory, indicating weakening bullish momentum and clear correction demand.
Core shorting range: $3,375 - $3,385
- When the price rebounds above $3,380 and falls back, with long upper shadows or bearish engulfing patterns appearing on K-lines;
- The 4-hour MACD confirms a bearish cross, and the green momentum bars start to expand.
First target: $3,360 - $3,365
- Supported by the middle (middle band) of the hourly Bollinger Bands.
Second target: $3,350 - $3,355
- Supported by the 5-day moving average on the daily chart, resonating with previous lows.
- Stop-loss level: $3,395 (10 USD above the previous high to control single-trade risk)
- Position management: It is recommended to use a 10% position. If the price hits the resistance at $3,385, positions can be built in batches (5% + 5%) to reduce the risk of chasing gains.
I am committed to sharing trading signals every day. Among them, real-time signals will be flexibly pushed according to market dynamics. All the signals sent out last week accurately matched the market trends, helping numerous traders achieve substantial profits. Regardless of your previous investment performance, I believe that with the support of my professional strategies and timely signals, I will surely be able to assist you in breaking through investment bottlenecks and achieving new breakthroughs in the trading field.

XAUUSDAnother trade for today is once again from Gold—no surprises there! 😊
My strategy has just signaled a buy opportunity on the precious metal, and I wanted to share this setup with you as well.
🔍 Trade Details
✔️ Timeframe: 15-Minute
✔️ Risk-to-Reward Ratio: 1:2
✔️ Trade Direction: Buy
✔️ Entry Price: 3374.92
✔️ Take Profit: 3384.32
✔️ Stop Loss: 3370.21
🔔 Disclaimer: This is not financial advice. I’m simply sharing a trade I’ve taken based on my personal trading system, strictly for educational and illustrative purposes.
📌 Interested in a systematic, data-driven trading approach?
💡 Follow the page and turn on notifications to stay updated on future trade setups and advanced market insights.

Gold is in the Bearish DirectionHello Traders
In This Chart GOLD HOURLY Forex Forecast By FOREX PLANET
today Gold analysis 👆
🟢This Chart includes_ (GOLD market update)
🟢What is The Next Opportunity on GOLD Market
🟢how to Enter to the Valid Entry With Assurance Profit
This CHART is For Trader's that Want to Improve Their Technical Analysis Skills and Their Trading By Understanding How To Analyze The Market Using Multiple Timeframes and Understanding The Bigger Picture on the Charts

Accurately grasp the interest rate trend, today's gold layout📰 Impact of news:
1. The interest rate remains unchanged and leads to new lows in the short term
2. Geopolitical tensions provide support for risk aversion
📈 Market analysis:
I told you yesterday that 3363 is not the recent low. Today's lowest point has reached around 3347. The current day's K-line closed with a medium-sized negative line with balanced upper and lower shadows. The shape shows that gold will fluctuate in the short term and be bearish. Therefore, it is not suitable to blindly guess the bottom in the short term. As geopolitical tensions still exist, it is expected that the lowest level may reach 3330. During the day, focus on the upper resistance range of 3380-3390. If the rebound is blocked, try to intervene with short orders. The lower support is at the key level of 3330-3320. Pay attention to the defense of the support area.
🏅 Trading strategies:
BUY 3335-3325
TP 3360-3380-3390-3400
SELL 3375-3385
TP 3365-3355-3345-3300
OANDA:XAUUSD FX:XAUUSD FOREXCOM:XAUUSD FXOPEN:XAUUSD TVC:GOLD

XAUUSD Drop to daily support?XAUUSD After testing the daily resistance market has managed to reject with a momentum to daily 20ema early today. As we can see series of lower low and lower highs, price may continue to drop to daily 20ema again as, from weekly perspective we can see that price is pushing down to potentially to weekly key level of resistance.

Gold Market Update: Bulls Will target 3750 USD after 3500 USD🏆 Gold Market Mid-Term Update (June 19, 2025)
📊 Price & Technical Outlook
Current Spot Price: ~$3,365
Technical Setup
Inverted H&S pattern forming/completed on higher timeframes — confirms bullish reversal structure.
Reload (buy) zone: $3,250–$3,275 (ideal accumulation range for bulls if price pulls back).
Swing trade setup: Entry: $3,250–$3,275 (reload zone)
Take Profit (TP): $3,750
Support: Major at $3,250–$3,275 (break below = reassess bullish bias).
Resistance: $3,450–$3,500 ; next major resistance: $3,600, then $3,750.
Price consolidating above $3,250–$3,350 is technically healthy — maintaining bullish structure.
🏆 Bull Market Overview
The pullback appears complete; uptrend resumes amid strong macro/geopolitical drivers (inflation, rates, safe haven flows).
Key Levels: $3,000 (macro support), $3,250 (bulls must defend), $3,500 (breakout zone), $3,750 (swing TP).
Short-term dips = buying opportunities — “Buy the Dip” remains favored as long as support holds. Upside targets: Immediate: $3,600 Swing target: $3,750
Summary:
Gold remains in a bullish mid-term structure, with the inverted H&S pattern pointing to higher prices ahead. Bulls look to reload at $3,250–$3,275, targeting $3,750 for swing trades. As long as $3,180–$3,200 holds, buying dips is the play. A sustained breakout above $3,400–$3,600 opens the door for new all-time highs.

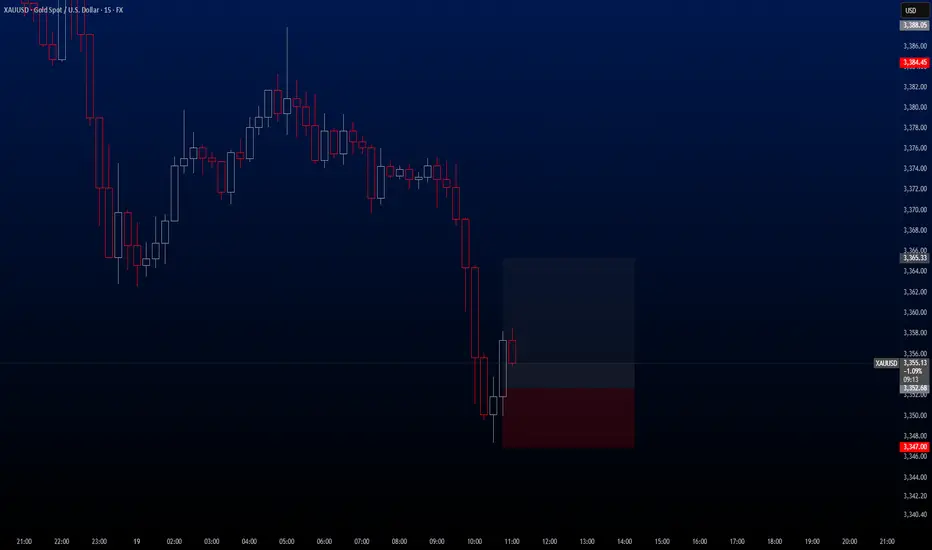
XAUUSD Hello traders,
There is a great opportunity for a buy trade on the XAUUSD pair, and I wanted to share it with you as well.
🔍 Trade Details
✔️ Timeframe: 15-Minute
✔️ Risk-to-Reward Ratio: 1:2
✔️ Trade Direction: Buy
✔️ Entry Price: 3352.68
✔️ Take Profit: 3365.33 / TP 2 / 3369.93
✔️ Stop Loss: 3347.00
🔔 Disclaimer: This is not financial advice. I’m simply sharing a trade I’ve taken based on my personal trading system, strictly for educational and illustrative purposes.
📌 Interested in a systematic, data-driven trading approach?
💡 Follow the page and turn on notifications to stay updated on future trade setups and advanced market insights.
Wyke of Gold ZoneHey guys as we can see we have a super breakout from the sideways phase and now with the retest we go Liq hunting :D

XAUUSD - 4H Breakout and Retest Setup🟡🟡🟡
🕒 June 17, 2025
Bias: Medium-Term Bullish
Structure: Breakout → Retest → Continuation
Context: Trendline break + confluence with EMA + prior resistance turned support
🔍 Market Structure Insight:
Major descending trendline broken with strong impulsive momentum.
Pullback held at the intersection of:
Broken trendline retest
EMA 60 dynamic support
Bullish structure of HL-HH (Higher Low / Higher High)
Strong bullish candle at support
✅ Trade Plan – Buy Stop Setup
Entry (Buy Stop): 3402
SL: 3373 (below the pullback structure + EMAs)
TP1: 3430 (local resistance area)
TP2: 3470 (measured move from previous leg height)
#XAUUSD #Gold #TechnicalAnalysis #BreakoutSetup #Forex #EMA #SqueezePlay #TrianglePattern #tradingview #MJTrading
