Gold Spot Price Analysis (4-Hour Chart)4-hour candlestick chart for the Gold Spot price in U.S. Dollars (XAUUSD). The chart shows a recent downward trend with a notable dip, followed by an upward correction. A technical analysis pattern is highlighted within a green rectangle, indicating a potential bullish reversal. The current price is $3,374.76, with a decrease of $13.40 (-0.40%). The chart provides insights into short-term price movements and potential trading opportunities.
Xauusd(w)

Potential bearish drop off major support?The Gold (XAU/USD0 has broken out of the pivot which acts as an overlap support and could drop to the 1st support which has been identified as an overlap support.
Pivot: 3,374.04
1st Support: 3,341.44
1st Resistance: 3,398.38
Risk Warning:
Trading Forex and CFDs carries a high level of risk to your capital and you should only trade with money you can afford to lose. Trading Forex and CFDs may not be suitable for all investors, so please ensure that you fully understand the risks involved and seek independent advice if necessary.
Disclaimer:
The above opinions given constitute general market commentary, and do not constitute the opinion or advice of IC Markets or any form of personal or investment advice.
Any opinions, news, research, analyses, prices, other information, or links to third-party sites contained on this website are provided on an "as-is" basis, are intended only to be informative, is not an advice nor a recommendation, nor research, or a record of our trading prices, or an offer of, or solicitation for a transaction in any financial instrument and thus should not be treated as such. The information provided does not involve any specific investment objectives, financial situation and needs of any specific person who may receive it. Please be aware, that past performance is not a reliable indicator of future performance and/or results. Past Performance or Forward-looking scenarios based upon the reasonable beliefs of the third-party provider are not a guarantee of future performance. Actual results may differ materially from those anticipated in forward-looking or past performance statements. IC Markets makes no representation or warranty and assumes no liability as to the accuracy or completeness of the information provided, nor any loss arising from any investment based on a recommendation, forecast or any information supplied by any third-party.

Gold- Back to 3300 again?After Monday’s correction into the 3380 support zone, Gold entered a consolidation phase. Bulls attempted to push higher but failed to reclaim the 3400 resistance area.
❓ Is this just the beginning of a deeper leg down?
🔻 Why further downside is likely:
• Price broke decisively below the 3380 horizontal support just hours ago
• The market is now trading around 3365, confirming bearish momentum
• 3400 remains unbroken on the daily chart – keeping the downward pressure
📌 Trading plan:
As long as we don’t see a daily close above 3400, I’m selling rallies. A test of the 3300 level is very likely if current pressure continues.
Disclosure: I am part of TradeNation's Influencer program and receive a monthly fee for using their TradingView charts in my analyses and educational articles.

GOLD H1 Intraday Chart Update For 19 June 2025Hello Traders,
For today market still stuck in between 3350 to 3400 Psychological levels we still need to wait for clear breakout of 3400 level
Today scalping range is 3360-90 but remember must placing SL
if market goes below 3350 clearly then it will move towards 3321 Major Support level
Reminder: There is Bank Holiday in US
Disclaimer: Forex is Risky

XAU/USD 4H Market Analysis- 19 June 2025XAU/USD 4H Market Analysis
Market Structure: Gold has been in a mild uptrend on the 4‑hour chart, making higher lows and highs since early June. The recent swing high was around ~$3,428 (mid-June), and price has pulled back toward the rising support line near ~$3,373.
A break above the recent high (around $3,404–$3,428) would continue the bull trend; conversely, a drop below the ~3,373 trendline/50% Fib level would signal a bearish turn.
In other words, bulls remain in control as long as ~$3,373 holds – breaking that would threaten lower support around ~$3,338.
Overall Bias: Moderately bullish on 4H. Gold is respecting its rising trendline and 50-period EMA, and analysts note that holding above ~$3,373 keeps the uptrend intact.
Momentum (MACD) is neutral to slightly bearish short-term, so we expect consolidations and range bounces more than a reversal.
In summary, assume an upward bias while price stays above key support near $3,370–$3,380; a firm break below would flip bearish.
Key SMC/Zones:
Price is currently in a range/consolidation roughly between $3,370 and $3,400.
Important zones include:
Demand (Support) Zone:
~ $3,368–$3,378 — this 50% Fib retracement area has been defended as a bullish order block.
Below that, stronger supports sit near ~ $3,354 and $3,333 .
Supply (Resistance) Zone:
~$3,395–$3,415 — a cluster of swing highs and Fib levels. Analysts highlight $3,395, $3,412, $3,435 and even $3,450 as major resistance barriers.
In particular, the $3,400 level is a known psychological and technical ceiling.
Trendlines/BOS: The rising 4H trendline (currently near $3,370–$3,380) is key support.
A break of structure (BOS) below that line would be a bearish Change-of-Character. Similarly, the prior swing low around $3,373 is a flip zone – bulls want to keep that hold.
Liquidity: Stop-loss/liquidation clusters may lie just above recent highs ($3,428–$3,450) and just below recent lows ($3,338–$3,354). For example, stops above $3,428 could fuel a rally if hit, and stops below $3,338 could accelerate a drop.
In short, high-probability zones on the 4H chart are around ~$3,370 (demand/support) and ~$3,400 (supply/resistance).
We’ll look for trades that align with that structure (see setups below).
1H Trade Setups (Aligned with 4H Bias)
Long around $3,370–3,375 (Buy Dip to Demand Zone) –
Entry: ~3,370–3,375 (green zone). Stop: ~$3,365 (≈$5 below zone). Take-Profit: $3,380 first, then $3,390–$3,400.
Reason: This zone is a 4H demand area (50% Fib + order block) and coincides with the rising 4H trendline.
Price has repeatedly bounced here, so a bullish reversal is likely.
Trigger: Look for a bullish 1H signal (e.g. engulfing or pin bar) at ~3,370–3,375, or a break of the short-term 1H down-structure.
Entry on such a signal would target a retest of the mid-range (~3,380) and beyond toward resistance.
Short around $3,395–3,400 (Sell Rally to Supply) –
Entry: ~3,395–3,400 (red zone). Stop: ~$3,405 (≈$5 above zone). Take-Profit: $3,375 first, then $3,365.
Reason: This area is a clear 4H supply zone (near multiple Fibonacci levels/resistance).
It’s just below the $3,400 psychological barrier. A failure or bearish reversal here would likely send price back toward the demand zone below.
Trigger: Watch for a bearish 1H candle or a break of the short-term 1H up-structure in the 3,395–3,400 range. A clear rejection (e.g. bearish engulfing or strong wick) would be the signal to enter short.
(Note: If price breaks cleanly above $3,405–3,410 instead, a bullish continuation trade would then be favored, targeting $3,415+.)
Takeaway: Trade gold with the 4H structure in mind. With price above the ~$3,370 trend support, favor longs on pullbacks into that demand zone and shorts only at proven supply near $3,400. Always use a tight ~$5 stop beyond each zone and scale out at logical pivot levels to manage risk.

Data is stable. Will the price go down?Information summary:
The Fed kept the benchmark interest rate unchanged at 4.25%-4.50%, and did not make a rate cut decision for four consecutive meetings, which was in line with market expectations. The Fed said that uncertainty about the outlook has eased, but it is still at a high level. The Fed lowered its GDP forecast for 2025 to 1.4%, while raising its inflation forecast to 3%.
The Fed kept interest rates unchanged, which may suggest that the pace of future rate cuts will slow down.
Market analysis:
From the current 4-hour chart:
The price has fallen below the key support level of 3380. If it returns to below 3370 again, it is very likely to reach today's low. The low point of the downward trend is at the extreme position of 3350-3330.
From the hourly chart, the downward range has also been broken. The early rebound in the Asian market also failed to stabilize above the support level. Then from the hourly Fibonacci, the 0.382 position below is around 3350.
Therefore, if it goes down, the first target is also around 3350.
Operation strategy:
Short around 3380, stop loss at 3390, profit range 3350-3330.

XAUUSD MARKET UPDATE 19 - 06 - 2025This chart presents a technical analysis of Gold CFDs (XAU/USD) on the 30-minute timeframe. Here's a breakdown of the key elements:
Chart Structure & Patterns:
Descending Channel: Price has been consolidating in a downward-sloping channel (marked in blue).
Projected Move: The sketch on the chart shows a potential false breakdown below the channel support, followed by a strong bullish reversal.
Support Zone: Around $3,321.534 to $3,341, highlighted in green/red — this is the expected reversal zone.
Resistance/Target Zone: A sharp upward arrow suggests the price could move towards the $3,453.550 area, the previous high and a key resistance.
Current Price:
$3,373.133 (as per the chart), sitting near the middle of the channel.
Analysis Summary:
This is a bullish setup expecting:
1. A dip to retest or fake out below the channel.
2. Reversal from the demand zone (highlighted green).
3. Breakout from the descending channel leading to a strong rally.
Invalidation likely occurs below $3,321.
Trade Idea (based on the chart):
Buy near: $3,340–$3,325
Stop loss: Below $3,321
Target: $3,440–$3,453
Would you like a written trading plan or risk management breakdown for this idea?

XAU/USD: Buy on DipsDriving Logic
- Fed policy decision in line with expectations; escalation of Iran-Israel conflict boosts safe-haven demand; gold ETF inflows hit $230M daily, a 1-year high.
Key Levels
- Strong resistance at $3,400; support at $3,360-$3,370 (confluence of 50-day MA and Fibonacci retracement).
Trading Strategy
- Long on bullish candlestick reversal at $3,370-$3,360; stop-loss at $3,350; targets at $3,390-$3,400. Monitor PPI data and Middle East developments.
XAUUSD
buy@3360-3370
tp:3385-3395
I am committed to sharing trading signals every day. Among them, real-time signals will be flexibly pushed according to market dynamics. All the signals sent out last week accurately matched the market trends, helping numerous traders achieve substantial profits. Regardless of your previous investment performance, I believe that with the support of my professional strategies and timely signals, I will surely be able to assist you in breaking through investment bottlenecks and achieving new breakthroughs in the trading field.

GOLD Rising Support Ahead! Buy!
Hello,Traders!
GOLD is trading in an uptrend
So despite the price is going
Down now we will be expecting
A strong rebound and a move up
After the price hits the
Rising support below
Buy!
Comment and subscribe to help us grow!
Check out other forecasts below too!
Disclosure: I am part of Trade Nation's Influencer program and receive a monthly fee for using their TradingView charts in my analysis.

Current Gold Trend Analysis and Trading RecommendationsOn Wednesday, the morning strategy suggested going long on gold at 3,375-3,365, perfectly seizing the pullback low and rebounding to the 3,400 level as expected. Today, there is also the Fed interest rate decision. Before the data release, short positions can be taken if the 3,400-3,405 level remains unbroken. If the 3,405-3,410 level is broken, we will continue to be bullish. Gold is in short-term oscillation, so try not to chase the market. Wait for a good entry opportunity. The upper level has also been repeatedly contested recently, and the Fed data is likely to break the range after its release.
For gold, continue to adopt an oscillating approach. In the 4H cycle, it is operating below the middle band. The short-term range is 3,405-3,365. If it breaks above 3,405, it can continue to target 3,420 and 3,450. Conversely, if it breaks below 3,365, it can fall to 3,350. In operation, prioritize long positions with short positions as a supplement, and adjust the strategy when a breakout occurs.
XAUUSD
buy@3370-3375
tp:3390-3400-3420
sell@3395-3400
tp:3380-3370
Investment itself is not the source of risk; it is only when investment behavior escapes rational control that risks lie in wait. In the trading process, always bear in mind that restraining impulsiveness is the primary criterion for success. I share trading signals daily, and all signals have been accurate without error for a full month. Regardless of your past profits or losses, with my assistance, you have the hope to achieve a breakthrough in your investment.

XAUUSD:Fed & Middle East as Breakout CatalystsGold is currently fluctuating between $3,375 and $3,405. A breakdown below $3,375 could trigger a direct move toward $3,360, while a decisive breakout above $3,405 with sustained momentum would target $3,430.
The ability to breach this range hinges on today's Fed data release and evolving Middle East tensions. For now, adopt a range-trading strategy (sell high/buy low) within the band, and await key data to follow market momentum.
XAUUSD
sell@3395-3405
tp:3380-3370
buy@3370-3380
tp:3395-3405
I am committed to sharing trading signals every day. Among them, real-time signals will be flexibly pushed according to market dynamics. All the signals sent out last week accurately matched the market trends, helping numerous traders achieve substantial profits. Regardless of your previous investment performance, I believe that with the support of my professional strategies and timely signals, I will surely be able to assist you in breaking through investment bottlenecks and achieving new breakthroughs in the trading field.

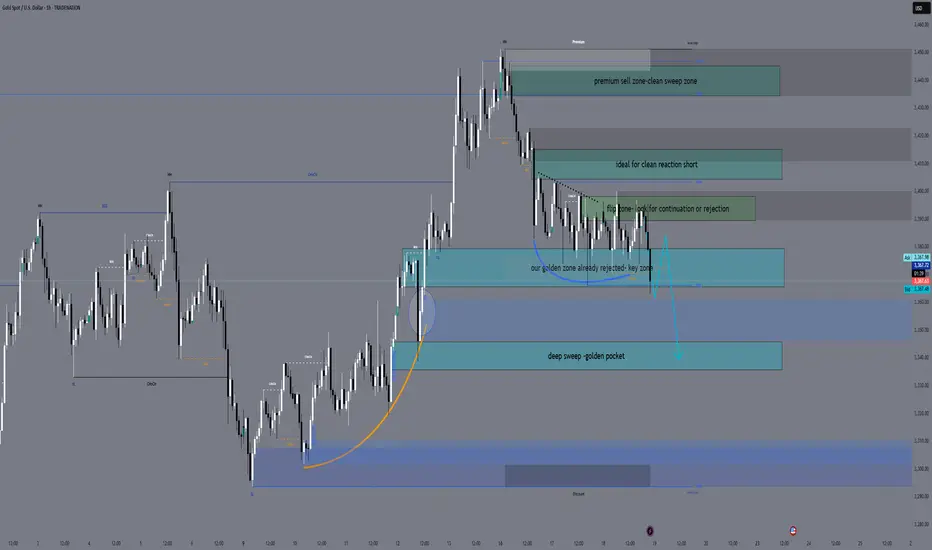
June 19 XAUUSD Setup — FOMC Aftershock or Bull Trap? Hey traders 👋
After yesterday’s FOMC fireworks and a weak reaction to initial retail sales data, gold broke structure into 3363 and is now floating below key resistance. Price is compressing under the previous H1 lower high, and liquidity continues to build on both sides — perfect conditions for engineered spikes.
Let’s break it down clearly.
🌍 Macro & Sentiment
Yesterday’s FOMC left rates unchanged, but Fed tone leaned hawkish.
Retail Sales and Unemployment Claims disappointed — slight downside pressure on the dollar.
Geopolitical front remains tense: no ceasefire in Gaza, Iran-Israel rhetoric escalates, and Russia-Ukraine conflict is ongoing.
Liquidity is king — and gold is being boxed for the next big move.
📉 Bias & Structure
Daily: Compression after FOMC, lower high remains in control.
H4: Bearish break below 3380, EMA21 hovering above price.
H1: Trendline structure broken, EMA5/21 forming bearish cross, RSI below 50.
Fibo: H1 drawn from 3452 to 3363 — key golden zone at 3405–3415.
🎯 Bias: Tactical Bearish under 3415 — looking for short-term bounces or premium traps to sell.
🧠 Sniper Zones
🔻 Sell Zones
1️⃣ 3405 – 3415
→ Key golden zone + EMA21 + FVG
→ Monitor M15/M5 rejection for continuation sells
2️⃣ 3435 – 3445
→ Premium OB trap zone
→ If price spikes irrationally, this becomes the extreme reversal area
🔺 Buy Zones
1️⃣ 3365 – 3380
→ Golden buy zone — real fib confluence
→ Already tapped today, but any clean retest may offer reactive bounce trades
2️⃣ 3335 – 3345
→ Extreme flush zone — only valid if deep dump occurs
→ Watch for exhaustion and M15 reversal confirmation
🔻 Emergency Buy Zone:
3305 – 3292
🧠 Why this zone?
✅ H4 untested Order Block + FVG (June 11 candle).
✅ 78.6% Fibonacci retracement (H1 swing from 3452 → 3363).
✅ RSI likely to print oversold.
✅ Deep discount structure — potential final inducement for reversal.
🔔 Important:
This is a backup zone, not for blind entries.
It only becomes active if 3335 breaks with conviction (full candle body close + volume).
Look for M15/M5 confirmation (divergence + price action signal) before engaging.
🔄 Flip Zone
3390 – 3398
→ Volume zone from FOMC + OB test
→ If reclaimed cleanly, may flip intraday bias short-term
📌 Battle Notes
Gold tapped 3363 today, reacting mildly.
If price retraces toward 3405–3415, I’ll watch for shorts — but no early entries.
Below 3365, watch for another bounce or setup around 3345.
Flip zone remains indecisive until confirmed with volume.
🧭 Plan Recap
→ Bearish under 3415
→ Pullback into 3405–3415 = short setup
→ Retest 3365–3380 = bounce watch
→ Flush into 3335 = reversal zone
→ 3435+ = irrational spike trap
🧠 Stay sniper. Wait for price to come to your zones — and execute only on confirmed reactions.
—
🚀 If this helped bring clarity, tap that 🚀, leave your bias in the comments, and hit FOLLOW for real structure-based trading.
🟨 Disclosure: I am part of TradeNation's Influencer program and receive a monthly fee for using their TradingView charts in my analyses and educational articles.
— GoldFxMinds 🧠✨
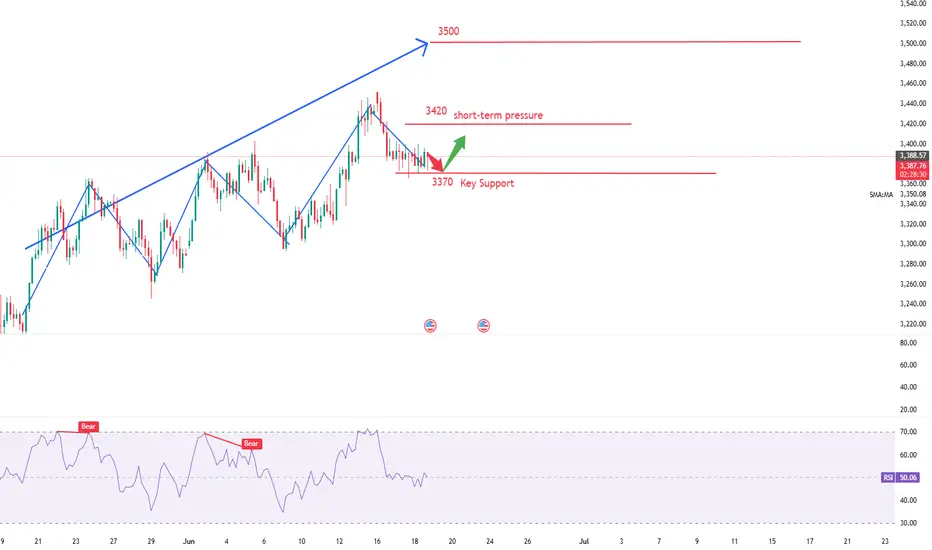
Expect gold to break 3400 for 3430 post-FedIn recent years, after the U.S. economy was hit by a round of high inflation, inflation data has gradually shown signs of easing 📉. Logically, the weakening inflation pressure should have paved the way for the Federal Reserve (Fed) to cut interest rates, but surprisingly, the Fed has chosen to remain on the sidelines and maintain its high-interest-rate policy ⚖️. The Fed's decision to keep rates high has had a significant impact on gold prices and the U.S. dollar 💱. First, high interest rates typically push up the U.S. dollar exchange rate, thereby dampening gold demand 💰↓.
Gold's price movement this week deviated from market news or expectations 📉≠📢. Driven by geopolitical conflicts, gold rallied on Friday 📈, and the momentum continued to simmer over the weekend, leading to a gap-up opening on Monday followed by a steady decline 📉. On the hourly timeframe, the low points are gradually shifting downward, with 3,400 becoming a short-term resistance level 📊. Although gold fell from 3,452, it is clearly oscillating around 3,380 🔄
I think the Fed's interest rate decision this time may cause gold to directly break through 3400 and reach around 3430 🌟📈
⚡️⚡️⚡️ XAUUSD ⚡️⚡️⚡️
🚀 Buy@ 3380 - 3385
🚀 TP 3400 - 3430
Accurate signals are updated every day 📈 If you encounter any problems during trading, these signals can serve as your reliable guide 🧭 Feel free to refer to them! I sincerely hope they'll be of great help to you 🌟 👇

Gold Spot / U.S. Dollar (XAU/USD) 4-Hour Chart4-hour candlestick chart displays the price movement of Gold Spot (XAU) against the U.S. Dollar (USD) from June 4 to June 18, 2025. The current price is 3,391.79, reflecting a +3.61 (+0.11%) change. The chart highlights a recent upward trend with a notable peak, followed by a slight pullback. Key price levels are marked, ranging from 3,320.00 to 3,420.14, with technical analysis indicators such as a resistance zone (pink) and a support zone (light green) overlaid.

GOLD ROUTE MAP UPDATEHey Everyone,
A PIPTASTIC day on the markets with our chart idea playing out perfectly!!!
Yesterdays update, we stated how we hit our Bullish target, followed with no cross and lock confirming the rejection. We then stated, how we tracked the movement down with ema5 lock confirmation into the swing range and ended with waiting for the full swing to complete into 3393.
🔄 Update:
Today we got the move into 3393 just like we analysed. We continued to see play between 3372 and 3393, giving multiple opportunities to catch bounces from the dip. We will now look for ema5 to cross and lock 3372 or 3393 to confirm direction.
We will see levels tested side by side until one of the weighted levels break and lock to confirm direction for the next range
We will keep the above in mind when taking buys from dips. Our updated levels and weighted levels will allow us to track the movement down and then catch bounces up.
We will continue to buy dips using our support levels, taking 20 to 40 pips. As stated before, each of our level structures gives 20 to 40 pip bounces, which is enough for a nice entry and exit. If you back-test the levels we shared every week for the past 24 months, you can see how effectively they were used to trade with or against short/mid-term swings and trends.
🌀 The swing ranges give bigger bounces than our weighted levels - that's the difference between the two.
BULLISH TARGET
3440 - DONE
EMA5 CROSS AND LOCK ABOVE 3340 WILL OPEN THE FOLLOWING BULLISH TARGETS
3463
EMA5 CROSS AND LOCK ABOVE 3463 WILL OPEN THE FOLLOWING BULLISH TARGET
3483
EMA5 CROSS AND LOCK ABOVE 3483 WILL OPEN THE FOLLOWING BULLISH TARGET
3508
BEARISH TARGETS
3418 -DONE
EMA5 CROSS AND LOCK BELOW 3418 WILL OPEN THE FOLLOWING BEARISH TARGET
3393 - DONE
EMA5 CROSS AND LOCK BELOW 3393 WILL OPEN THE SWING RANGE
3372 - DONE
3353
EMA5 CROSS AND LOCK BELOW 3353 WILL OPEN THE SECONDARY SWING RANGE
3330
3306
As always, we will keep you all updated with regular updates throughout the week and how we manage the active ideas and setups. Thank you all for your likes, comments and follows, we really appreciate it!
Mr Gold
GoldViewFX

Gold should focus on Federal Reserve news.Gold is experiencing short-term volatility influenced by the Federal Reserve's interest rate decision. It is advisable to avoid chasing the market and wait for favorable entry opportunities. The upper resistance level has been a site of repeated tug-of-war recently. Following the release of Fed data, there is a high probability that the trading range will be broken. From a 4-hour technical analysis perspective, the key support level for gold remains at 3,370, while the short-term resistance level is focused on 3,420.
you are currently struggling with losses,or are unsure which of the numerous trading strategies to follow,You have the option to join our VIP program. I will assist you and provide you with accurate trading signals, enabling you to navigate the financial markets with greater confidence and potentially achieve optimal trading results.
Trading Strategy:
buy@3370-3375
TP:3400-3405
Current Gold Trend Analysis and Trading RecommendationsOn Tuesday, gold dipped to around $3,374 in the early trading session, then rebounded to the intraday high. In the U.S. trading session, it is currently quoted at about $3,388, approaching the psychological level of $3,400. From the 4-hour chart of gold, the current upward momentum remains intact. The support below is focused on around $3,350, and the strong support is highlighted in the $3,350-$3,330 area, which is also the position of the 5-week moving average. Only by breaking the $3,350 area is there hope to reverse the trend and fall completely. If it does not break here, the bulls may still repeat.
Regarding the current trend, gold tends to continue to test the bottom and then rebound, maintaining a large range of sweeping. In terms of operation, it is recommended to go long when gold rebounds to the vicinity of 3370-3360, with the target looking at the 3490-3400 range. The short strategy is to go short near 3400, with the target looking at the 3370-3350 line.
XAUUSD
buy@3370-3360
tp:3390-3400
sell@3395-3400
tp:3370-3350
Investment itself is not the source of risk; it is only when investment behavior escapes rational control that risks lie in wait. In the trading process, always bear in mind that restraining impulsiveness is the primary criterion for success. I share trading signals daily, and all signals have been accurate without error for a full month. Regardless of your past profits or losses, with my assistance, you have the hope to achieve a breakthrough in your investment.

The interest rate remains volatile,and the gold operation layout📰 Impact of news:
1. Initial jobless claims data
2. US-Iran conflict continues
3. Pay attention to the Fed's decision
📈 Market analysis:
Gold has been trading sideways recently. It is expected that there will not be much fluctuation before today's Fed interest rate information and Powell's speech. It is expected to continue to fluctuate in the range of 3405-3365. At the same time, the escalation of geopolitical conflicts in the short term is also a point we need to pay attention to.
🏅 Trading strategies:
BUY 3380-3375-3365-3355
TP 3395-3400-3405
SELL 3405-3395
TP 3380-3375-3360
If you agree with this view, or have a better idea, please leave a message in the comment area. I look forward to hearing different voices.
TVC:GOLD FXOPEN:XAUUSD FOREXCOM:XAUUSD FX:XAUUSD OANDA:XAUUSD

Wide range fluctuations continue, the latest layout of gold📰 Impact of news:
1. Initial jobless claims data
2. US-Iran conflict continues
3. Pay attention to the Fed's decision
📈 Market analysis:
At present, the gold price is testing the 3380 line again, and the strong support below is 3365-3355. As long as it does not fall below this key support, the bulls will remain strong. At the same time, the two key points of 3405 and 3420 above are still short-term resistance. Breaking through may directly test 3450. In the short term, gold fluctuates repeatedly at the 3405-3365 level, temporarily maintaining a high-altitude low-multiple cycle. There is also initial jobless claims data released today. At the same time, the geopolitical situation in the short term is severe, so we need to be cautious. In addition, the New York Stock Exchange will be closed tomorrow. The focus this week is mainly on Friday, especially when it is superimposed with the Fed's interest rate decision, we need to be vigilant about the transmission effect of sudden changes in liquidity on the market.
🏅 Trading strategies:
BUY 3380-3365-3355
TP 33395-3400-3405
SELL 3405-3390
TP 3380-3360
If you agree with this view, or have a better idea, please leave a message in the comment area. I look forward to hearing different voices.
OANDA:XAUUSD FX:XAUUSD FOREXCOM:XAUUSD FXOPEN:XAUUSD TVC:GOLD

GOLD: Short Trade with Entry/SL/TP
GOLD
- Classic bearish pattern
- Our team expects retracement
SUGGESTED TRADE:
Swing Trade
Sell GOLD
Entry - 3391.03
Stop - 3394.3
Take - 3384.2
Our Risk - 1%
Start protection of your profits from lower levels
Disclosure: I am part of Trade Nation's Influencer program and receive a monthly fee for using their TradingView charts in my analysis.
❤️ Please, support our work with like & comment! ❤️

GOLD Made Inverted H&S Pattern , Long Scalping Ready !Here is my 15 mins chart on gold and we have a reversal pattern , ( inverted head & shoulders ) and we have a clear closure above our neckline so we can buy it to get the target and then wait for the news tonight and then decide the new direction after news effect .

Gold Spot / U.S. Dollar (XAUUSD) 4-Hour Chart4-hour price movement of Gold Spot (XAUUSD) against the U.S. Dollar, covering the period from late June to early July 2025. The current price is $3,381.09, reflecting a slight decrease of $7.09 (-0.21%) over the period. The chart includes candlestick patterns, with a highlighted consolidation zone and a recent downward trend. Key price levels such as $3,401.46, $3,389.38, and $3,340.00 are marked, indicating potential support and resistance zones.

SPY/QQQ Plan Your Trade For 6-18 : GAP Potential PatternToday's GAP Potential pattern suggests the SPY/QQQ may GAP a bit higher at the open, then move into a melt-up phase, trying to identify resistance, then roll into a topping pattern and move downward.
I believe the recent "rollover" of the markets (initiating last Friday with the Israel/Iran conflict) is still dominating the markets and news related to the ongoing conflict could drive a moderate pullback in US assets.
Headed into the Juneteenth holiday (Thursday, June 19), I suggest traders prepare for the US markets to move into somewhat of a SETTLEMENT mode today - where traders don't want to hold too many open positions into Friday's trading.
Additionally, Gold and Silver could move into a very strong upward price move over the next 4-5+ days. So be prepared for metals to hedge risks when the US stock market is closed.
BTCUSD seems to be struggling into the FLAG APEX. I'm waiting to see if my FLAG count is correct and if we get the breakdown in BTCUSD as I expect.
Get some.
#trading #research #investing #tradingalgos #tradingsignals #cycles #fibonacci #elliotwave #modelingsystems #stocks #bitcoin #btcusd #cryptos #spy #gold #nq #investing #trading #spytrading #spymarket #tradingmarket #stockmarket #silver
