The interest rate remains volatile,and the gold operation layout📰 Impact of news:
1. Initial jobless claims data
2. US-Iran conflict continues
3. Pay attention to the Fed's decision
📈 Market analysis:
Gold has been trading sideways recently. It is expected that there will not be much fluctuation before today's Fed interest rate information and Powell's speech. It is expected to continue to fluctuate in the range of 3405-3365. At the same time, the escalation of geopolitical conflicts in the short term is also a point we need to pay attention to.
🏅 Trading strategies:
BUY 3380-3375-3365-3355
TP 3395-3400-3405
SELL 3405-3395
TP 3380-3375-3360
If you agree with this view, or have a better idea, please leave a message in the comment area. I look forward to hearing different voices.
TVC:GOLD FXOPEN:XAUUSD FOREXCOM:XAUUSD FX:XAUUSD OANDA:XAUUSD
Xauusd(w)

Wide range fluctuations continue, the latest layout of gold📰 Impact of news:
1. Initial jobless claims data
2. US-Iran conflict continues
3. Pay attention to the Fed's decision
📈 Market analysis:
At present, the gold price is testing the 3380 line again, and the strong support below is 3365-3355. As long as it does not fall below this key support, the bulls will remain strong. At the same time, the two key points of 3405 and 3420 above are still short-term resistance. Breaking through may directly test 3450. In the short term, gold fluctuates repeatedly at the 3405-3365 level, temporarily maintaining a high-altitude low-multiple cycle. There is also initial jobless claims data released today. At the same time, the geopolitical situation in the short term is severe, so we need to be cautious. In addition, the New York Stock Exchange will be closed tomorrow. The focus this week is mainly on Friday, especially when it is superimposed with the Fed's interest rate decision, we need to be vigilant about the transmission effect of sudden changes in liquidity on the market.
🏅 Trading strategies:
BUY 3380-3365-3355
TP 33395-3400-3405
SELL 3405-3390
TP 3380-3360
If you agree with this view, or have a better idea, please leave a message in the comment area. I look forward to hearing different voices.
OANDA:XAUUSD FX:XAUUSD FOREXCOM:XAUUSD FXOPEN:XAUUSD TVC:GOLD

GOLD: Short Trade with Entry/SL/TP
GOLD
- Classic bearish pattern
- Our team expects retracement
SUGGESTED TRADE:
Swing Trade
Sell GOLD
Entry - 3391.03
Stop - 3394.3
Take - 3384.2
Our Risk - 1%
Start protection of your profits from lower levels
Disclosure: I am part of Trade Nation's Influencer program and receive a monthly fee for using their TradingView charts in my analysis.
❤️ Please, support our work with like & comment! ❤️

GOLD Made Inverted H&S Pattern , Long Scalping Ready !Here is my 15 mins chart on gold and we have a reversal pattern , ( inverted head & shoulders ) and we have a clear closure above our neckline so we can buy it to get the target and then wait for the news tonight and then decide the new direction after news effect .

Gold Spot / U.S. Dollar (XAUUSD) 4-Hour Chart4-hour price movement of Gold Spot (XAUUSD) against the U.S. Dollar, covering the period from late June to early July 2025. The current price is $3,381.09, reflecting a slight decrease of $7.09 (-0.21%) over the period. The chart includes candlestick patterns, with a highlighted consolidation zone and a recent downward trend. Key price levels such as $3,401.46, $3,389.38, and $3,340.00 are marked, indicating potential support and resistance zones.

SPY/QQQ Plan Your Trade For 6-18 : GAP Potential PatternToday's GAP Potential pattern suggests the SPY/QQQ may GAP a bit higher at the open, then move into a melt-up phase, trying to identify resistance, then roll into a topping pattern and move downward.
I believe the recent "rollover" of the markets (initiating last Friday with the Israel/Iran conflict) is still dominating the markets and news related to the ongoing conflict could drive a moderate pullback in US assets.
Headed into the Juneteenth holiday (Thursday, June 19), I suggest traders prepare for the US markets to move into somewhat of a SETTLEMENT mode today - where traders don't want to hold too many open positions into Friday's trading.
Additionally, Gold and Silver could move into a very strong upward price move over the next 4-5+ days. So be prepared for metals to hedge risks when the US stock market is closed.
BTCUSD seems to be struggling into the FLAG APEX. I'm waiting to see if my FLAG count is correct and if we get the breakdown in BTCUSD as I expect.
Get some.
#trading #research #investing #tradingalgos #tradingsignals #cycles #fibonacci #elliotwave #modelingsystems #stocks #bitcoin #btcusd #cryptos #spy #gold #nq #investing #trading #spytrading #spymarket #tradingmarket #stockmarket #silver

XAUUSD:Go long
As can be seen from the chart, the decline of gold actually did not fall below 3380 each time, the actual close longer lower shadow, and from yesterday's trend can be seen 3400 is a certain pressure exists, so today to see whether this position can break through. After the break, we continue to look up, and then increase the trading range.
For now or first around the narrow range to trade.
Trading Strategy:
BUY@3378-84
TP:3395-3400
↓↓↓ More detailed strategies and trading will be notified here ↗↗↗
↓↓↓ Keep updated, come to "get" ↗↗↗

DXY 2H Analysis – June 18, 2025Pair : dxy ,,💲
Is the bullish move fading out? 📉
Price reacting near upper trendline resistance 🔵
Potential correction or final push before deeper drop ❗
Wave count suggests i–ii–iii–iv completed; wave v setup expected 🔁
Watch the reaction in the highlighted zone 📦
Either short continuation or a bullish trap loading 🧠
📌 Strategy: Elliott Wave + Trendline Confluence
📅 Stay sharp. Events approaching 📰
📈 Trade with a plan, not hope.
🔔 Follow @Greenfireforex for more real-time setups and ideas.

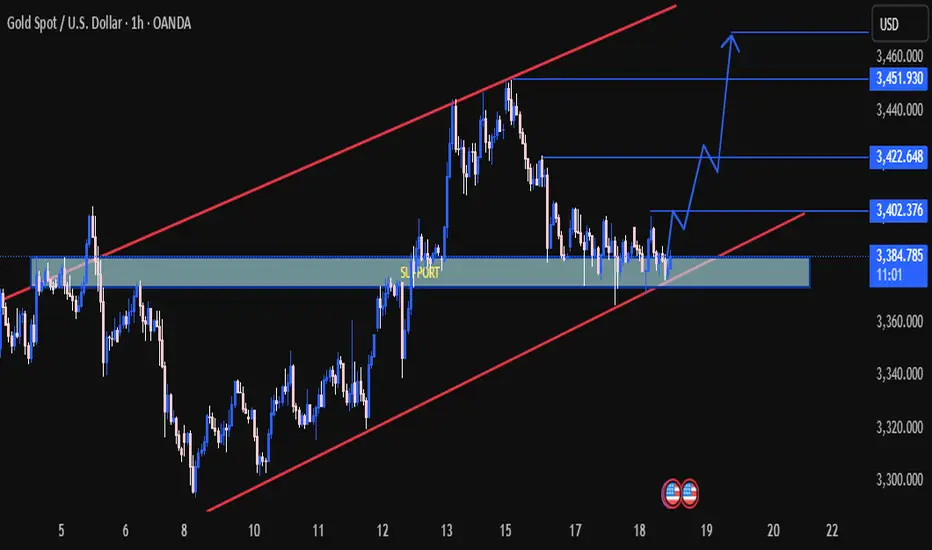
GOLD SPOT (XAU/USD) 1H ANALYSIS BULLISH STRUCTURE HOLDING STRONG📈 GOLD SPOT (XAU/USD) 1H ANALYSIS – BULLISH STRUCTURE HOLDING STRONG! 🚀✨
🔍 Overview:
Gold is currently trading within a well-defined ascending channel 📊, showing clear bullish intent. Price action has respected the lower channel support, bouncing strongly from a key demand zone highlighted in blue.
🟦 Support Zone:
The price is consolidating just above the $3,385–$3,390 support zone 🛡️, which has acted as a springboard multiple times in the past. This area aligns perfectly with the lower trendline, increasing its reliability.
📍 Key Price Targets:
🎯 $3,402 – First breakout confirmation and minor resistance.
🎯 $3,422 – Mid-level target, possible resistance.
🎯 $3,452 – High-probability target if bullish momentum continues.
🎯 $3,460+ – Extended target aligning with the channel top.
📈 Technical Structure:
Price is respecting higher lows and higher highs, maintaining bullish momentum.
A breakout above $3,402 could trigger the next leg up.
Market is forming a bullish flag/pennant consolidation—potential breakout pending ⏳.
⚠️ Risk Zone:
A break below the demand zone and the channel could invalidate the bullish setup ❌. Close monitoring of lower structure is essential.
✅ Conclusion:
As long as price holds above the key support zone and within the ascending channel, bullish continuation remains the favored scenario. A breakout above interim resistance levels could send Gold toward $3,450+! 🌟📊
🔔 Watch for bullish confirmation candles or volume spikes before entry!
📅 Chart published: June 18, 2025 | XAU/USD | 1H timeframe
🧠 Strategy: Bullish breakout play 📈
💡 Sentiment: Moderately Bullish ♻️
Gold | 4h Structural LookoutPEPPERSTONE:XAUUSD
📅 June 18, 2025
Chart Title: “Gold's Battle at the Midpoint – Compression Before Explosion”
Bias: Neutral-to-Bullish
Structure: Ranging with Bullish Channel
✳️ Technical Summary:
Gold continues to coil near the upper half of its multi-month structure, testing traders’ patience before a potentially explosive move. Current PA is forming a tight consolidation right beneath mid-channel resistance, suggesting a directional breakout is imminent — especially with the FOMC catalyst ahead.
📏 Key Chart Features:
Clear Rising Channel: Acting as medium-term trend guide
Major Consolidation: Identified around 3,330–3,380
Historical Boxes & Reaction Lows: Multiple orange circles show clear buying interest zones
Possible Long-Term Range: Defined between 3,123 and ATH zone (3,500)
EMA Support: Price currently holding both 15 & 60 EMAs
📈 Scenarios to Watch:
🔼 Bullish Breakout Path:
Trigger: Break and close above 3,400
Confirmation: Follow-through above consolidation +full body close
TP1: 3,460
TP2: ATH retest around 3,500–3,540
SL: Below 3,320 or lower trendline
Invalidation: Break below channel
🔽 Bearish Breakdown Path:
Trigger: Breakdown below 3,325 support
First Target: 3,250
Expansion Target: 3,123 – base of the macro range
Extreme Bear Target: 3,000 zone
SL: Above 3,400
Consolidation Zoom in:
#Xauusd #Gold #Trading #MJtrading #forex #Chart #chartanalysis #signal #freesignal

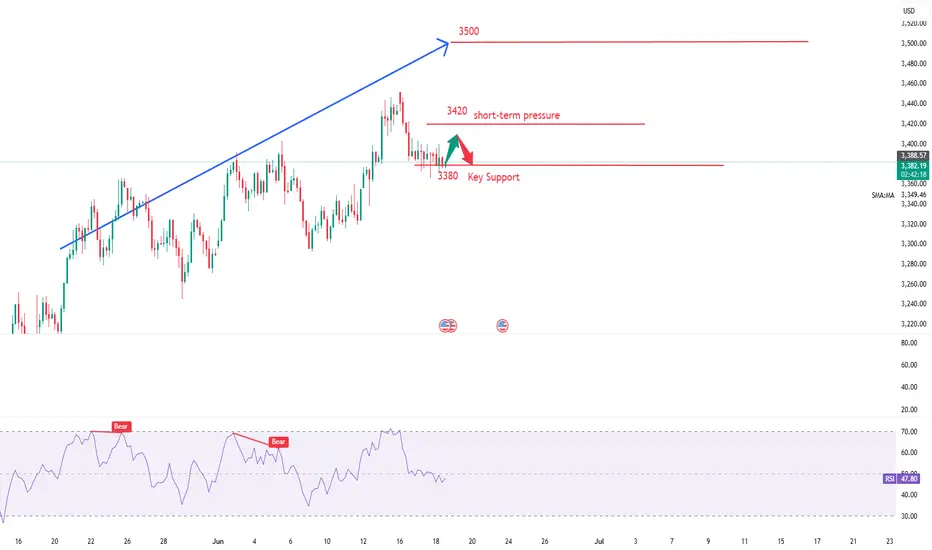
Strong support at 3365/3350In recent years, following the easing of high inflation pressures in the U.S., the Federal Reserve has maintained a high-interest-rate policy, a decision that has significantly impacted gold and U.S. dollar markets: high rates have boosted the U.S. dollar while suppressing gold demand 📉.
This week, gold prices defied market expectations: fueled by geopolitical conflicts, gold surged last Friday and opened higher on Monday, only to trend lower thereafter ⬇️. The hourly chart shows a series of lower lows, with 3,400 emerging as short-term resistance, while gold currently oscillates around 3,380 🔄. With key economic data pending release, gold may still rebound (the initial jobless claims data was advanced to Wednesday) ⏰.
Technically, gold remains in a unilateral uptrend on the daily chart, with strong support at 3,365/3,350 from the 5-day and 10-day moving averages—though not yet in an extremely strong trend 📈. Key resistances lie at 3,430/3,450: a break above 3,450 could pave the way for a challenge to the previous high of 3,500 🏔️!
⚡️⚡️⚡️ XAUUSD ⚡️⚡️⚡️
🚀 Buy@ 3365 - 3375
🚀 TP 3395 - 3405
Accurate signals are updated every day 📈 If you encounter any problems during trading, these signals can serve as your reliable guide 🧭 Feel free to refer to them! I sincerely hope they'll be of great help to you 🌟 👇

Distribution Zone Triggered⏰ Timeframe: 15-Minute (M15)
💱 Pair: EUR/USD
📍 Event: Distribution Zone Triggered ‼️
🔍 Market Structure Breakdown: 1️⃣ Accumulation Phase 🟨
📌 Smart money builds long positions
📌 Stops hunted below support
2️⃣ Manipulation Phase 🟦
📌 Liquidity grab above resistance
📌 Trap set for retail buyers
3️⃣ Distribution Phase 🟥
📌 Entry for institutional sellers
📌 Shift in order flow to bearish bias
📊 What’s next?
🔻 Price likely heading to lower demand zones
🔄 Expecting continuation move post-distribution
🧠 Powered by Smart Money Concepts + Wyckoff Logic
🎯 Trader's Tip: Always wait for confirmation inside distribution to avoid false entries!
#EURUSD #DistributionZone #SmartMoney #WyckoffLogic #LiquidityGrab #SMCTrading

Technical Analysis on Gold Trading TrendsGold maintained a mild intraday downward trend, with the price currently hovering around $3,381 per ounce. As tensions in the Middle East persist, gold is awaiting the Federal Reserve's resolution to gain a clear direction.
With risk sentiment stabilizing, gold prices fell in early Wednesday trading, moving away from the $3,400 per ounce threshold. Amid lingering geopolitical tensions between Israel and Iran, all eyes are focused on the Federal Reserve's policy announcement, which is expected to trigger sharp volatility in gold prices. Investors need to closely monitor the Fed's policy guidance, the trend of the U.S. dollar, and the latest developments in the Middle East situation.
In the long term, the low-interest-rate environment and global economic uncertainties will continue to enhance gold's attractiveness, but short-term volatility may intensify. It is recommended that investors exercise caution when trading. In addition, the initial value of the U.S. May annualized building permits and the U.S. May annualized new housing starts will be released on this trading day, which investors should also pay attention to.
you are currently struggling with losses,or are unsure which of the numerous trading strategies to follow,You have the option to join our VIP program. I will assist you and provide you with accurate trading signals, enabling you to navigate the financial markets with greater confidence and potentially achieve optimal trading results.
Gold Supported by Central Bank Demand Despite Global UncertaintyGold Prices Likely Supported by Central Bank Demand
Gold prices are expected to find continued support from strong central bank buying. Since the start of the Ukraine war, average annual central bank gold purchases have doubled from 500 to 1,000 tons.
The primary drivers remain gold’s role as a crisis hedge, portfolio diversifier, and store of value.
While de-dollarization is not an explicit motivation, many central banks anticipate a gradual decline in the U.S. dollar’s share of global reserves.
Technical Outlook:
Gold remains in bullish territory as long as it trades above 3365. This supports a move toward 3403, and if the price stabilizes above that level, the uptrend may extend toward 3430 and 3448.
A break below 3364 would invalidate the bullish structure and shift momentum downward, with potential targets at 3347 and 3322.
Key Levels:
• Resistance: 3403 / 3430 / 3448
• Support: 3365 / 3347 / 3322

Elliott Wave Analysis – XAUUSD | June 18, 2025🌀 Current Wave Structure on H4
The recent drop has broken below the previously labeled wave 1 zone, requiring an adjustment to our wave count. Following the abc corrective move (black), a potential triangle formation is emerging.
At this point, we’re monitoring two possible scenarios:
🔹 Scenario 1 – Triangle as a Wave X Correction:
Price is forming an abcde triangle, potentially part of a larger WXY corrective structure. If this plays out, we may see a strong decline forming wave Y, targeting a break below 3297, and possibly extending to 3248.
🔹 Scenario 2 – Leading Diagonal Triangle as Wave 1:
If this is a leading diagonal triangle for wave 1, then wave 1 is likely completed, and we are currently in wave 2. In this scenario, price should hold above 3248, with likely support zones around 3335 or 3300.
🎯 Key Price Zones & Resistance Levels
Major Resistance: 3389 – 3402 (based on volume profile) – prime area for potential short setups.
Short-term Resistance Levels: 3389, 3402, 3412 – watch for reversal signals here.
🔻 Momentum Outlook
Daily (D1): Momentum is declining and expected to enter oversold territory within 2 candles – indicating a weakening downtrend and supporting the leading diagonal scenario.
H4: Momentum is preparing to turn bearish – supports short opportunities.
H1: Already turned bullish – suggests a possible corrective bounce before the next drop.
📌 Trade Plan
🔴 Sell Zone: 3400 – 3403
• SL: 3410
• TP1: 3365
• TP2: 3335
🟢 Buy Zone 1: 3335 – 3332
• SL: 3325
• TP1: 3365
• TP2: 3402
🟢 Buy Zone 2: 3302 – 3209
• SL: 3292
• TP1: 3335
• TP2: 3365
• TP3: 3402

EURUSD H2 Best Levels to BUY/SELL and Market Update🏆 EURUSD Market Update m20 short-term trade
📊 Technical Outlook
🔸Short-term: BEARS 1275
🔸1500/1540 short sell rips/rallies
🔸Mid-Term outlook: BULLS 1750
🔸bulls buy low 1250/1275 reload
🔸bulls exit at 1750 swing trade
🔸Price Target Bears: 1250/1275
🔸Price Target Bulls: 1750
🌍 Macro & Political Drivers
U.S. tax & spending concerns: The Congressional Budget Office now projects President Trump's tax‑and‑spending bill will raise deficits by about $2.8 trillion over the next decade. This massive debt addition is pressuring the U.S. dollar, as rising Treasury issuance and weaker fiscal confidence weigh on demand.
Geopolitical tensions: Escalation in the Israel–Iran conflict is pushing investors toward the safe-haven U.S. dollar. The DXY jumped to around 98.80 as President Trump’s remarks on Iran sent the EUR/USD down to approximately 1.1484.
EU developments: ECB officials, including Christine Lagarde, are doubling down on strengthening Europe’s financial infrastructure to elevate the euro as a viable alternative to the dollar — calling this a “global euro moment.”
Key resistance is around 1.1550–1.1575; downside support zones near 1.1450 and broader range 1.1360–1.1420 remain intact, though current levels suggest consolidation above the lower range. Strength from safe-haven flows could stall upward momentum.
📊 ECB Policy & Inflation Signals
The ECB cut rates by 25 bp last week to 2.0%, reinforcing the message that inflation remains subdued (1.9% in May) and prompting a data-driven, meeting-by-meeting decision approach.
ECB speakers stress “agile pragmatism” given global uncertainties, citing the euro’s ~10% rally year-to-date but cautioning amid rising oil prices and geopolitical risks.
⚡ What to Watch Next
Catalyst Outlook
U.S. yields & bond auctions More issuance tied to tax plans could steepen the curve and support the USD.
Middle East headlines Escalation may continue to offer dollar safe-haven benefits, pressuring EUR/USD.
EU economic data Inflation softness (e.g., France) could weaken ECB’s stance, re-pressuring the euro.
Technical levels Watch 1.1450 support—holds for possible rebound; resistance 1.1550–1.1575 for upside pressure.
✅ Summary
Current: EUR/USD around 1.1484, with bearish tilt amid risk aversion.
Bull case: Ongoing U.S. fiscal weakness, delayed tariffs, and ECB support for euro could cap downside.
Bear case: Safe-haven demand from geopolitical tensions, Fed‑ECB divergence, and technical breakdown through 1.1450 could push toward 1.1360.

XAUUSD – Gold breaks trend: Is a deeper fall coming?Gold has officially broken the ascending trendline that had held since mid-May, confirming a breakdown in the bullish structure. After failing to breach the strong resistance at 3,445 USD, selling pressure intensified, driving the price down to 3,390 USD — yesterday’s closing level.
This move came right after the FOMC meeting, where the Fed held interest rates steady but maintained a hawkish tone, strengthening the USD and weighing heavily on gold.
While tensions in the Middle East continue to offer short-term support, U.S. monetary policy remains the dominant force. Without a fresh geopolitical shock, gold appears increasingly vulnerable to a deeper correction.

showing a descending wedge (falling wedge) pattern formingThis is a 30-minute (M30) chart of XAUUSD (Gold vs. US Dollar), showing a descending wedge (falling wedge) pattern forming, which is a classic bullish reversal setup.
Chart Description:
Pattern Formed:
Descending wedge is clearly drawn with:
Lower highs and lower lows, converging between two trendlines.
Price action is respecting both boundaries of the wedge.
Current price is mid-range inside the wedge.
Projected Price Path (Dotted Arrows):
The chart suggests:
A possible fakeout or final dip towards the wedge's lower boundary.
Followed by a rejection and bullish breakout.
Target would likely be above 3,392+, possibly aiming toward the wedge's origin zone (~3,408 or higher).
Market Implication:
This setup is typically bullish, especially if:
Volume increases near the lower edge.
Price fails to make a new low and starts printing bullish structure (HL → HH).
Summary:
XAUUSD is consolidating inside a falling wedge on the 30m chart, suggesting potential for a bullish breakout. Traders may anticipate one last liquidity sweep before a breakout toward higher resistance levels.

Gold Price Update – XAUUSDGold FX:XAUUSD has experienced rapid and intense volatility but overall remains stable, as investors weigh the escalating conflict between Israel and Iran while focusing on this week’s U.S. Federal Reserve policy meeting.
At the time of reporting, spot gold CAPITALCOM:GOLD remains steady at $3,380/oz, down from yesterday’s (Tuesday) high of $3,403/oz.
Israel and Iran continued exchanging fire into a fifth day on Tuesday, as U.S. President Donald Trump called for the evacuation of Iran’s capital, Tehran, and cut short his trip to the G7 summit in Canada. Reports claim he had instructed the National Security Council to prepare in the Situation Room.
According to Reuters, Tehran has requested Oman, Qatar, and Saudi Arabia to urge Trump to push Israel toward a ceasefire in exchange for Iran’s willingness to show flexibility in nuclear negotiations.
Trump’s latest post on Truth Social stated:
"I have had ZERO communication with Iran in any way, shape, or form regarding (peace talks). It’s fake news! If they want to negotiate, they know how to contact me. They should take the deal on the table—it will save many lives!!!"
Forexlive commented that anyone familiar with Trump knows he will definitely wait for Iran to approach him. Reports suggest Iran is attempting to negotiate a ceasefire, but no substantive developments have emerged yet.
Gold, a non-yielding asset, is widely seen as a hedge against geopolitical and economic uncertainty, and it tends to perform well in low interest rate environments. Therefore, fundamentally, gold should maintain a positive outlook in the current market context—even though sudden pullbacks can unsettle new traders. Personally, I’ve had many moments this year when I doubted myself and didn’t trust the uptrend—only to suffer bad outcomes… sigh.
The Fed’s interest rate decision and Chair Jerome Powell’s speech are scheduled for today (Wednesday). Traders currently expect the Fed to cut rates twice by year-end.
According to CME’s “Federal Reserve Watch” on June 18:
There is a 97.3% chance the Fed will keep rates unchanged in June, and a 2.7% chance of a 25bps rate cut.
In July, there is an 85.3% chance of holding rates steady, a 14.4% chance of a cumulative 25bps cut, and a 0.3% chance of a 50bps cut.
Technical Outlook for Gold (XAUUSD)
On the daily chart, gold has been oscillating around the 0.236 Fibonacci retracement level and the psychological price of $3,400—previously highlighted as key support/resistance in our earlier analysis.
However, the overall technical structure remains unchanged, with the dominant trend still bullish. The 21-day EMA continues to act as a crucial support line, and trendline (a) remains the primary trend direction. Meanwhile, the 0.236 Fibonacci retracement serves as the nearest support, with price channel (b) defining the short-term trend.
In terms of momentum, the RSI (Relative Strength Index) remains above 50, which is also acting as a support level in this case. The distance from the overbought zone suggests further upside potential remains.
Intraday, a breakout above the psychological $3,400 level would provide a bullish signal, with the next target seen around $3,435 in the short term.
Key Levels to Watch:
Support: $3,371 – $3,350
Resistance: $3,400 – $3,435

XAUUSD:A long trading strategy
Yesterday was affected by the easing signal gold high continued to correction, fell back to 3400 again, the trend exceeded personal expectations. Gold received another boost after the president's news, and rebounded slightly in the Asian session. In this eventful autumn, the market is subject to frequent news factors, the trend is slightly turbulent, to be ready to sweep back and forward.
Today's overall volatility is expected to have a contraction, individual expectations of the final close of the small negative line is more likely
Trading Strategy:
BUY@3380-85
TP:3404-3410
↓↓↓ More detailed strategies and trading will be notified here ↗↗↗
↓↓↓ Keep updated, come to "get" ↗↗↗

GOLD H1 Intraday Chart Update for 18 June 25Hello Traders, Welcome to the FOMC Day
as you can see that market is in tight range for now which is 3370-3400, we are still waiting for long above 3400 Psychological Level once market will clearly breaks 3400 level we consider long opportunities
if market breaks 3350 Psychological digit successfully then it will move towards 3325 first then focus will 3300 Major Support Level
All eyes on FOMC for the day
Disclaimer: Forex is Risky

xauusd daily level📌 Title:
GOLD | Supply & Demand Zones + Structure Break Analysis
📝 Description:
This chart showcases a price action-based analysis of XAUUSD (Gold) on the 15-minute timeframe.
Key highlights:
Clear Supply & Demand Zones are marked using recent price reactions and consolidation areas.
Price Structure Breaks confirm bearish control as multiple lower highs and lower lows are forming.
The price is currently reacting between two demand zones; potential for bounce or breakdown.
A strong supply area is observed around 3398–3405, which caused sharp rejections.
Watch how price behaves around 3370 zone, a key demand area which has held previously.
🔔 Trading Plan:
If price retests the upper supply zone and shows weakness (e.g., wick rejections, bearish engulfing), it may offer a short opportunity.
If price breaks below the current demand zone at 3370 with volume, expect further downside.
Bullish bias only above 3405 zone with strong candle close.
📈 Tools used:
Manual Supply & Demand Marking
Pure Price Action
Structure Break Confirmation

Gold Steady Near $3,390 Ahead of Fed DecisionGold rebounded from early losses on Wednesday, returning to around $3,390 as the Iran-Israel conflict entered its sixth day. Israel confirmed strikes near Tehran and reported missile launches from Iran, while President Trump’s national security meeting fueled speculation about potential U.S. involvement. Investors also focused on the Federal Reserve meeting, with no rate change expected but attention on guidance amid trade tensions and global uncertainty.
Resistance is seen at $3,430, while support holds at $3,350.
