GOLD - WAVE 5 BULLISH TO $3,622 (UPDATE)Gold is currently going through a strong 'accumulation' phase for buyers, hence why we're seeing these choppy price actions, trying to liquidate buyers. It won't surprise me if we see dips lower, but overall we remain bullish as long as Gold is ABOVE THE WAVE 2 LOW. Breaking below this low, will invalidate bullish structure.
Wave 2 Invalidation Level - $3,245❌
Xauusd(w)

GOLD MARKET ANALYSIS AND COMMENTARY - [Jun 16 - Jun 20]The unrest in the Middle East this week has boosted safe-haven demand for gold, pushing it above $3,400 an ounce.
While gold has broken several recent technical resistance levels, it is unlikely that it will hit a new record high next week. The ongoing conflict between Israel and Iran provides safe-haven support, but historically, gold rallies driven by geopolitical events tend to be short-lived.
Gold is currently outperforming the US dollar, which has struggled to attract safe-haven funds.
Iran launched a retaliatory airstrike on Israel on Friday night (June 13), Reuters reported. Air raid sirens sounded across Israel and authorities urged residents to take shelter in shelters.
The Israeli military said Iran fired nearly 100 missiles, most of which were intercepted or missed their targets.
Israel's Channel 12 reported two people were seriously injured, eight were moderately injured and 34 suffered shrapnel injuries.
Iran's Islamic Revolutionary Guard Corps said it had carried out military operations against dozens of targets in Israel.
The Iranian Revolutionary Guards' news website released a message that evening saying the "powerful and precise" counterattack was in retaliation for Israel's "invasion" of many parts of Iran and the killing of many senior military commanders, nuclear experts and Iranian civilians, including children.
Wider Middle East Conflict Could Erupt
Israel destroyed Tehran's military command system early Friday and struck key Iranian nuclear facilities. The Fars news agency, which is affiliated with Iran's Revolutionary Guards, cited data saying the Israeli attack killed dozens of people in Iran and wounded more than 300.
Israel has carried out large-scale airstrikes on multiple locations in Iran since early Friday, bombing Iranian nuclear facilities and military targets.
Reuters said Israel's attacks on Iran during the day and Iran's retaliation have raised concerns about a broader conflict in the region.
All Eyes on the Fed
While gold will continue to be affected by geopolitical developments, market attention will also be on the Federal Reserve, particularly Chairman Powell, who will speak after next week’s monetary policy meeting.
Economists generally expect the Fed to keep rates unchanged. However, expectations are growing that Powell could begin paving the way for a rate cut later this year.
The latest inflation data and signs of a slowing US economy have given the Federal Reserve room to cut rates. However, growing geopolitical uncertainty may prompt some market participants to adjust their expectations.
Overall assessment of the basic environment
The gold market in particular will still receive absolute support when there are too many risks appearing, from geopolitical developments to interest rate prospects, and tariffs. Major conflicts in the Middle East, Russia - Ukraine, trade war between the US and the rest of the world, ... are all sudden risk support that makes gold likely to surge in the short term. Therefore, in general vision, gold is considered the top safe-haven asset in the global unstable environment and it tends to increase in price in the current context.
Economic Data to Watch Next Week
Monday: State Manufacturing Survey, Bank of Japan Monetary Policy Meeting
Tuesday: US Retail Sales
Wednesday: US Weekly Jobless Claims, US Housing Starts, Federal Reserve Monetary Policy Meeting
Thursday: US Markets Closed for Black Lives Matter Day, Swiss National Bank Monetary Policy Meeting, Bank of England Monetary Policy Meeting
Friday: Philadelphia Fed Manufacturing Survey
Technical Outlook Analysis OANDA:XAUUSD
On the daily chart, gold has almost achieved all the bullish targets noted by readers in last week's weekly issue, initially at $3,371, then at the full price point and finally at $3,435. Gold can still continue to increase in price as technical conditions still absolutely support the short-term trend channel, while the long-term trend channel and the nearest support is the EMA21.
In terms of momentum, the Relative Strength Index (RSI) is sloping up after receiving support from 50 and is still far from overbought territory, indicating that there is still a lot of room for upside ahead.
To sum up, as long as gold remains within/above the price channel, it remains bullish in the short term. Any dips that do not break below the price channel should only be considered as short-term corrections or a new buying opportunity.
Finally, the notable positions will be listed as follows.
Support: 3,400 – 3,371 USD
Resistance: 3,435 – 3,500 USD
SELL XAUUSD PRICE 3497 - 3495⚡️
↠↠ Stop Loss 3501
BUY XAUUSD PRICE 3374 - 3376⚡️
↠↠ Stop Loss 3370

Gold is in a medium-term consolidation,The momentum of gold is weak. In the early trading, there was only a wave of upward momentum, while in the evening, it quickly fell below the 3,400 key level. As previously mentioned, if gold holds above the key level of 3,400, the bullish trend will continue. However, after breaking below 3,400, a small - level top has been formed in the short term, and the market is no longer so strong.
For our short - term operations, in the short - term correction, the gold price should focus on the support of the MA5 in the daily cycle and the MA5 in the weekly cycle for long positions. On the pullback, pay attention to the resistance level of 3,403 - 3,408 for short positions. A rebound can be followed by shorting, but it should be noted that it can only be a short - term operation!
Although gold has broken below 3,400 and the short - term direction has changed, the long - term direction has not changed. It is still in a bullish trend, and we still have the opportunity to see the high of 3,500 in the future. However, we need to wait until the bottom stabilizes. At present, we can only follow the trend and do what the market does. Short on the rebound in the next two days!
you are currently struggling with losses,or are unsure which of the numerous trading strategies to follow,You have the option to join our VIP program. I will assist you and provide you with accurate trading signals, enabling you to navigate the financial markets with greater confidence and potentially achieve optimal trading results.
Trading Strategy:
sell@3410-3420
TP:3380-3390

GOLD Massive Long! BUY!
My dear friends,
GOLD looks like it will make a good move, and here are the details:
The market is trading on 3389.4 pivot level.
Bias - Bullish
Technical Indicators: Supper Trend generates a clear long signal while Pivot Point HL is currently determining the overall Bullish trend of the market.
Goal -3396.3
Recommended Stop Loss - 3385.8
About Used Indicators:
Pivot points are a great way to identify areas of support and resistance, but they work best when combined with other kinds of technical analysis
Disclosure: I am part of Trade Nation's Influencer program and receive a monthly fee for using their TradingView charts in my analysis.
———————————
WISH YOU ALL LUCK

XAUUSD: Accumulation in process,Waiting for Bullish DistributionHello,
Today, we will analyse the key points of each significant move.
Following the price’s all-time high at $3500, it experienced a sharp decline and failed to maintain that level. A substantial 2400 pips would have resulted in significant losses for many accounts. Initially, it was perceived as a minor correction, with the expectation of further price appreciation. However, this assumption proved incorrect. After reaching an even higher peak, the price invariably undergoes a more substantial correction.
At 3260, substantial bullish volume surged into the market, necessitated by the presence of a fair value gap. Subsequently, the price experienced a decline, reflecting the prevailing bearish trend, which favoured the bears. However, at 3200, a pivotal level representing a discounted price point, bull volume surged. This powerful bullish impulse propelled the price to 3432, ultimately confirming the bullish trend. AB=CD there recurring pattern emerged weekly. When the price reached the 3432 level as a fair value gap, the CD pattern commenced.
AB=CDTheHeyIndeed, we have identified a recurring pattern. It appears to be an equal move in any direction, and it has manifested precisely as anticipated. We were aware that the price would reject at 3120, and it did so accordingly. Currently, the market is in our favour. Upon market opening, it exhibited a positive gap, propelling the price to 3450. However, it subsequently declined, reaching 3384.
Presently, we find ourselves in the accumulation phase, poised for distribution. This distribution is anticipated to be substantial, potentially leading to another record high, potentially reaching 3650.
Moving forward, the price could continue towards our target from its current position. Alternatively, there exists a possibility that it may drain the sell-side liquidity and reverse from 3360-3370.
Our take-profit levels are set at 3450, 3490, 3520, and finally, 3600. When entering the market, it is advisable to employ a short time frame. It is important to note that this analysis is merely our opinion, and market conditions may deviate from expectations.
We extend our best wishes for success and safe trading. If you wish to demonstrate your support, you may consider liking, commenting, or sharing this analysis with others.
Sincerely,
Team Setupsfx_

GOLD - Price will bounce from support area and start to growHi guys, this is my overview for XAUUSD, feel free to check it and write your feedback in comments👊
Some days ago price declined to $3220 level and then started to grow, and soon reached $3380 level and even broke it.
Then price started to trades inside wedge, where it at once started to decline and in a short time declined to support line of wedge.
After this, Gold rose and broke $3220 level and continued to move up in wedge, where it also made two gaps before.
Price rose to $3380 level and some time traded very close to this level, but later corrected to support line.
Next, price made a strong impulse, breaking $3380 level and exiting from wedge as well, and continued to grow.
Recently, Gold started to fall, so I think that it will fall to support area and then bounce up to $3500
If this post is useful to you, you can support me with like/boost and advice in comments❤️
Disclaimer: As part of ThinkMarkets’ Influencer Program, I am sponsored to share and publish their charts in my analysis.

Is gold (XAUUSD) building up for a possible push higher?With the economic data sets, which we are getting and will be getting this week, all eyes on gold, and its possible move to the all-time high. Apart from this, the geopolitical tensions are also something that is fueling gold demand. But what are the technical saying? Let's take a look.
TVC:GOLD
FX_IDC:XAUUSD
Let us know what you think in the comments below.
Thank you.
77.3% of retail investor accounts lose money when trading CFDs with this provider. You should consider whether you understand how CFDs work and whether you can afford to take the high risk of losing your money. Past performance is not necessarily indicative of future results. The value of investments may fall as well as rise and the investor may not get back the amount initially invested. This content is not intended for nor applicable to residents of the UK. Cryptocurrency CFDs and spread bets are restricted in the UK for all retail clients.

HelenP. I Gold may correct to support zone and then rebound upHi folks today I'm prepared for you Gold analytics. After rebounding from the trend line, XAUUSD began to grow steadily within the rising structure, confidently pushing through local resistance and breaking above the previous support 2 area. This breakout was backed by strong bullish momentum, with the price clearly holding above the broken level, turning it into a support base. Following that surge, the price entered a short-term consolidation, trading within the upper boundary of the chart, just above the 3400 level. This area now acts as a crucial support zone, and the market is currently hovering slightly above it after a local peak. Given the strength of the recent impulse and the confirmation of previous resistance as support, I expect a brief correction to the support zone before a continuation of the bullish move. That’s why I set my current goal at 3470 points — the next potential resistance area where the price may encounter renewed selling pressure after the rally continues. If you like my analytics you may support me with your like/comment ❤️
Disclaimer: As part of ThinkMarkets’ Influencer Program, I am sponsored to share and publish their charts in my analysis.

Gold holds above key zoneAfter breaking the major resistance at 3,392 USD — a level that had been rejected multiple times in the past — XAUUSD is undergoing a slight pullback to retest the newly established support. The bullish reaction in this area suggests that buyers are still in control of the trend.
In the current context, U.S. retail sales have fallen more than expected, reinforcing expectations that the Fed may cut interest rates soon. This puts pressure on the dollar and benefits gold.
The primary scenario is a bounce from the current support toward the next resistance area near 3,481 USD. The 3,392 USD level has now become a key support to sustain the ongoing bullish structure.

Gold Soars – Heading Towards 3,500 USD/ounce?Gold prices closed yesterday at 3,457.7 USD/ounce, up 0.12% from the previous day, fluctuating between 3,453.7 USD and 3,458.1 USD/ounce, marking the highest level in the past two months.
XAU/USD is currently maintaining an uptrend within a well-defined price channel, with strong support at the 3,390–3,400 range. After a short correction, the price could continue to rise if it holds above the EMA34, with the next target towards the 3,445–3,460 range and further up to 3,500 USD/ounce.
This upward momentum is supported by geopolitical tensions in the Middle East, particularly between Israel and Iran, driving demand for gold as a safe-haven asset. U.S. CPI data lower than expected has also increased expectations of a Fed rate cut, alongside central banks increasing gold reserves, all contributing to the continued rise in gold prices.

Buy GoldPrice is at a major Daily resistance,but becuz of the war between Israel and Iran, price may spike below to take out traders, then continue pushing upwards. However , all this is possible if this region hold support, if it does, I'd look to see a pattern been formed on the 1hr tf that indicates bullish momentum, if this doesn't happen, then there's a previous weekly resistant that price may fall in order to tap. But the most important thing is having a good psychology, that's what makes you a good trader, we can say so much about the market direction,but it should be noted that, things do change, anything can happen, so while waiting for the right setup or while anticipation for buys, only those with a strong and disciplined mindset will survive the chaos... Happy Trading 💹

SPY/QQQ Plan Your Trade for 6-17: Top Resistance PatternToday's pattern suggests the SPY/QQQ will move into a type of topping pattern, attempting to identify resistance, then roll away from that resistance level and trend downward.
I suggest the news related to the conflict between Israel & Iran may continue to drive market trends with traders moving away from uncertainty near these recent highs.
Silver makes a big move higher. Gold will likely follow later this week or early next week.
BTCUSD moves into a sideways FLAGGING pattern - possibly attempting a BIG BREAKDOWN event over the next few weeks.
Overall, the markets look like they are poised for a very big move - just waiting for the GREEN LINK (GO).
Stay safe. Protect capital and HEDGE.
Get some.
#trading #research #investing #tradingalgos #tradingsignals #cycles #fibonacci #elliotwave #modelingsystems #stocks #bitcoin #btcusd #cryptos #spy #gold #nq #investing #trading #spytrading #spymarket #tradingmarket #stockmarket #silver

Gold Faces Resistance as Israel-Iran Conflict Fails to Fuel RallGold Unlikely to Sustain Long-Term Gains on Israel-Iran Tensions
Despite escalating geopolitical risks, gold’s upside remains limited. Julius Baer's Carsten Menke notes that the recent move is likely driven by short-term speculative and algorithmic flows, not physical safe-haven demand—consistent with historical patterns of brief geopolitical spikes.
Technical Outlook:
Gold is currently trading below 3404, suggesting possible range-bound consolidation between 3404 and 3480.
A 1H close below 3380 could trigger further downside toward 3365 and 3347.
Conversely, a break above 3404 would open the way for a bullish push toward 3448.
Key Levels:
• Pivot: 3381
• Support: / 3365 / 3347 / 3321
• Resistance: 3404/ 3420 / 3448

Forward-looking trading, focus on 3380 support📰 Impact of news:
1. Geopolitical tensions in the Middle East
2. Iran nuclear talks
3. Retail sales data
📈 Market analysis:
Gold prices are currently in a narrow range of fluctuations again, and the signal of Iran restarting nuclear negotiations has weakened risk aversion, triggering a correction in gold prices during the session, but tensions in the Middle East remain an uncertain factor. In the short term, we still need to focus on the breakthrough of the 3380 support line. If the 3380 support line is strong, we can still maintain a long trading idea in the short term and look to 3400. On the contrary, once it falls below, it is expected to look to the 3350 line. Pay attention to the breakthrough of 3400 on the upside. If the Asian and European sessions cannot effectively break through this short-term resistance, gold will continue to fluctuate.
🏅 Trading strategies:
BUY 3380-3370
TP 3390-3400-3450
SELL 3400-3390
TP 3380-3370-3350
If you agree with this view, or have a better idea, please leave a message in the comment area. I look forward to hearing different voices.
OANDA:XAUUSD FX:XAUUSD FOREXCOM:XAUUSD FXOPEN:XAUUSD TVC:GOLD

DeGRAM | GOLD kept the rising channel📊 Technical Analysis
● Price rejected the channel roof near 3 435 again, carving a small evening-star and slipping back under the May trend-median 3 370 — a repeat of April/May fades.
● Bearish RSI divergence plus a break of the micro up-sloper (last three sessions) tips for a rotation toward the lower rail/3 295 support; loss of that opens the April pivot at 3 225.
💡 Fundamental Analysis
● Sticky US retail-sales and hawkish Fed comments keep 2-yr yields near 4.8 %, firming the DXY, while CFTC data show specs cutting longs for a second week — limiting bid depth.
✨ Summary
Sell rallies 3 410-3 430; sustained trade below 3 366 targets 3 295, stretch 3 225. Short view void on an H4 close above 3 450.
-------------------
Share your opinion in the comments and support the idea with a like. Thanks for your support!

XAUUSD - Overtrading and Revenge Trading - Trading PsychologyFrom Chaos to Control: Mastering the Art of Balanced Trading on Gold
Trading gold is exhilarating. It’s fast, volatile, emotional — and addictive.
But what most traders don’t realize is this: it’s not the market killing your account.
It’s you, pressing buy and sell like it’s a video game.
Over-trading is the silent account killer. It doesn’t scream. It whispers:
“Just one more entry.”
“Maybe this one will finally run.”
“Let me scalp this quick pullback…”
Before you know it, you’ve taken 12 trades by noon and your brain’s fried.
🧠1. Why Over-Trading Happens: The Dopamine Delusion
Over-trading isn’t just a strategy flaw. It’s chemical. Your brain rewards anticipation of profit — not just actual wins.
So every setup, every near-miss, every “maybe I missed the move” spikes your dopamine.
That’s why you keep clicking. Not because you saw a valid setup.
Because your brain craves the rush of imagining one.
This is why traders enter in zones they never marked, skip confirmation, and rush into impulsive entries.
The market didn’t give a signal. Your nervous system did.
📉2. The Real Damage: Not Just Losing Trades — Losing Discipline
Over-trading ruins more than your account. It ruins your edge.
• You stop following your plan
• You chase liquidity like a gambler
• You get shaken out of clean zones
• You increase risk, just to “make it back faster”
And worst of all? It feels productive.
But profits don’t come from activity. They come from precision.
If you don’t reflect about your actions, you repeat the bad ones.
💸3. The Financial Fallout: Over-Trading Blows Up Accounts
Over-trading nukes your capital.
• One extra trade becomes five
• SL gets wider or invisible because your entry was rushed
• Lot size gets heavier to “speed up” recovery
• Now you’re emotional, and revenge mode kicks in...
You’re not compounding anymore.
You’re compounding mistakes.
This is how smart traders blow up challenge accounts.
This is how funded accounts get revoked.
This is how small accounts die before they grow.
Over-trading is a trap with a $0 exit.
✅4. Tactical Fixes: Trade Smart, Live Smarter
✔️ Set a daily trade cap.
Limit yourself to 2–3 trades. If you keep entering, it’s not analysis — it’s compulsion.
✔️ Split your daily risk.
Risking 0.3% total? That doesn’t mean 0.3% per trade. Break it down, or you’ll break your account.
✔️ Set alerts — not alarms in your brain.
Stop watching every candle like it’s a soap opera.
Set TradingView alerts at your key zones and walk away.
The market doesn’t move faster just because you're glued to the screen.
✔️ Take real breaks — not just chart scrolling.
Go outside. Call someone or send time with family and friends. Eat good food.
Most traders come home from work and go right back into charts like it’s their second shift.
That’s not discipline. That’s burnout.
✔️ Build a life that doesn't revolve around entries.
The more you lose, the more you trade. The more you trade, the more you spiral.
It’s just like alcohol, drugs, gambling. Dopamine up. Reality down.
And the worst part? It looks like hard work from the outside — but it feels like slow death inside.
🧨5. From Over-Trading to Revenge Mode
If over-trading is the first crack in your foundation, revenge trading is the wrecking ball.
And it never starts from logic. It starts from pain.
You had a clean setup.
You got stopped out — maybe twice.
Now you're frustrated, humiliated… embarrassed.
You’re no longer reacting to price.
You’re reacting to loss.
Revenge trading doesn’t feel chaotic in the moment.
It feels righteous.
You convince yourself, “I just need one win to get it all back.”
😵💫6. The Emotional Spiral Traders Don’t Talk About
Over-trading and revenge trading are addictive.
You’re showing up to work. You’re posting charts. You’re pretending it’s fine.
But deep down?
You're wrecked. Emotionally, financially, and mentally.
This is the side of trading no one glamorizes.
The isolation. The loneliness. The pressure. The self-blame.
This is how people burn out — not from one bad week.
But from trying to trade their way out of pain.
⚠️ Final Word
Over-trading is not a badge of hustle.
It’s the first step toward emotional dependence on the market.
And that’s the most expensive habit you’ll ever form.
If you don’t catch it early, you’ll keep blaming the market, the spread, the broker…
when the real damage was done by your own reaction.
The market doesn’t owe you anything.
So be kind to yourself and build discipline, you will win in the long run.
If this lesson helped you today and brought you more clarity:
Drop a 🚀 and follow us✅ for more published ideas.

Gold Spot / U.S. Dollar (XAU/USD) 4-Hour Chart4-hour candlestick chart displays the price movement of Gold Spot (XAU) against the U.S. Dollar (USD) from late June to mid-July 2025. The current price is $3,385.30, with a slight increase of $0.66 (+0.02%). The chart highlights a recent upward trend, with a resistance level around $3,420.58 and a support level near $3,370.10, as indicated by the shaded zones.

XAU/USD Bullish Setup Confirmed After Wave C CompletionXAU/USD has completed a classic five-wave impulsive structure to the upside, followed by a clear ABC corrective phase. The price action shows that wave (5) has topped, and the market has since retraced through a three-wave ABC correction inside a well-defined descending channel.
Currently, wave C appears to have found support right at the lower trendline of the broader ascending structure, signaling a potential completion of the correction and the beginning of a new bullish impulse.
The reaction from this level is strong, suggesting that buyers are stepping in to drive the next leg higher
Wave Count: 5-wave impulse up, followed by ABC correction
Structure: Wave C completed at key channel support
Momentum: Bullish recovery expected if price holds above recent swing low
T1: 3332.268
T2: 3354.078
SL: 3289.400

XAUUSD Analysis todayHello traders, this is a complete multiple timeframe analysis of this pair. We see could find significant trading opportunities as per analysis upon price action confirmation we may take this trade. Smash the like button if you find value in this analysis and drop a comment if you have any questions or let me know which pair to cover in my next analysis.

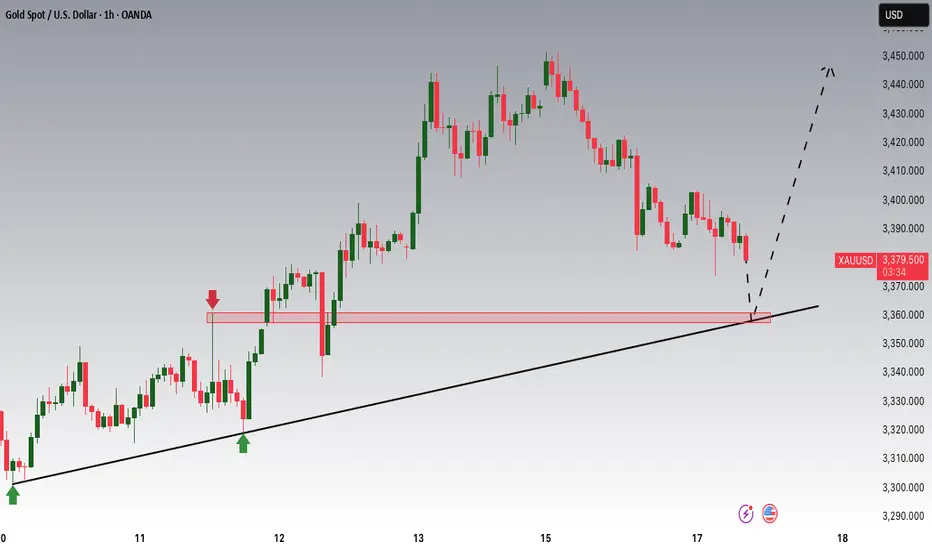
Gold is Nearing an Important Support!!Hey Traders, in today's trading session we are monitoring XAUUSD for a buying opportunity around 3,360 zone, Gold is trading in an uptrend and currently is in a correction phase in which it is approaching the trend at 3,360 support and resistance area.
Trade safe, Joe.
GBPUSD H1 compression BUY/HOLD TP1 +100 TP2 +200 pips low risk🏆 GBPUSD Market Update
📊 Technical Outlook
Short-term: BULLS active; resistance forming mid‑1.3600s, consolidation below 1.3600s
Mid-term: Neutral to slight bullish bias; bulls seek 1.3600–1.3700/1.3730 zone
Status: Narrow trading range (tight band) ahead of key UK CPI, Fed & BoE meetings
🔥 Latest Forex Updates
GBP/USD is consolidating in a narrow range around the mid‑1.3500s ahead of this week’s UK CPI and central bank meetings.
The pair holds defensive below 1.3600, with dovish BoE bets capping gains while the Fed is expected to stand pat.
GBP/USD sits near a 40‑month high (~1.3600), boosted by geopolitical risk tone, but lacking momentum to break much higher.
GBP/USD hit ~1.3600 after rebounding from 1.3515 amid renewed Middle East tensions and a weaker US dollar.
Live charts show a mild bullish tilt, awaiting central bank outcomes.
💡 Trade Recommendation
Buy GBPUSD at 1.3530 (recommended entry near 1.3530)
Take Profit at 1.3730 → +200 pips profit target
Stop Loss: 50 pips (around 1.3480)
This trade aligns with the current structure: shallow dip followed by rebound, positioning ahead of central bank catalysts. Momentum above resistance could propel GBP/USD toward 1.3730.
📌 Market Overview
Metric Details
Current Price ~1.3565–1.3600
24H Range 1.3515–1.3600
Central Event Risks UK CPI (Wed), US Retail Sales & Fed (Wed), BoE (Thu)
Geopolitical Middle East tension supports USD weakness, aiding GBP
📈 Forecast Highlights
Support Levels: ~1.3530 (100‑period SMA), ~1.3460, ~1.3425
Resistance Levels: 1.3600, 1.3630 static ceiling, followed by ~1.3700–1.3730 for bulls
🧭 Final Take
GBP/USD sits in a tight range, awaiting central bank clarity. The recommended long trade at 1.3530 aims to capitalize on upside momentum toward 1.3730, supported by technical confluence and a softer USD. Manage risk with a 50‑pip stop loss.

Gold XAUUSD Move 16 June 2025Market Structure:
The market isin a clear uptrend, forming higher highs and higher lows until a recent break of the ascending trendline, signaling a short-term structural weakness.
Current price is in a retracement phase, heading towards previous demand zones.
🔹 Zone 1 (3408–3414):
Confluence of:
Broken trendline retest (former support).
Minor order block / demand zone.
Overlapping price reaction area.
Risk: This zone may act as a liquidity inducement before price sweeps deeper into Zone 2.
Entry trigger: Bullish engulfing or LTF market structure shift on 1m/5m.
🔹 Zone 2 (3380–3384):
Stronger demand zone:
Aligned with previous accumulation base.
Larger imbalance (FVG-type area) and bullish impulsive origin.
More convincing for high-RR entries.
Higher probability: If Zone 1 fails or only wicks price, Zone 2 may provide the main entry opportunity.
Entry trigger: Shift in LTF structure with volume spike or breaker flip.
✅ Trade Signal Suggestions
🟦 Setup 1: Buy from Zone 1
Entry: 3410 (upon bullish confirmation)
SL: 3400 (below structure low)
TP: 3434 (prior high)
RR: ~2.4R
Note: Only take if price forms bullish structure (MSS or BOS) on lower timeframe.
🟦 Setup 2: Buy from Zone 2
Entry: 3380/3384 (upon confirmation)
SL: 3372 (below demand zone)
TP: 3411 or 3434 (scalp to intraday swing)
RR: ~1:3 or better
Note: Wait for clean rejection or reversal candle from this zone.
⚠️ Risk Management
Risk 0.5–1% per trade.
Use entry confirmation such as:
Bullish engulfing
Fair value gap reaction
Break of internal structure

XAUUAD Today update 17 - 6 -2025This chart shows a 30-minute timeframe for Gold (TVC:GOLD) with a clear short-term price action analysis. Here's a breakdown:
---
🔍 Key Levels & Zones Identified:
1. Resistance Area:
Around 3,384.174 — marked with a black dashed zone at the top.
Price previously rejected here.
2. Current Price:
3,386.600 (as of 10:56 UTC on June 17, 2025), slightly above the resistance — indicating a potential fakeout or bullish breakout attempt.
3. Support Zone:
Around 3,338.913, highlighted in blue.
The chart notes: "If it comes down below that, it will come down."
Suggests a bearish continuation if price breaks this level.
4. Target Support:
Near 3,325–3,300, green thick band at the bottom.
This is the zone marked "then it will touch", likely the next bearish target.
---
🔁 Pattern Insight:
A triangle or consolidation is forming, shown by blue trend lines — potential breakout or breakdown zone.
If price fails to hold above 3,384.174, it could retest 3,338.913.
A confirmed break below that support opens a move to 3,325 or lower.
---
🧭 Summary:
Bullish Scenario: Hold above 3,384 and break out to retest highs above 3,425.
Bearish Scenario: Drop below 3,338 → target 3,325–3,300 zone.
Let me know if you'd like a trading strategy or confirmation indicators added to this analysis.
