GOLD Intraday Chart for 17 June 25Hello Traders,
as you can see that market was going down very badly and it's actually stuck below 3400 Psychological Level
Definitely we are sellers now as long as market sustain below 3400 Psychological Level
below 3380 level GOLD will move towards 3360 or even 3350
Disclaimer: Forex is Risky
Xauusd(w)

XAUUSD: June 17 Market Analysis and StrategyGold technical analysis
Daily chart resistance 3450, support below 3355
4-hour chart resistance 3420, support below 3372
1-hour chart resistance 3403, support below 3375
The recent rise and fall of gold is completely controlled by market news. The next move of Israel and Iran directly affects the rise and fall of gold. It rises under the stimulation of the escalation of the situation and begins to pull back when the situation eases. The long and short positions form a short-term tug-of-war pattern, but the fundamentals have not changed. Gold is still in a bull market.
Today's rebound high is in the 3405/03 area. This position has formed a top and bottom conversion position. It is bound to have a certain suppressive effect on the rebound of gold prices. You can refer to the 3403/05 area for shorting during the day. Pay attention to the vicinity of 3370 below. If you hold this support level, you can buy short-term. The intraday volatility is not expected to be large, which is suitable for fast-in and fast-out transactions!
SELL: 3402near SL: 3407
BUY: 3370near SL: 3365

Gold above the resistanceGold on weekly broke above the resistance at 3360 after 9 weeks, now its time to rally again.

Gold’s Game of Traps: Is the Dip a Setup for a Bigger Move? Gold’s Game of Traps: Is the Dip a Setup for a Bigger Move?
After an aggressive rally fueled by geopolitical FOMO headlines, gold (XAUUSD) saw a sudden pullback — but what looked like weakness might actually be a setup for smart accumulation. The market narrative is shifting, and price action is sending important signals...
🌍 Global Drivers Behind the Volatility
Middle East conflict between Israel and Iran continues to escalate, prompting global safe haven flows. Evacuation warnings and nuclear deal pressure add more uncertainty to the mix.
Despite bullish news, gold failed to hold its highs — a potential bull trap as institutional players took advantage of retail FOMO to offload.
Big capital may now be rotating from gold into other sectors like energy (oil) and discounted equity assets.
📉 Price Action & Technical Outlook (M30–H1)
After topping around 3442–3440, price snapped back into the mid-range — a sign of liquidity hunting rather than a full reversal.
The EMAs (13/34/89/200) on the M15–M30 timeframes are showing early signs of bearish crossover, hinting at further short-term weakness.
Below current price sits a clean Fair Value Gap (FVG) that could act as a magnet — aligning with a high-probability buy zone.
🎯 Trading Playbook
✅ BUY Setup – "Smart Money Entry Zone"
Buy Zone: 3342 – 3344
Stop Loss: 3338
Take Profit Targets:
→ 3348 → 3352 → 3356 → 3360
→ 3364 → 3368 → 3372 → 3380+
💡 Look for price to tap into the FVG and form a base with bullish confirmation (engulfing candle, divergence, or rising volume) before entering.
❌ SELL Setup – "Fade the Overhead Resistance"
Sell Zone: 3440 – 3442
Stop Loss: 3446
Take Profit Targets:
→ 3436 → 3432 → 3428 → 3424
→ 3420 → 3415 → 3410
⚠️ Only short on a strong rejection or bearish engulfing candle near the resistance — do not short blindly.
🧠 Market Psychology Insight
The initial Asian-session rally was likely a news-driven liquidity event.
Institutions appear to be rotating capital, using emotional retail entries as exit liquidity.
Current market conditions suggest a shakeout before a longer-term bullish move.
📌 Final Note
Don’t chase price. Let it come to your zones. This market is being driven by geopolitical narrative and smart money behavior, not just technicals alone.
✅ Stay patient.
📊 Trade with logic.
🧘♂️ Let others FOMO — you focus on levels and confirmation.
👉 Follow for real-time London session updates and reaction-based entries.

XAUUSD: The beginning of range trading.Last week, I perfectly predicted the sharp rise in the market. At the beginning of this week, XAUUSD reached a high of 3451, which is the front pressure position. Due to the cooling of risk aversion in the international market, the New York market fell back to 3373 on Monday.
XAUUSD did experience a typical "news-driven callback", and the analysis of technical and fundamental aspects is very critical. The following is a professional analysis and operation suggestions for the current market:
Key points and technical structure
1. Pressure level: 3450 area
- The previous high pressure is effective. This is the resonance resistance area of the upper track of the daily level channel + Fibonacci 61.8% retracement level, and the demand for long profit-taking is concentrated.
2. Support level: 3370-3380 area
- Currently falling back to 3373, here is:
- 50-day moving average dynamic support
- 4-hour chart previous low level support platform
- Fibonacci 38.2% retracement level
- If the daily closing is above 3380, the technical structure is still a healthy correction.
News-driven logic
- Negative factors:
Geopolitical situation and peace talks ➜ Risk aversion cools down ➜ Gold's attractiveness as a safe-haven asset decreases.
- Potential risks:
The progress of peace talks may be repeated (such as the situation between Israel and Hamas and Russia and Ukraine). If the negotiations fail, safe-haven buying will return quickly. Need to keep an eye on news sources.
Key signals for long-short game
Long signal: long lower shadow candlestick appears in 3370 area, US dollar index (DXY) falls below 105.0
Short signal: rebound fails to break through 3400 integer mark, US bond yield rises above 4.3%
Trading strategy suggestion
- *Long order opportunity*: 3370-3380 light position to try long, stop loss 3355 (below the previous low), target 3400/3420.
- *Short order opportunity*: 3415-3425 to arrange short orders in batches, stop loss 3440, target 3390.
2: Break down
- Trigger condition: daily closing price <3365
The callback is upgraded to a deep correction
- Target: 3340→ 3300 (psychological barrier + trend line support)
- Operation: Chasing short needs to wait for a rebound to around 3400, stop loss 3420.
3: Restart the rise (probability 10%)
- Trigger condition: Break through 3440 and stand firm for 1 hour
- Possible driving force: Geopolitical conflict escalates/Fed rate cut expectations rise
- Target: 3480 (historical high psychological resistance) → 3500
- Operation: After breaking through 3440, step back to 3425 to chase longs, stop loss 3405.
Key event risks this week
1. Wednesday: US May CPI data (core CPI expected to be 3.5%)
- If data > expectations: expectations of rate hikes rise → bearish for gold
- If data < expectations: expectations of rate cuts come earlier → bullish for gold
2. Thursday: Fed interest rate decision + Powell press conference
- Pay attention to the dot plot's hints on the number of rate cuts in 2024 (current market pricing is about 2 times)
3. Geopolitical headlines: progress in the Iran nuclear agreement, black swan risks in the French election
Position management principles
1. Total risk exposure ≤ 5% of account net value
2. Reduce positions by 50% 3 hours before key events (avoid instantaneous fluctuations in CPI/FOMC)
3. Breakout strategy stop loss setting: 15 points outside the previous high/low to prevent burrs
Conclusion: The effectiveness of the current 3373 support needs to be verified by Wednesday's CPI data. It is recommended that the London market operate in the 3370-3420 range and reduce positions before the US market to wait for data guidance. If you hold long positions, 3380 is the last line of defense; if you hold short positions, consider taking profits in batches above 3400. The medium-term bullish trend of gold has not been broken, but the risk aversion premium needs to be digested in the short term.
If you need a more detailed entry point analysis or position management to solve your long-term loss problem, please feel free to tell me your trading cycle and risk preference, and I will provide you with a customized strategy.

GOLD recovers from $3,371, risks remain highOn Tuesday (June 17) in the Asian market, the spot price of OANDA:XAUUSD suddenly fell sharply in the short term, and the price of gold once fell below 3,380 USD/ounce. As investors watched the hostile situation between Israel and Iran, US President Trump called for an immediate withdrawal of troops from Iran and ordered officials to be ready in the situation room, boosting demand for safe-haven assets.
Trump posted on his social media platform "Real Social": "Iran should sign the 'deal' I asked them to sign. What a shame and waste of lives. Simply put, Iran cannot have nuclear weapons. I have said this over and over again! Everyone should evacuate Tehran immediately!"
Axios News reported that shortly after Trump's tweet, Iranian media reported explosions and heavy anti-aircraft fire in Tehran. It is unclear whether there is any connection between Trump's tweet and the attack.
According to the latest report from Fox News, US President Trump asked the National Security Council to be on standby in the White House Situation Room after he cut short his trip to the G7 summit and returned to Washington earlier than expected.
The White House Situation Room is a conference room and intelligence management center located in the basement of the West Wing of the White House, with a total area of about 460 square meters.
The main purpose of the White House Situation Room is to provide a working space for the National Security Council, including the President of the United States, the Vice President, the White House Chief of Staff, the Secretary of State, the Secretary of Defense, the Chairman of the Joint Chiefs of Staff, the Director of the Central Intelligence Agency, the National Security Advisor, etc., to quickly discuss and respond to sudden domestic and international events affecting the national security of the United States. It has advanced and complete security communication facilities, allowing the President of the United States to control the United States military around the world at any time.
WTI crude oil prices rose about 3.00% on the day after Trump told officials to be ready in the situation room.
These market risks clearly leave plenty of room for gold to rise, and the current decline, which is being driven by profit-taking, is unlikely to last.
Technical Outlook Analysis OANDA:XAUUSD
After a sharp decline, gold has recovered from the support level noted to readers in the previous issue at the price point of 3,371 USD, which is the location of the 0.236% Fibonacci retracement, and currently the original price point of 3,400 USD is the nearest resistance at present.
If gold breaks above 3,400 USD, it will have the conditions to aim for the target of 3,435 USD in the short term.
Currently, gold still has enough technical conditions for an uptrend with the price channel as the short-term trend, while the price channel as the long-term trend and the EMA21 as the nearest support at present.
In terms of momentum, the Relative Strength Index (RSI) remains above 50 and is far from overbought territory, suggesting that there is still plenty of room for upside ahead.
The current declines should still be viewed as a short-term correction rather than a full-fledged trend, or as a buying opportunity.
During the day, the technical bullish outlook for gold will be highlighted by the following positions.
Support: $3,371 – $3,350
Resistance: $3,400 – $3,435
SELL XAUUSD PRICE 3420 - 3418⚡️
↠↠ Stop Loss 3424
→Take Profit 1 3412
↨
→Take Profit 2 3406
BUY XAUUSD PRICE 3350 - 3352⚡️
↠↠ Stop Loss 3346
→Take Profit 1 3358
↨
→Take Profit 2 3364

GOLD BULLISH OUTLOOK📊 Gold Market Analysis – Bullish Outlook Developing
In yesterday’s market, we observed gold take out a key lower liquidity in the 3370s range. This liquidity sweep typically indicates the clearing of weak hands and positions the market for a potential reversal or continuation of a larger trend.
Following this move, gold has begun to establish a bullish trend stance, as the market structure shows signs of strength and renewed buying interest. The rejection of the 3370s level suggests that buyers are stepping in aggressively, potentially setting a solid foundation for an upward move.
From a technical perspective, this positions gold for a potential climb toward the 3440s, which serves as a short- to mid-term target. If the bullish momentum continues to build — particularly if it’s supported by favorable macroeconomic data or weakening in the U.S. dollar — we could see price action surge above the 3440s, opening up further upside potential.
This developing bullish scenario has been highlighted and discussed in the analysis. Traders and investors should monitor key support and resistance levels closely, as well as any macro developments that could reinforce or challenge this upward trajectory.

Gold (XAU/USD) 4H Technical Outlook-17 June 2025Gold’s 4-hour chart shows a clear uptrend: price is making higher highs and higher lows, trading above key moving averages and an upward trendline
Analyst ManiMarkets notes “a remarkably robust and sustained uptrend… printing higher highs and higher lows” since late 2024. The nearest major hurdle is around the $3,500 all-time high.
The current structure remains bullish: we have not seen a sustained break of the uptrend, so the overall bias is bullish. In Smart-Money terms, recent price action shows no bearish break of structure on 4H (no BOS), and price is simply consolidating near highs – a bullish sign.
Key zones to watch:
Demand/Order Block (~$3,374–3,380): Around $3,375 is a swing-low and past demand area. It lines up with the 4H EMA50 and 1H EMA200, a classical support confluence.
A strong bullish “order block” (heavy buying zone) sits here – a typical smart-money support area.
Pivot Point (~$3,389): Using the classic pivot formula
On the recent 4H range gives Pivot ≈ 3,389. This acts as a short-term balance point.
Resistance (≈$3,400–3,405): Gold has multiple prior highs around $3,400–3,405 (e.g. the overnight high ~$3,405 and the last swing high ~$3,405) which have been repeatedly tested. Traders are watching a break above ~$3,405 for follow-through. (A recent idea noted gold “bounced off support” near $3,390 and is “looking for a clean sweep of the highs at 3405”.)
Major Resistance ($3,500): The all-time peak around $3,500 is a big psychological barrier.
We expect stiff supply if price approaches 3,500.
Using these levels, the pivot-based support and resistance on the 4H chart are:
Pivot Point: ~$3,389
R1: ~$3,406 (Pivot + 1×range)
R2: ~$3,421 (Pivot + 2×range)
R3: ~$3,437 (Pivot + 3×range)
S1: ~$3,374 (Pivot – 1×range)
S2: ~$3,357 (Pivot – 2×range)
S3: ~$3,342 (Pivot – 3×range)
(These are rough levels using the standard formula on the last 4H high/low.)
Beyond numbers, price-action is key: we look for bullish patterns at support (e.g. bull-engulfing or pin-bar at ~$3,375–3,380) and cautious action near resistance. A brief “liquidity grab” happened at the $3,375 area recently (price wiggled below and then shot back up), which in Smart-Money jargon sweeps stops.
That suggests larger players may have been absorbing buying interest. In short, the tape looks healthy for bulls unless $3,375 breaks decisively. A break of the $3,400–3,405 highs would be a bullish BOS (break of structure), targeting the next supply zone.
Trade Setups (1H, Aligned with Bullish Bias)
Below are three high-probability long setups on the 1-hour chart (in line with the 4H uptrend).
Each is sized for a ~$10 stop from the entry zone.
Buy near $3,374–3,380 (Demand Zone):
Entry: $3,374–3,380 area (around Pivot S1 and the recent swing low).
Direction: Buy.
Stop: ~$3,364 (just below this zone, ~$10 lower).
Targets: ~$3,402 (near Pivot R1/previous high), and then ~$3,420 (around next resistance).
Reason: This zone is a confluence of support – it was a recent 4H low and aligns with EMAs (1H EMA200/4H EMA50)
It acts like a “bull order block” where buyers stepped in
A strong bounce from here keeps the bullish structure intact.
Trigger: Look for a bullish reversal candle on 1H (e.g. an engulfing or pin-bar) forming near $3,375. This confirms rejection of lower prices and signals a buy setup.
Chart: Example 1H gold chart. Blue shaded area marks the ~$3,374–3,380 buy zone (Pivot S1/EMA support). A bullish reversal candle here would trigger a long entry, targeting $3,402 then $3,420.
Buy break-&-retest at ~$3,402–3,408:
Entry: After a close above ~$3,405, look to buy on a pullback into $3,402–3,408 (just above the old high).
Direction: Buy.
Stop: ~$3,392 (about $10 below the entry zone).
Targets: ~$3,430 (next swing high) and ~$3,450 (round level/upper channel).
Reason: A decisive move above ~$3,405 would mark a BOS (break of the prior high), shifting structure higher. That resistance then becomes support on a retest. This is a classic “breakout retest” entry. (As noted, highs around 3,405 have been tested repeatedly, so breaking them signals strength.)
Trigger: Wait for a 1H candlestick to close firmly above 3,405, then buy on the next pullback into the $3,402–3,408 range with a bullish candle or dip-buy signal.
Buy on pullback to ~$3,385–3,390 (minor higher low):
Entry: $3,385–3,390 if price dips but holds above the 4H pivot (~3,389).
Direction: Buy.
Stop: ~$3,375 (below the entry zone, about $10 down).
Targets: ~$3,420 and ~$3,450 (same as above levels).
Reason: If the market skips Setup 1 and 2, any 1H pullback that still holds above the pivot (creating a higher-low) is another opportunity. Buying this higher-low keeps us aligned with the 4H uptrend. Essentially, we allow price to re-test the pivot area as new demand.
Trigger: A bullish reversal pattern on 1H in the $3,385–3,390 area (for example, a hammer or bullish engulfing) would mark a higher-low and signal a long entry.
Each setup has a tight stop (~$10) just beyond the support zone, and logical profit targets at nearby resistance levels. All assume the 4H trend stays intact. If support fails (e.g. a clean break under $3,374), be ready to reassess.
Takeaway: Gold’s 4H trend is bullish, so focus on buying dips into identified support zones (not shorting). Use tight stops beyond those zones and aim for the next resistance. In practice, that means looking to go long around ~$3,375–3,380 and ~$3,405 (on a clean breakout), riding any bullish continuation toward $3,430–$3,450, while managing risk at each step.

Bullish reversal off 50% Fibonacci support?The Gold (XAU?USD) has bounced off the pivot and could rise to the 1st resistance which acts as a pullback resistance.
Pivot: 3,374.04
1st Support: 3,348.45
1st Resistance: 3,444.62
Risk Warning:
Trading Forex and CFDs carries a high level of risk to your capital and you should only trade with money you can afford to lose. Trading Forex and CFDs may not be suitable for all investors, so please ensure that you fully understand the risks involved and seek independent advice if necessary.
Disclaimer:
The above opinions given constitute general market commentary, and do not constitute the opinion or advice of IC Markets or any form of personal or investment advice.
Any opinions, news, research, analyses, prices, other information, or links to third-party sites contained on this website are provided on an "as-is" basis, are intended only to be informative, is not an advice nor a recommendation, nor research, or a record of our trading prices, or an offer of, or solicitation for a transaction in any financial instrument and thus should not be treated as such. The information provided does not involve any specific investment objectives, financial situation and needs of any specific person who may receive it. Please be aware, that past performance is not a reliable indicator of future performance and/or results. Past Performance or Forward-looking scenarios based upon the reasonable beliefs of the third-party provider are not a guarantee of future performance. Actual results may differ materially from those anticipated in forward-looking or past performance statements. IC Markets makes no representation or warranty and assumes no liability as to the accuracy or completeness of the information provided, nor any loss arising from any investment based on a recommendation, forecast or any information supplied by any third-party.

Citigroup predicts a decline in gold prices? Blacklisted?Information summary:
Citigroup analysts predict that by the second half of 2026, gold will fall back to around $2,500-2,700, with a significant reduction in investment demand, improved global economic growth prospects, and a decline in the factors that led to the rise in gold prices due to the Fed's interest rate cut.
My point of view is: blacklist Citigroup. Since last year, they have predicted that the highest point of gold prices will exceed $4,000, and they have constantly changed the forecast point in the middle, and now they even point out that the price will fall below $3,000, which is completely unreliable.
Market analysis:
In the early Asian session, it also rose strongly, and it seems that there is a lot of upward momentum, but $3,405 is the pressure position for the top and bottom conversion, and the rise in the morning is a lure. At this position, it fell rapidly, reaching a minimum of around $3,373.
The Asian market seemed to rebound strongly in the morning, but the MA5 and MA10 moving averages showed a downward trend. This kind of market cannot wait for a decline to go long, but it is also a repeated wash-out shock. The first focus below is the 3375-3370 area, followed by 3360. The short-term trend is still dominated by wash-out shocks.
The short-term important focus position is around 3405. 3405 is used as the dividing point between long and short positions. A short-selling strategy is carried out near this position. Pay attention to the 3375-3360 area below.

XAUUSD Long Gold is showing potential to revisit its previous peak, supported by bullish technical patterns and strong fundamental factors.

Top 5 Most Effective Forex Trading StrategiesTop 5 Most Effective Forex Trading Strategies Used by Professional Traders
Forex trading requires not just knowledge, but discipline and a clear strategy. So what are the most effective forex trading strategies that professional traders consistently use to achieve sustainable profits?
Let’s explore the 5 most trusted strategies that have stood the test of time – helping you level up your skills and reduce risk in this trillion-dollar market.
1. Breakout Strategy – Catching the Wave When the Market Explodes
A breakout occurs when price moves beyond a key support or resistance level after a period of consolidation. This usually signals the start of a new trend.
Best for: Traders who love strong momentum.
Pro tip: Confirm breakout with volume or candlestick patterns (e.g., engulfing).
Caution: Avoid entering right after the breakout – wait for a retest.
2. Trend Following Strategy – Trade with the Market, Not Against It
“Trend is your friend” – one of the most famous sayings in trading. This strategy helps traders ride the main trend, buying in uptrends and selling in downtrends.
Recommended tools: MA 20, MA 50, RSI, MACD.
Insider tip: Combine with pullback entries (enter when price retraces to dynamic support/resistance).
3. Price Action Strategy – Reading the Market Without Indicators
Price Action focuses on interpreting pure price behavior, without relying on indicators. Many pro traders prefer this approach to understand market psychology in real time.
Advantages: Clean, flexible, sharpens decision-making.
Popular candlestick patterns: Pin Bar, Inside Bar, Fakey, Engulfing.
4. News Trading Strategy – For Quick Thinkers and Fast Hands
When major news events like CPI, NFP, FOMC, or rate decisions hit the market, volatility surges. This creates both high-profit opportunities and high risks.
Common tactic: Straddle – place Buy Stop & Sell Stop before news release.
Risk warning: Watch out for slippage and widened spreads.
5. Fibonacci & Confluence Strategy – High-Probability Entries
This strategy combines tools like Fibonacci retracement, trendlines, support/resistance zones, and moving averages to find high-probability entry points.
Strength: Optimizes Risk: Reward ratio.
Tip: Focus on Fib levels 0.382 – 0.618 (commonly used retracement zones).
Conclusion: The Best Strategy is the One That Matches Your Style
There’s no perfect strategy – but understanding and applying the one that best fits your trading style will help you avoid emotional decisions and build long-term consistency.
Remember: Risk management – Emotional control – Systematic discipline = Long-term trading survival.

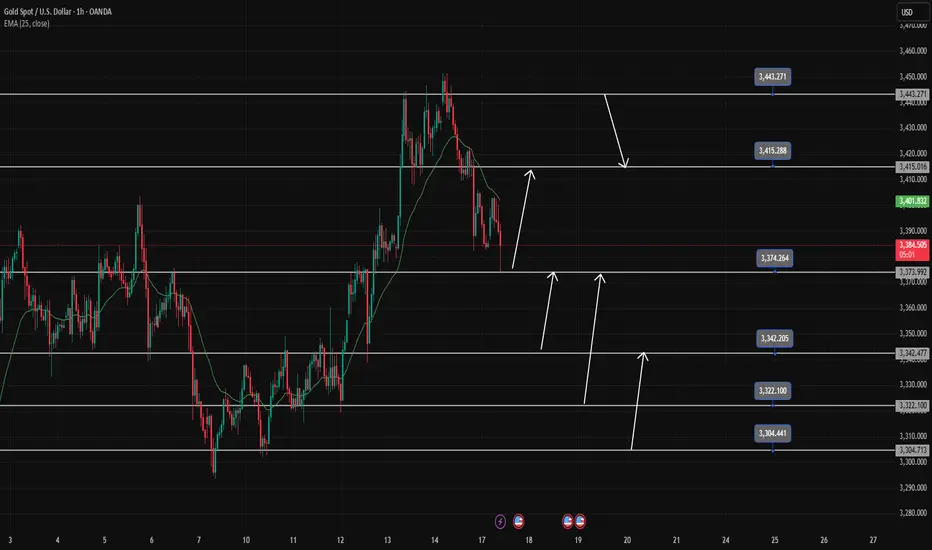
Gold trading strategy June 17D1 candle shows profit taking by sellers pushing the price back below 3400. In the current context, the pullback is only short-term and has not confirmed the reversal, but long-term Buy signals can still be noticed at important support zones.
Today, there are many price zones that can BUY Gold, so wait for confirmation before placing an order. Gold is heading towards the first support around 3375-3373 (this zone has just reacted 100 pips). This is also the Breakout zone. If it breaks this zone, Gold will reach 3343-3341 before it can BUY.
Note that to sell break 3373 and the SELL resistance point must wait for 3415 and the daily resistance 3443-3445
If there is a sweep to 3343 and bounces and closes above the 3373 breakout zone, it confirms that the uptrend will continue strongly in the near future.
The next BUY support zone to pay attention to is 3322-3320 and the 3305-3303 zone. The BUY target is always pushed further back to 3415 or to the peak around 3443.
SUPPORT: 3373;3342;3322;3304
RESISTANCE: 3415;3443
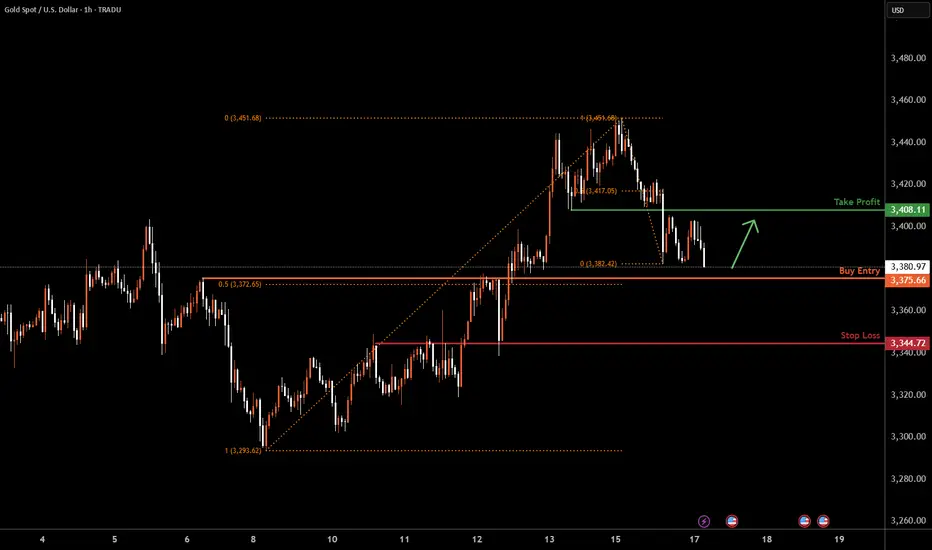
XAUUSD H1 I Bullish Bounce Off Based on the H1 chart analysis, we can see that the price is falling toward our buy entry at 3375.66, which is a pullback support that aligns with the 50% Fib retracement.
Our take profit will be at 3408.11, which is a pullback resistance level.
The stop loss will be placed at 3344.72, an overlap support.
High Risk Investment Warning
Trading Forex/CFDs on margin carries a high level of risk and may not be suitable for all investors. Leverage can work against you.
Stratos Markets Limited (tradu.com ):
CFDs are complex instruments and come with a high risk of losing money rapidly due to leverage. 63% of retail investor accounts lose money when trading CFDs with this provider. You should consider whether you understand how CFDs work and whether you can afford to take the high risk of losing your money.
Stratos Europe Ltd (tradu.com ):
CFDs are complex instruments and come with a high risk of losing money rapidly due to leverage. 63% of retail investor accounts lose money when trading CFDs with this provider. You should consider whether you understand how CFDs work and whether you can afford to take the high risk of losing your money.
Stratos Global LLC (tradu.com ):
Losses can exceed deposits.
Please be advised that the information presented on TradingView is provided to Tradu (‘Company’, ‘we’) by a third-party provider (‘TFA Global Pte Ltd’). Please be reminded that you are solely responsible for the trading decisions on your account. There is a very high degree of risk involved in trading. Any information and/or content is intended entirely for research, educational and informational purposes only and does not constitute investment or consultation advice or investment strategy. The information is not tailored to the investment needs of any specific person and therefore does not involve a consideration of any of the investment objectives, financial situation or needs of any viewer that may receive it. Kindly also note that past performance is not a reliable indicator of future results. Actual results may differ materially from those anticipated in forward-looking or past performance statements. We assume no liability as to the accuracy or completeness of any of the information and/or content provided herein and the Company cannot be held responsible for any omission, mistake nor for any loss or damage including without limitation to any loss of profit which may arise from reliance on any information supplied by TFA Global Pte Ltd.
The speaker(s) is neither an employee, agent nor representative of Tradu and is therefore acting independently. The opinions given are their own, constitute general market commentary, and do not constitute the opinion or advice of Tradu or any form of personal or investment advice. Tradu neither endorses nor guarantees offerings of third-party speakers, nor is Tradu responsible for the content, veracity or opinions of third-party speakers, presenters or participants.
Gold is Nesting... Have updated the counts since my last post.
I believe we have a series of ones and twos since the 15th May low...
Once we start moving into the third of the third of the third, US Indices will commence either a correction or another bearish leg.
Have been long Gold and will be holding my positions.

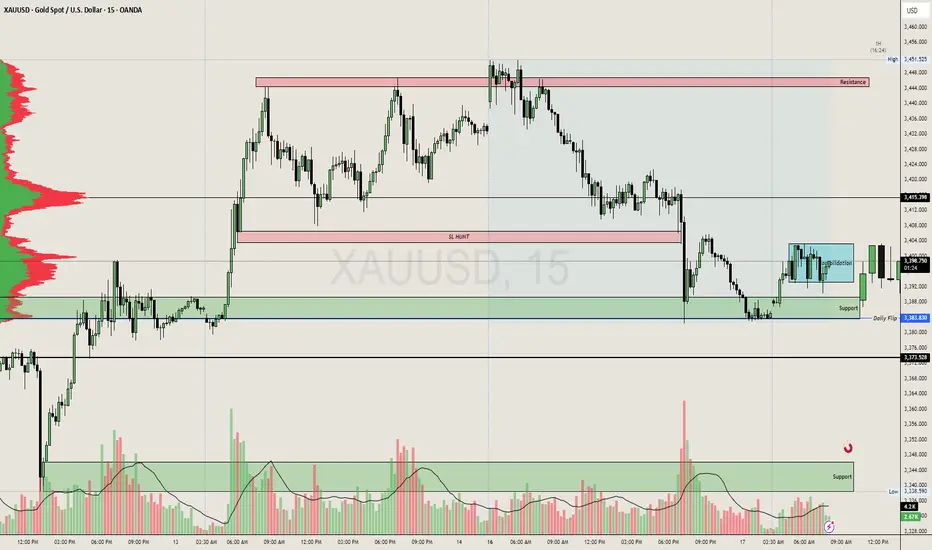
Sell-Side Breakdown for XAUUSD (Gold) on the 15-Minute chart🔻 Sell-Side Analysis – June 17, 2025
🧠 Context & Market Structure
Price rejected major resistance around 3415–3448 zone.
SL Hunt zone marked at mid-levels around 3400–3408, showing manipulation.
Current price: ~3397, after bouncing from the Daily Flip (support) at ~3388.
---
📉 Bearish Case Setup
1. Distribution Pattern at the Top
The upper resistance zone has been tested multiple times without a breakout.
Clear sign of exhaustion, with possible Smart Money Distribution.
2. Lower High Formation
After breaking the short-term demand (green box), price formed a lower high near 3404–3405.
Bearish market structure forming.
3. Consolidation Breakdown Likely
Price is currently inside a small consolidation box (3393–3402).
Failure to break and hold above 3402 = bearish continuation.
Look for breakdown retests below 3393 to confirm.
---
🔻 Sell Zones
Zone 1: 3402–3405 = good supply/retest area for shorts.
Zone 2: 3410–3413 = high-risk re-entry (SL hunt zone retest).
---
🎯 Targets for Shorts
TP1: 3388 (Daily Flip)
TP2: 3373–3375 (next volume node and support block)
TP3: 3365 (if full breakdown with momentum)
---
🛡️ Invalidation
Clean break and hold above 3405–3410 invalidates bearish bias short term.
If price reclaims SL Hunt zone and flips it, bullish continuation is likely.
---
🔍 Volume + Order Flow Notes
Volume spikes around support zone hint at buyer absorption, not dominance.
Bullish bounce lacked follow-through = potential sign of weak buyers.
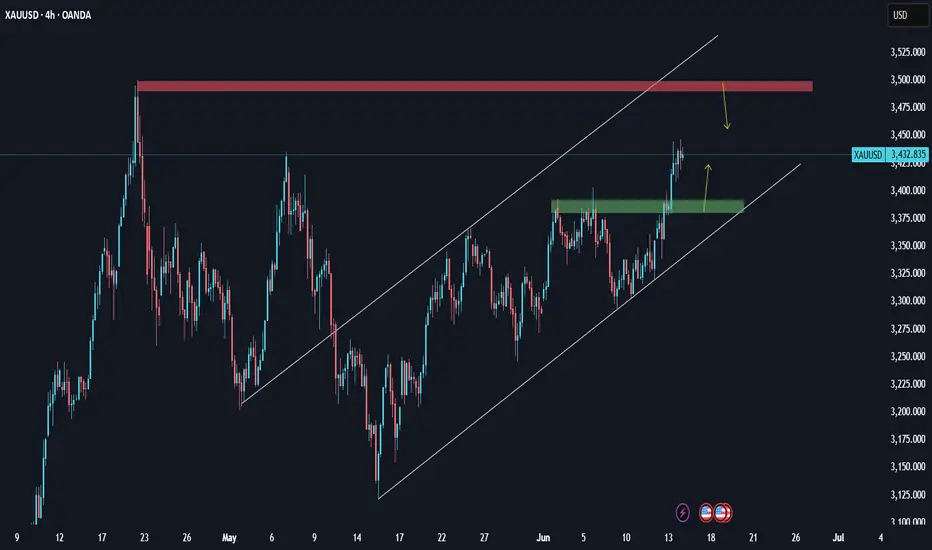
XAUUSD: Analysis H4 next weekThe continued tension in the Middle East (Israel–Iran) has led to a flight to safe havens, a key driver for gold.
Reduced pressure from the USD due to expectations that the Fed will slow down its rate cut (~September), coupled with inflationary pressures, could support gold prices
If tensions in the Middle East do not ease next week, gold's rally could extend and we could see 3500. But be careful, as if tensions ease and some good news from the USD comes, the rally could be halted.
Continue to be bullish after successful adjustment of low longToday, gold opened high at 3448, and fell under pressure after touching 3452. It fell after repeatedly confirming resistance at high levels. We arranged short orders in the 3445-3450 area, successfully touched the target of 3330, and realized profit-taking. Then the market fell back to around 3409 and stabilized and rebounded. We arranged long orders and stopped profit at around 3420. Then we fell back and arranged long orders of 3385 and 3395 to take profits at 3405.
Overall, gold fell slowly after opening high, and maintained sideways consolidation in the European session. The US session continued to fall due to the easing of the geopolitical situation. At present, the focus of the evening is on the support of 3390. If it does not break after the retracement, it can still go long. Pay attention to the key pressure levels of 3410 and 3422 above. The current market is still in the adjustment stage of the upward trend. After the adjustment, it is expected to continue the upward rhythm.
Operation suggestion: Go long on gold when it falls back to around 3390-3392, with the target at 3410 and 3435.
If you still lack direction in gold trading, you might as well try to follow my pace. The strategy is open and transparent, and the execution logic is clear and definite, which may bring new breakthroughs to your trading. The real value does not rely on verbal promises, but is verified by the market and time.

XAUUSD Bouncing back to 3450?3380.27, 3383.94 and 3386.08 three daily consecutively candlestick patter with continuted series of higher low formed the daily support. Previous daily candle just closed at support with an ATR of 1.1ATR, which is quite large in the opposite direction of the major trend while the price is trading above 10ema in the daily.
In 4h there is also 3 ATR ( overall) bearish move is spotted giving a high probability for this market to bounce back to the daily resistance to the major direction of the trend.
We have a buy position at this level and will keep you posted for more updates!

GoldFxMinds Sniper Plan — June 17, 2025 🚀 GoldMinds Battle Plan Loaded — June 17, 2025
Good morning GoldMinds 👋
The market is again building perfect traps after CPI & PPI whipped both sides last week. Liquidity is stacking and volatility is hiding behind a quiet news calendar — exactly when the market loves to attack both sides. We stay patient, sniper-style.
🌎 Macro & Sentiment:
No major data today, but liquidity still reacts after last week’s CPI & FOMC tone.
DXY remains stable — gold remains capped inside premium supply zones.
The real game now is liquidity manipulation — we focus on clean execution.
🔬 Structure & Bias:
✅ D1: Liquidity sweep above 3450 — sellers protecting premium.
✅ H4: Lower high distribution forming.
✅ H1: Bearish order flow starting to control.
✅ EMAs 5/21/50: compressed bearish.
✅ RSI: showing divergence on intraday.
Bias: Tactical Bearish — under 3460 we remain sellers on sweeps. Liquidity hunts both ways but premium remains the trap zone.
🎯 Sniper Zones
🔻 SELL ZONES:
3405 – 3410 → early pullback rejection zone
3435 – 3445 → main OB liquidity sweep
3452 – 3460 → extreme premium trap zone
🔻 BUY ZONES:
3365 – 3380 → golden zone buy (perfect fibo confluence)
3335 – 3345 → deep flush exhaustion buy
🔄 Tactical Scenarios
Sell spikes into premium → M15 rejection → target 3380 first.
If flushed into golden zone → watch M15 confirmation → target 3405.
If deep flush into 3335 → exhaustion buy setups only.
💡 Tactical Notes
No chasing — liquidity first, reaction second.
News absence = perfect condition for engineered liquidity sweeps.
Stay sniper. Only act when structure confirms.
🔥 If this sniper battle plan helps you prepare, smash the 🚀, drop your bias in comments & hit FOLLOW to support real structure-based trading. Let’s bring back real value content to TradingView.
GoldFxMinds 🧠✨

XAU/USD 1H Technical Breakdown – Structure Shift in ProgressThis chart captures a clear market structure transition on Gold’s 1-hour timeframe, highlighting a shift from bullish momentum to a potential bearish phase.
🔍 Key Observations:
Uptrend Structure:
Price had been respecting a bullish channel with a sequence of Higher Highs (HH) and Higher Lows (HL), showing strong bullish momentum.
Break of Structure (BOS):
The bullish market structure was invalidated when price broke below the most recent Higher Low, marking a Break of Structure (BOS). This signals the end of the uptrend and beginning of possible bearish control.
CHoCH (Change of Character):
Before the BOS, price failed to make a new HH and began forming lower highs — this internal shift hinted at weakness and can be considered the Change of Character, occurring subtly before the BOS.
Bearish Projection:
Price is expected to retest the broken structure (potential lower high formation) and continue dropping toward the demand zone (green box) around $3,330 - $3,340.
Supply Zone Above:
The upper green zone marks a supply region, from where the bearish rejection initiated, reinforcing the bearish bias.
✅ Conclusion:
This is a textbook example of a trend reversal setup:
CHoCH ➤ BOS ➤ Pullback ➤ Continuation.
Traders may watch for short opportunities after a bearish retest, with the green demand zone below as a potential take-profit area.

Gold under pressure: imminent rally or programmed pullback? \ Gold under pressure: imminent rally or programmed pullback? The 3,400\$ crossroads\
\ Good evening, fellow traders – welcome back to this scorching summer… on the charts!\
Yes, it’s been a while since my last post. But you know how it goes: when gold is silent, it’s usually loading up a big move.
Meanwhile, I hope my previous analyses have kept you company — and more importantly, brought you value.
Spoiler: \ I haven’t missed a single one.\
Before we begin: \ drop a boost and leave a comment\ . The community is our most precious gold.
📍 \ Current Context\
XAU/USD is walking a tightrope between \ 3,400\$ and 3,440$\ .
This is a pivotal level, surrounded by international tension, a weakening dollar, and volatile economic expectations.
The question is simple: \ Are we heading for new highs? Or dipping to refuel first?\
🐂 \ Bullish Scenario: eyes on 3,440$\
A clear breakout above \ 3.440$\ could trigger the next leg up.
🎯 \ Target: 3,500\$ (new all-time high)\
• Geopolitical stress between \ Iran and Israel\ remains unresolved
• The \ US dollar\ is sluggish, inflation is creeping back in
• Markets are betting on a \ Fed rate cut\
• Gold? It smells fear better than anyone
🐻 \ Bearish Scenario: 3,400\$ must hold\
If buyers can’t defend the \ 3.400$\ level, we could see a step-by-step correction toward:
📉 \ Bearish Targets:\
• 3,295\$
• 3,245\$
• 3,120\$
• 3,070\$
As long as price stays below \ 3,440$\ , every bounce remains \ a selling opportunity, not a moonshot fantasy\ .
🌍 \ Geopolitical Snapshot (16/06/2025)\
• Iran and Israel keep exchanging “gifts” — drones, missiles, and tension
• The dollar is losing safe-haven status, giving gold the spotlight
• Oil is back above \ 73$\ , triggering renewed inflation concerns
• The Fed is increasingly likely to \ cut rates\ , weakening the dollar and reinforcing gold’s strength
📊 \ Operational Summary\
| \ Direction\ | \ Trigger Level\ | \ Target\ | \ Strategy\ |
| --------------------- | ---------------------- | ----------------- | ------------------------ |
| \ LONG (Buy)\ | Break above 3,440\$ | 3,500\$ | New ATH |
| \ SHORT (Sell)\ | Below 3,400\$ | 3,295\$ → 3,070\$ | Technical pullback setup |
🎯 \ Conclusion: the plan exists – just not the one you’re expecting\
Gold is standing at a major crossroads. Either it breaks out… or catches its breath.
But remember: \ we’re traders, not prophets. We don’t predict — we react.\
I’m watching closely, ready to strike… with the right foot forward. Are you?
\ Share your thoughts in the comments.\
\ Drop a boost and support those who help you see beyond the candles every single day.\
\ PipGuard\

Gold Cooling After Spike – $3375 Key Level to WatchBy analyzing the gold chart on the 4-hour timeframe, we can see that after surging to $3450 amid the Iran–Israel conflict, gold faced a pullback following a liquidity sweep above that level.
Currently, gold is trading around $3392, and after a potential correction down to $3375, I expect to see further upside movement.
⚠️ Stay cautious — gold remains highly volatile and sudden moves are likely!
