Adjustments do not change the trend, continue to be bullishToday, gold opened high at 3448, and fell under pressure after reaching 3452. After repeatedly confirming resistance at high levels, it went down. We arranged short orders in the 3445-3450 area, successfully reached the target of 3330, and secured profits. Then the market fell back to around 3409 and stabilized and rebounded. We arranged long orders to stop profit near 3420. The current market is still in a bullish trend after the shock and retracement. Adjustment does not change the trend. Retracement is an opportunity. The key is to find the right entry point.
From a technical perspective, the support below focuses on the 3410-3405 area, and the key support is at 3400-3390. If the daily level stabilizes in the above area, the upward structure will continue, and the short-term is still expected to test the previous high. Short orders need to strictly control risks, and the trend of low and long is still the main theme.
Gold operation strategy: Buy gold when it falls back to around 3410-3405, and consider covering positions when it falls back to 3400-3395, with the target at 3430-3440.
For more real-time strategies, I will remind you at the key points as soon as possible,🌐 remember to pay attention!
If you still lack direction in gold trading, you might as well try to follow my pace. The strategy is open and transparent, and the execution logic is clear and definite, which may bring new breakthroughs to your trading. The real value does not rely on verbal promises, but is verified by the market and time.
Xauusd(w)

XAUUSD Weekly analysis of xauusd
We can see bearish bias in 4hr Time Frame
Always wait for confirmation/strong setup for open a trade.
Thank you and Good Luck!
Happy trading.

Middle East tensions ease? Prices fall?Information summary:
Iran sent a peace signal to the United States and Israel through Arab intermediaries - requiring the United States not to carry out air strikes as a prerequisite for restarting nuclear negotiations, and emphasizing to Israel that controlling violence is in the common interest.
Under the influence of this news, gold turned downward several times, reaching a low of $3,383, and then rebounded slightly. The current price fluctuates slightly above $3,400.
Market analysis:
Technical analysis shows that the current price has broken through the key resistance area of the previous high and the middle track resonance. The 4-hour chart continues to be bullish under the support of the middle track, and the short-term sideways adjustment is a normal accumulation of upward momentum.
If the integer mark of $3,400 can be maintained, the hourly chart is expected to continue the upward trend after a narrow range of fluctuations, and accelerate to a new high after breaking through; on the contrary, if this position is lost, it is necessary to be vigilant about the risk of trend reversal.
The geopolitical crisis continues to ferment, injecting medium- and long-term safe-haven demand into gold. Combined with the strong closing pattern at the weekly level, the core operation strategy should be to buy on the pullback, focusing on the 3400-line long-short dividing line. At present, the price can be arranged for long orders, and the target will be the previous high point after breaking through 3415, but the risk of falling back from the high point must be strictly prevented.
Good luck to everyone in the new week.

Gold has broken below the $3,400 level.The gold price continued its steady retracement during the European session, pulling back from a two-month high to around $3,400. The positive performance of equity markets is regarded as a key factor undermining the safe-haven demand for precious metals, as gold's three-day winning streak appears to have come to an end. However, analysts believe the downside remains limited, as traders may avoid aggressive positioning ahead of Wednesday's crucial Federal Open Market Committee (FOMC) policy decision.
Meanwhile, growing market expectations that the Federal Reserve will further cut interest rates in 2025 have kept the U.S. dollar under sustained pressure after it hit a three-year low last Friday. This scenario, in turn, provides some support for non-yielding gold. Additionally, persistent trade uncertainties and escalating geopolitical tensions in the Middle East may emerge as drivers for gold prices, keeping bearish traders cautious before any meaningful downward moves.
Although gold has broken below $3,400 and the short-term trend has shifted, the long-term direction remains unchanged with a bullish bias. There is still potential to target the $3,500 high in the future, but it is necessary to wait for the bottom to stabilize before accumulating long positions. In the current market, we can only follow the trend—adapting to market movements. Consider initiating short positions during the rebound in the coming two days.
you are currently struggling with losses,or are unsure which of the numerous trading strategies to follow,You have the option to join our VIP program. I will assist you and provide you with accurate trading signals, enabling you to navigate the financial markets with greater confidence and potentially achieve optimal trading results.
Trading Strategy:
sell@3420-3430
TP:3380-3390

GOLD ROUTE MAP UPDATEHey Everyone,
Great start to the week with our chart idea playing out to perfection once again!!
We started with our Bullish target at 3440 hit followed with no ema5 cross and lock confirming the perfect rejection, showcasing the accuracy of our levels. This rejection went onto hitting our Bearish target, followed with ema5 cross and lock opening 3393, which was also hit perfectly.
We will now look for ema5 lock below 3393 to open the swing range or failure to lock below will see the upper Goldturns tested again.
We will see levels tested side by side until one of the weighted levels break and lock to confirm direction for the next range.
We will keep the above in mind when taking buys from dips. Our updated levels and weighted levels will allow us to track the movement down and then catch bounces up.
We will continue to buy dips using our support levels taking 20 to 40 pips. As stated before each of our level structures give 20 to 40 pip bounces, which is enough for a nice entry and exit. If you back test the levels we shared every week for the past 24 months, you can see how effectively they were used to trade with or against short/mid term swings and trends.
The swing range give bigger bounces then our weighted levels that's the difference between weighted levels and swing ranges.
BULLISH TARGET
3440 - DONE
EMA5 CROSS AND LOCK ABOVE 3340 WILL OPEN THE FOLLOWING BULLISH TARGETS
3463
EMA5 CROSS AND LOCK ABOVE 3463 WILL OPEN THE FOLLOWING BULLISH TARGET
3483
EMA5 CROSS AND LOCK ABOVE 3483 WILL OPEN THE FOLLOWING BULLISH TARGET
3508
BEARISH TARGETS
3418 -DONE
EMA5 CROSS AND LOCK BELOW 3418 WILL OPEN THE FOLLOWING BEARISH TARGET
3393 DONE
EMA5 CROSS AND LOCK BELOW 3393 WILL OPEN THE SWING RANGE
3372
3353
EMA5 CROSS AND LOCK BELOW 3353 WILL OPEN THE SECONDARY SWING RANGE
3330
3306
As always, we will keep you all updated with regular updates throughout the week and how we manage the active ideas and setups. Thank you all for your likes, comments and follows, we really appreciate it!
Mr Gold
GoldViewFX

XAUUSD 16 June – Liquidity Trap or Smart Money Rotation? XAUUSD 16 June – Liquidity Trap or Smart Money Rotation?
Gold surprised many traders with a sharp spike during the Asian session, only to reverse aggressively hours later. While headlines screamed “war” and panic, the price behavior told a different story—one of strategic distribution and smart money rotation...
🌍 Macro & Fundamental Context
Geopolitical triggers: Rising tensions in the Middle East (Israel-Iran) and political assassinations triggered emotional buying across safe-haven assets like gold and oil.
Institutional rotation: Major funds appear to be offloading gold positions to rebalance into equities (in correction) and oil (strong upside potential).
Market narrative: News-induced FOMO drives retail into overbought zones, allowing larger players to exit at premium prices.
📈 Technical Overview (M30 Structure)
Price Action: Gold tapped into major resistance at 3456–3458, showing an aggressive rejection shortly after.
EMA Behavior: EMAs (13/34/89/200) are flattening across M15 and M30—early signs of a possible bearish crossover.
Volume Drop: Declining volume after the spike suggests buyer exhaustion, reinforcing the idea of a bull trap.
Fair Value Gap (FVG): A visible liquidity void remains below the 3390 area. Price often returns to fill these zones.
🎯 Trading Plan for Today
✅ Scenario A: Buy from Demand Zone (Liquidity Fill)
Entry: 3383 – 3385
Stop Loss: 3377
Targets: 3386 → 3390 → 3394 → 3398 → 3402 → 3406 → 3410+
📌 Best executed during London or NY session if price shows absorption or reversal confirmation.
❌ Scenario B: Sell from Resistance Only on Clear Rejection
Entry: 3456 – 3458
Stop Loss: 3462
Targets: 3452 → 3448 → 3444 → 3440 → 3435 → 3430
⚠️ Only enter shorts if clear bearish engulfing or pin-bar setup forms near resistance zone.
🧠 Market Psychology
Retail FOMO is being exploited by larger players to exit risk positions.
Liquidity engineering is likely in play—smart money drives price up on headlines, then exits into buyer momentum.
Equity & Oil rotation signals a shift in institutional preference short-term.
📌 Final Thoughts
This isn’t a time to chase breakouts. Gold is entering a volatile re-accumulation phase where news is being weaponized to induce emotional trading. The real edge lies in waiting for price to come to your level and only executing with confirmation.
🎯 Zone to Watch: 3383 – 3385
📉 Avoid chasing moves
📊 Respect your SL & manage risk like a pro
—
🧭 Stay patient. The next big move will reward those with discipline and timing.

XAU/USD Bullish Continuation SetupThe chart illustrates a bullish market structure for XAU/USD, with price action currently trending upwards. Key technical observations:
Support Zone:
Price has recently bounced from a support zone around 3,399.710, indicating strong buying interest.
Bullish Projection:
A bullish continuation is expected. The chart outlines a potential scenario with a minor retracement towards 3,432.835 or 3,399.710, followed by a strong upward move.
Targets:
Immediate resistance is around 3,502.669.
If broken, price may aim for 3,550.351.
Final projected target lies near 3,680.000, which aligns with a historical supply zone.
Indicators:
The green enveloping bands suggest increasing volatility, with the price respecting the upper band, supporting bullish momentum.
Conclusion:
XAU/USD appears poised for a bullish breakout continuation. A potential pullback could offer a buy opportunity, targeting higher resistance zones as long as the structure remains intact

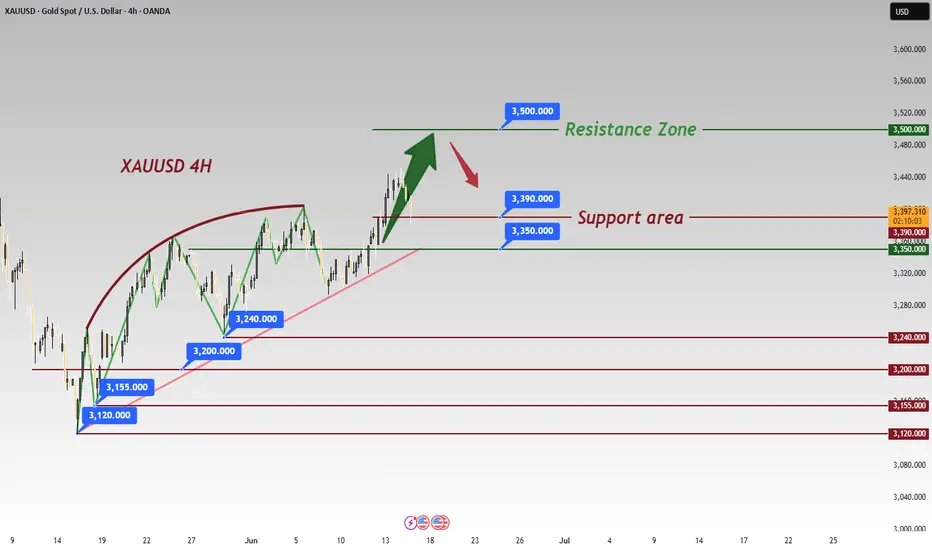
Gold Outlook: Bulls Defend Support Amid Rising Geopolitical RiskGold (XAU/USD) remains within a strong bullish structure on the 4-hour chart, trading inside an ascending channel. Recently, price attempted to break above the key resistance near $3,450 but failed, leading to a minor pullback toward the mid-channel area around $3,428–$3,430, where buyers are currently defending support. The key support remains at $3,394–$3,400, which also coincides with the ascending channel’s lower boundary.
As long as price holds above this level, the bullish trend remains intact, and there is potential for a breakout above the $3,450 resistance zone. If a breakout occurs and price closes above $3,450 on the 4-hour chart, the next bullish targets would be around $3,475 and then $3,500–$3,510. On the downside, if price fails to hold $3,394, it may trigger a short-term bearish correction toward the next support zone around $3,380–$3,370.
Overall, gold is currently in a consolidation phase inside the $3,394–$3,450 range, with a bullish bias above $3,394. A breakout above $3,450 may trigger strong upward momentum, while a break below $3,394 could open the door for a deeper correction.
🔑 Key Levels
Support: ~$3,394–$3,400 (channel floor) and intermediate support at $3,430–$3,440 .
Resistance: Immediate resistance zone is $3,445–$3,450, with broader upside potential toward $3,500+ if that break occurs.
Note
Please risk management in trading is a Key so use your money accordingly. If you like the idea then please like and boost. Thank you and Good Luck!

Iran seeks peace, Israel strikes – Gold dip, buy opportunity🌍 Iran's peace overtures sent gold prices plummeting to 3382, but Israel is unlikely to accept the olive branch lightly. With no clear signs of de-escalation in the Middle East situation, it's advisable to continue going long at lower levels 📉→📈
Israeli PM Benjamin Netanyahu vows military strikes will continue until Iran's nuclear program and ballistic missile capabilities are fully dismantled—showing no signs of halting ⚡. While he claims regime change is not the objective, he notes that given the weakness of Iran's leadership, political upheaval could emerge as a collateral outcome of the operations 🌪️
🌍 Currently, only Iran is seeking peace, but Israel won't simply end the war🌍 Currently, only Iran is seeking peace, but Israel won't simply end the war
⚡️⚡️⚡️ XAUUSD ⚡️⚡️⚡️
🚀 Buy@ 3385 - 3390
🚀 TP 3410 - 3420
Accurate signals are updated every day 📈 If you encounter any problems during trading, these signals can serve as your reliable guide 🧭 Feel free to refer to them! I sincerely hope they'll be of great help to you 🌟 👇

GOLD: Long Signal Explained
GOLD
- Classic bullish formation
- Our team expects pullback
SUGGESTED TRADE:
Swing Trade
Long GOLD
Entry - 3396.6
Sl - 3389.4
Tp - 3413.3
Our Risk - 1%
Start protection of your profits from lower levels
Disclosure: I am part of Trade Nation's Influencer program and receive a monthly fee for using their TradingView charts in my analysis.
❤️ Please, support our work with like & comment! ❤️

Try a R/R1 BuyThis signal is based on a 60% win rate backtested strategy...
1st order:
Buy @ 3418.3
SL: 3410
TP: 3426
2nd order:
Buy Limit @ 3414
SL: 3410
TP: 3426
Manage your Risk...

XAUUSD Hello Traders! 👋
What are your thoughts on GOLD?
Gold has broken above a major resistance level, and price has closed firmly above this zone, signaling strong bullish momentum and a shift in market sentiment.
We expect a brief pullback in the short term, followed by a resumption of the upward move toward higher targets and new highs.
As long as price remains above the identified support level, the bullish outlook remains valid.
Is gold ready for its next leg up after the pullback? Share your thoughts below! 🤔👇
Don’t forget to like and share your thoughts in the comments! ❤️
GOLD - WAVE 5 BULLISH TO $3,622 (UPDATE)Gold moving perfectly, according to our bullish analysis which I posted for you all last week. Gold been bullish for a technical perspective for a while, now we're seeing the elite push out the fundamental factor of the Israel attack on Iran, to help Gold keep moving up.
Gold is still within a 'Bullish Accumulation' phase, hence why it's not moving up very strong. Bare in mind, we are in the FINAL WAVE 5 bullish move on a HTF, so we can experience choppy price action.

XAUUSD - Is the gold bullish trend over?!Gold is trading in its ascending channel on the four-hour timeframe, above the EMA200 and EMA50. We should wait for consolidation or not above the drawn trend line to determine the future path of gold, which can be entered after its failure in the formed line, and on the other hand, if gold corrects towards the demand zone, it can be purchased in the short term with appropriate risk-reward.
Over the past week, the gold market moved within a narrow, calm range and showed little reaction to encouraging inflation data—until geopolitical developments once again shifted the landscape. Heightened tensions in the Middle East brought safe-haven demand back to the forefront of traders’ minds.
Following initial reports of regional unrest, gold quickly climbed from $3,324 to a weekly high of $3,377. Although the price saw a brief correction down to around $3,345, it resumed its upward momentum and opened Thursday’s trading session just one dollar below the symbolic $3,400 mark.
Rich Checkan, President and CEO of Asset Strategies International, commented on these recent geopolitical developments, stating: “The market’s direction is clear: it’s upward. With tensions rising following Israel’s attack on Iran, there’s no doubt gold will continue its climb next week.”
Darin Newsom, senior analyst at Barchart.com, also pointed to rising risks both domestically and globally: “Gold is on an upward path. Domestic unrest in the U.S., escalating conflict in the Middle East, broad selling of the U.S. dollar by other countries, and expectations that the Federal Reserve will hold rates steady—all support gold’s rise.”
Meanwhile, Daniel Pavilonis, senior broker at RJO Futures, analyzed the simultaneous reactions of gold and oil amid the recent Middle East tensions, looking for clues on their future direction. He explained: “Oil’s behavior can serve as an indicator for gold, as both are seen as inflation hedges and are sensitive to bond yields.”
Surprised that gold hasn’t yet reclaimed its April highs, Pavilonis emphasized: “If tensions escalate further, we could see additional gains. But if Iran moves toward negotiations or a truce, gold could remain elevated but range-bound, similar to the past two months. Breaking previous highs would require a stronger catalyst and a more significant worsening of the crisis.” He noted that while geopolitical tensions are currently the primary driver of gold’s strength, such rallies are typically short-lived.
Pavilonis added: “We saw a similar pattern last April—gold and oil spiked sharply but quickly corrected. Back then, trade war concerns with China persisted, inflation rates had fallen noticeably, and the initial supportive factors for gold gradually faded. Now, once again, a fresh geopolitical shock has emerged that may temporarily drive gold higher.”
After a week where market attention focused mainly on U.S. inflation data, investors’ focus in the coming days will shift to central bank policy decisions and potential signals regarding the future path of interest rates.
The trading week begins Monday with the release of the Empire State Manufacturing Index, offering an early view of industrial activity in New York. That same day, the Bank of Japan will announce its latest interest rate decision, potentially setting a new tone for Asian markets and the yen’s value.
On Tuesday, U.S. May retail sales data will be published—a key indicator of consumer strength. Signs of weakness could bolster market expectations for a rate cut.
Wednesday will be the pivotal day, as the Federal Reserve reveals its rate decision. While markets have fully priced in a pause in tightening, attention will focus on Jerome Powell’s remarks for any hints of rate cuts in the coming months. Also on Wednesday, May housing starts data and weekly jobless claims will be released.
With U.S. markets closed Thursday for Juneteenth, the spotlight will shift to monetary policy decisions from the Swiss National Bank and the Bank of England, both of which could impact currency market volatility. The week wraps up Friday with the Philadelphia Fed Manufacturing Index, a leading gauge closely watched by traders to assess the health of the manufacturing sector in the U.S. Northeast.

GOLD LIVE TRADE SIGNAL – June 16, 2025 (Price: $3415)🔵 Setup: BUY on Breakout — targeting continuation after corrective pullback
📉 Market Structure:
Bullish impulse completed a clear 5-wave Elliott structure
Current pullback forming a potential Wave 2 or IV
Price sitting above the breakout zone (~3391.6 support)
✅ Trade Details:
Entry: Buy @ 3422 (on bullish candle close above local resistance zone)
Stop Loss: 3408 (below consolidation low)
Target 1: 3445
Target 2: 3468
RRR: ~1:2.3
Confidence: HIGH — strong momentum wave + clean structure
🔍 Technical Confluence:
Wave (2) retracement respected
Channel breakout held (blue ascending)
Minor resistance around 3420 is being retested
Volume likely to spike in NY session
Caution: Avoid entry if price breaks below 3391.6 – would invalidate short-term structure.

SPY/QQQ Plan Your Trade For 6-16 : Up-Down-Up PatternToday's Up-Down-Up Pattern suggests the markets will transition into a moderate upward trending price bar - which is quite interesting in the world we have today.
War and a big weekend of events, protests and other new items could drive market trends over the next few days.
Still, the SPY Cycle Pattern for today is an Up-Down-Up - which suggests last Thursday was an Up bar, last Friday was a Down bar, and today should be an Up bar.
The Gold/Silver pattern is a POP pattern in Counter-trend.
I believe the US markets are benefiting as a safe-haven for capital as the global turmoil drives global investors to seek safety and security for their capital.
That means as long as the world continues to spin out of control, the US markets and the US-Dollar will act as a moderate safe-haven for capital.
Gold and Silver should also benefit from this global chaos.
Bitcoin is benefiting from the strength of the US markets (and the technology sector) as well.
Let's see how this week start to play out. I'm waiting for some more news.
Could be very interesting this week.
Get some.
#trading #research #investing #tradingalgos #tradingsignals #cycles #fibonacci #elliotwave #modelingsystems #stocks #bitcoin #btcusd #cryptos #spy #gold #nq #investing #trading #spytrading #spymarket #tradingmarket #stockmarket #silver

opportunity for selling GOLDI see that gold has confirmed strong resistance, so I took a sell trade with it.

gold on sell reverse#XAUUSD multiple 2 times breakout below 3408 will drop the price till 3400-3376.
Price holds bearish reversal below 3408, target 3400-3376. SL 3419.
Bullish range and reverse is at 3403.6 price can reverse from here but if drop happens first below 3399 its invalid.
H1 closure above 3425 holds longer bullish.

Buy on dips and seize rising opportunities📰 Impact of news:
1. Geopolitical risks
2. Expected Fed policy
📈 Market analysis:
The market opened higher in the morning and then continued to fall. From a medium-term perspective, the market is still in a medium-term bullish position. The price will only be under further pressure if it breaks below the weekly support. Observing from the daily level, the price broke through the daily resistance again last Wednesday and continued to soar after the breakthrough. The current price is testing the monthly high, and the subsequent gains and losses of the previous high are the key. Judging from the 1H chart, the short-term death cross continues to fall. At the same time, according to the 4H level, as time goes by, we need to pay attention to the support of 3413-3403. This support is the key watershed of the short-term trend. As long as it does not fall below this support, the bulls still have a chance.
🏅 Trading strategies:
BUY 3413-3403
TP 3430-3440
If you agree with this view, or have a better idea, please leave a message in the comment area. I look forward to hearing different voices.
OANDA:XAUUSD FX:XAUUSD FOREXCOM:XAUUSD FXOPEN:XAUUSD TVC:GOLD

Gold, continued to rise after a pullback
📌 Driving events
Israel and Iran launched a new round of attacks on each other on Sunday (June 15), exacerbating market concerns that the escalation of the war could trigger a wider regional conflict, and gold continued to receive support from safe-haven buying. (The author believes that according to media reports, Iranian leaders have shown a tougher attitude, and Iran cannot be ruled out to give Israel a strong counterattack, so the geopolitical situation in the Middle East may escalate in the next few days, and gold as a safe-haven asset will shine even brighter.
Kremlin: (On Putin's possible mediation of the Israeli-Iranian conflict) Russia is ready to intervene at any time if necessary. (The author hopes that the two countries will be reconciled as soon as possible)
📊Comment Analysis
1-hour chart: The rising channel breaks down, and short-term shorting is at 3442.
💰Strategy Package
Today's US market plans to sell high and buy low in the 3408-3452 range. If the range breaks, follow the trend, strictly lighten the position and set a good stop loss.
⭐️ Note: I hope traders can properly manage their funds
- Choose the number of lots that matches your funds
I hope everyone will set rules, control emotions, and take a long-term view, and slowly get rid of the control of desire, be at ease in the trading market, find their own way to make money, and truly enjoy the fun and rewards brought by trading.

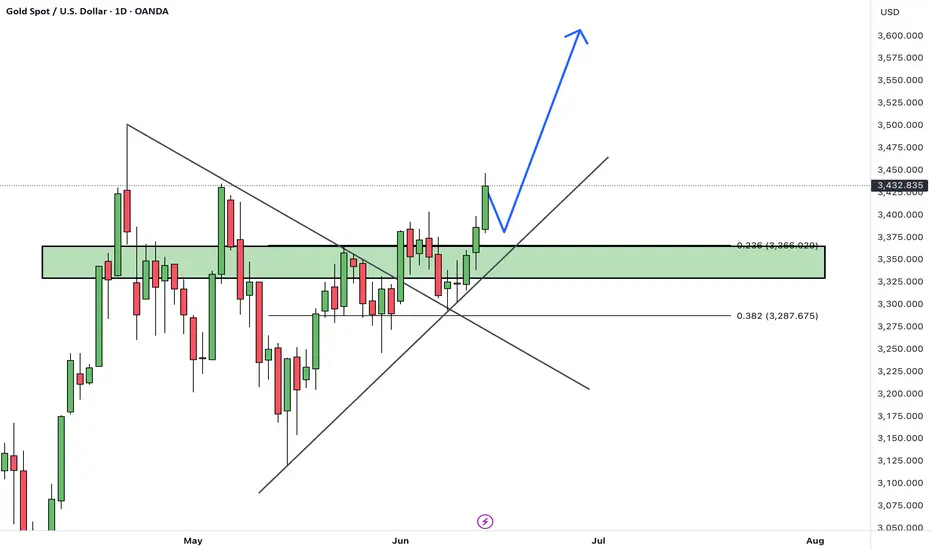
XAUUSD – Swing Trade and Trend FollowingXAUUSD – Swing Trade and Trend Following
Gold prices have been moving sideways, forming a consolidation range, and recently broke out to the upside last week.
Currently, the price is pulling back to retest the bullish Fair Value Gap (FVG). If it can bounce from the 3400 support level, the next target would be the Range Volatile Week High around 3500.
However, if the FVG fails to hold, the price may drop to the next support levels at 3350 and 3300.
These are critical supports that should not be broken, as they also align with the ascending trendline (Up Trend Line).
That said, this move is seen as a pullback for a potential continuation to the upside.
Strategy: Buy the dip
Wait for a reversal candlestick at the key support zones.
The bullish outlook would be invalidated if the price breaks below 3250.

Gold pullback supported at 3377Gold (XAU/USD) is trading lower during the first half of the European session, ending a three-day winning streak that had pushed it near a two-month high earlier on Monday. A stronger performance in equity markets is reducing demand for safe-haven assets like gold.
However, losses are limited due to a few key factors:
Ongoing Middle East tensions are keeping risk sentiment in check.
Expectations of Fed rate cuts in 2025 are weighing on the US Dollar, supporting gold.
Traders are cautious ahead of the upcoming two-day FOMC meeting starting Tuesday.
Despite the dip, gold is holding above the $3,400 level.
Key Support and Resistance Levels
Resistance Level 1: 3444
Resistance Level 2: 3460
Resistance Level 3: 3483
Support Level 1: 3377
Support Level 2: 3360
Support Level 3: 3340
This communication is for informational purposes only and should not be viewed as any form of recommendation as to a particular course of action or as investment advice. It is not intended as an offer or solicitation for the purchase or sale of any financial instrument or as an official confirmation of any transaction. Opinions, estimates and assumptions expressed herein are made as of the date of this communication and are subject to change without notice. This communication has been prepared based upon information, including market prices, data and other information, believed to be reliable; however, Trade Nation does not warrant its completeness or accuracy. All market prices and market data contained in or attached to this communication are indicative and subject to change without notice.
