Gold Technical & Fundamental Outlook for Next WeekIn this video, I break down the recent surge in gold prices, what drove the momentum, including rising tensions between Israel and Iran, and the impact of weaker U.S. inflation data that’s pushing Fed rate cut expectations.
Gold is now sitting just below the all-time high of around $3,500. With major U.S. economic events like Retail Sales and the Federal Reserve Interest Rate Decision coming up, this is a key moment for us to prepare.
💥 Will we see a breakout above resistance, or is a healthy dip on the cards before the next move? I’ll walk you through the key levels, the market psychology, and how I’m planning my trades this week.
💡 Make sure to like, comment, and subscribe for more weekly gold and forex market insights.
Disclaimer:
Based on experience and what I see on the charts, this is my take. It’s not financial advice—always do your research and consult a licensed advisor before trading.
#GoldAnalysis #XAUUSD #GoldPrice #ForexTrading #MarketOutlook #GoldForecast
#TechnicalAnalysis #FundamentalAnalysis #FOMC #FedRateDecision
#RetailSales #SafeHaven #GoldBreakout #TradingStrategy #ForexMentor
Xauusd(w)

GOLD's room for growth is still wide, new all-time peakThe Israel-Iran conflict has increased the safe-haven role of gold, while pushing up oil prices, putting further pressure on inflation alongside the tariff pressure from the Trump administration.
Although the Israel-Iran conflict may continue to push gold prices higher this week, investors should be cautious and avoid chasing the development of this conflict. Because, gold price increases due to geopolitical events are usually short-lived.
In addition to the Israel-Iran conflict, markets will witness a speech by Fed Chairman Powell this week. With the Trump administration’s tariff policy still complicated and the Israel-Iran conflict escalating, the Fed Chairman may continue to signal that interest rates will remain unchanged at the July FOMC meeting. However, there is growing speculation that the Fed may begin laying the groundwork for a rate cut later this year.
In the short term, gold prices may be less affected by the Fed's monetary policy. Investors will pay more attention to the Trump administration's tariff policy, especially when the 90-day tariff suspension is about to end.
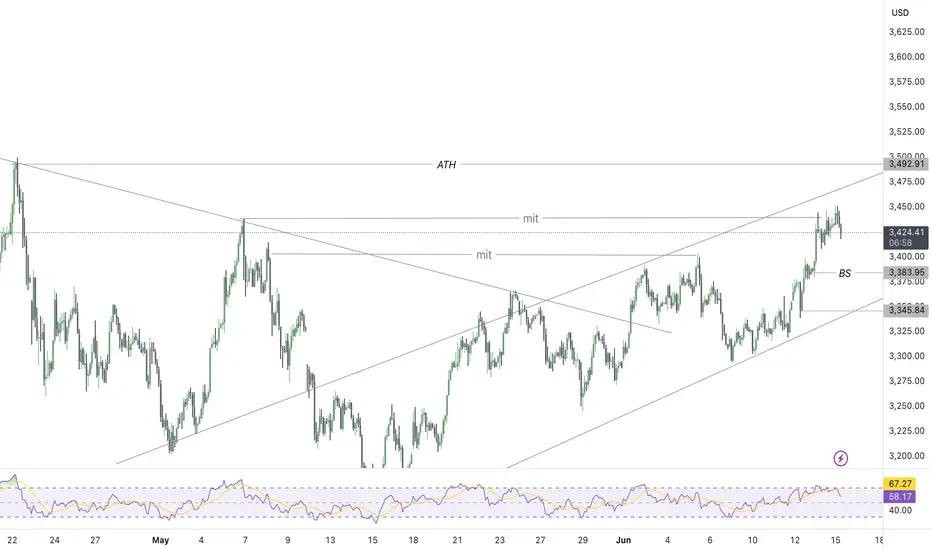
Technical Outlook Analysis OANDA:XAUUSD
Technical analysis still shows an upward trend in gold prices in the medium and long term, although gold prices will inevitably have periods of adjustment and accumulation, especially when the Israel-Iran conflict subsides.
Accordingly, if the gold price surpasses 3,446 USD/oz, it may continue to increase to the 3,500 USD/oz area. Conversely, if the gold price trades below 3,446 USD/oz, it may adjust to around 3,344 - 3,373 USD/oz, or even lower.
Notable technical levels are listed below.
Support: 3,400 – 3,371 USD
Resistance: 3,435 – 3,500 USD
SELL XAUUSD PRICE 3485 - 3483⚡️
↠↠ Stop Loss 3489
→Take Profit 1 3477
↨
→Take Profit 2 3471
BUY XAUUSD PRICE 3417 - 3419⚡️
↠↠ Stop Loss 3413
→Take Profit 1 3425
↨
→Take Profit 2 3431

GOLD WEDGE COMPLETION, BEARISH SWEEP ACTIVEJust as seen in the analysis, we see gold has filled its trend channel thereby giving the market a bearish stance creating bearish pull until the next POI
WE have our eyes on 3383 as a substantial zone for pullback correction zone and if any change in market sentiment, it would be updated ....
XAU/USD: Escalating Middle East Tensions Keep Bulls in ChargeThe chart shows that the gold price has successfully broken through the key resistance level of $3,400 and is currently fluctuating between $3,420 and $3,450, indicating that bullish forces are dominant in the short term. The $3,450 level has become a new resistance. If broken, it will attract more trend - chasing funds and drive the price higher; the $3,400 level has turned into strong support, and a breakdown could trigger panic selling.
The K - line chart shows strong bullish momentum recently, but the lengthening upper shadows suggest that bearish forces are also stepping in at high levels, intensifying the tug - of - war between bulls and bears. The moving average system is in a bullish arrangement with a golden cross formed, but the significant deviation of the price from the moving averages indicates a need for a correction to repair technical indicators.
In the short term, geopolitical conflicts may continue to support the upward movement of gold prices. However, the situation in the Middle East, U.S. economic data, and the Federal Reserve's monetary policy are all key variables. If the conflicts ease or the Fed turns hawkish, the gold price will face correction pressures.
XAUUSD
buy@3410-3420
tp:3440-3450
I am committed to sharing trading signals every day. Among them, real-time signals will be flexibly pushed according to market dynamics. All the signals sent out last week accurately matched the market trends, helping numerous traders achieve substantial profits. Regardless of your previous investment performance, I believe that with the support of my professional strategies and timely signals, I will surely be able to assist you in breaking through investment bottlenecks and achieving new breakthroughs in the trading field.

Gold (XAU/USD) Analysis - 16 June 20254H Chart: Market Structure & Bias
Gold’s 4-hour chart shows a bullish structure: price has been making higher highs and higher lows (a valid Break of Structure/BOS)
No bearish Change of Character (CHoCH) signal is present to suggest a reversal, so the overall bias remains bullish. In other words, the trend is intact and buyers still dominate. Key moving averages (not shown) also slope upward, reinforcing a “buy the dip” bias. We note that price recently stalled near 3427–3435, forming a small consolidation. This clustered area around the recent high acts as a near-term supply (resistance) zone (a possible order block where big players sold).
On the downside, prior support is visible around 3380–3400, where buyers stepped in on earlier pullbacks. In summary, the 4H bias is bullish, with dips into demand areas likely to attract buying interest.
Support/Demand Zones: At ~3380–3400 there is significant buying interest (a demand zone), as well as a minor support band around 3330–3350. These areas coincide with key Fibonacci retracements (around 50–62% of the last rally), making them high-probability bounce zones.
Resistance/Supply Zones: On the upside, the 3420–3435 range is resistance (recent swing high and a bearish order-block area).
Farther above, 3470–3485 is a major resistance cluster (around prior highs and a 61.8% extension), where supply may re-emerge.
Key Zones (4H Chart)
Buy Zone 1 (Demand): 3380–3400. This zone acted as support on prior pullbacks and aligns with ~50%–62% Fibonacci retracement levels. It represents a demand area (many buy orders), so bounces are likely here.
Buy Zone 2 (Support): 3330–3350. A deeper support area where buyers piled in previously. It coincides with the 61.8% Fib retrace of the last leg, making it a strong multi-purpose support/demand zone.
Sell Zone 1 (Supply): 3420–3435. This marks the recent 4H swing high and a potential bearish order block.
It has already capped rallies, so price may stall or reverse here on a retest.
Sell Zone 2 (Resistance): 3470–3485. A higher cluster of resistance (major psychological level and Fib extension) where selling could appear if gold extends its rally. This is a logical profit-taking area.
Each of these zones is a range (not just a line) to allow for some trade flexibility. We watch for price action (like pin bars or breakouts) within these ranges to signal entries.
1H Chart: Trade Setups
Buy at 3385–3395 (Long).
Entry Zone: 3385–3395 (just above the lower demand zone).
Stop-Loss: ~10 USD below the zone (around 3375).
Take-Profit: 3420 (minor resistance) and 3460 (next supply cluster).
Reason: This zone combines the 4H demand area and ~50% Fib support.
We expect bulls to defend this zone.
Trigger: Wait for a bullish reversal candle on 1H (e.g. a strong bullish pin bar or engulfing candle with a long lower wick). Such a candle (long-tail wick) at support indicates a liquidity grab by buyers. Alternatively, a clear 1H BOS above the last minor swing high would confirm strength and serve as a breakout entry.
Buy on 3425–3430 breakout (Long).
Entry Zone: Break above 3425–3430 (just above the recent 4H high).
Stop-Loss: ~10 USD below entry (around 3415).
Take-Profit: 3480–3490 (next resistance zone).
Reason: A push through the 3420–3435 supply zone would show buyers overcoming sellers. This would keep the uptrend running. The breakout opens room toward the 3470–3485 resistance area.
Trigger: Enter on a 1H bullish breakout/close above 3430 (a new higher high) – i.e. a bullish BOS confirming continued uptrend. Optionally look for a pullback to 3425 as a retest entry if the breakout is swift.
Buy at 3330–3340 (Long).
Entry Zone: 3330–3340 (deeper support zone on 4H).
Stop-Loss: ~10 USD below the zone (around 3320).
Take-Profit: 3380 (first target), then 3420.
Reason: This is a strong support/demand area (4H 61.8% Fib support). A drop here would be a deeper pullback – a higher-risk entry with a bigger reward if buyers step in.
Trigger: Look for a clear bullish reversal on 1H (e.g. hammer/engulfing candle) or a shift in structure (price fails to make a new low and instead forms a higher low). A bullish candlestick in this zone implies demand is defending it.
Each setup is aligned with the 4H bullish bias (we’re looking for long opportunities at support zones or breakouts). The ~$10 stops are set just beyond the defined entry zone, giving each trade a favorable risk/reward.
Takeaway: Gold’s 4-hour trend is up. We favor buying near the identified demand/support zones (or on a confirmed breakout above recent highs) and targeting the next resistance levels. Use tight stops (~$10 beyond each zone) and aim for 2:1+ reward on these high-probability setups.
Trade with the trend and respect the key zones above.

Geopolitical conflict re-emerges, price points to 3500?Information summary:
The powder keg of the Middle East situation exploded. A new round of fierce fighting between Israel and Iran has pushed the global financial market into a risk-averse storm. In just one day, gold soared. In the early Asian session on Monday, the price of gold was unstoppable, hitting a nearly seven-week high of $3451/ounce. Under the dark clouds of geopolitical conflict, gold bulls are in full swing, and the $3500 mark seems to be within reach.
In addition, the market will face two major tests this week: the monthly rate of US retail sales and the highly anticipated Federal Reserve interest rate decision.
Technical analysis:
At the daily level, the MA10, MA7, and MA5 moving averages are diverging upward, the RSI indicator turns upward, and the gold price is running steadily in the upper and middle track area of the Bollinger band. In the four-hour cycle, the moving average forms a golden cross arrangement and the opening continues to expand. The price continues to rise along the MA10 daily moving average, and the Bollinger band also maintains an upward opening shape.
The current market is dominated by geopolitical risks in the Middle East, and the gold price is consolidating at a high level. If the situation does not change, the gold price will most likely remain above $3,400 today, and it is even very likely to refresh the historical high of $3,500 today and tomorrow. Therefore, before the trend changes, the long strategy is still the best choice.
Operation strategy;
Buy near 3420, stop loss 3410, target 3460-3470.

Everybody loves Gold Part 4Gold strategy steadily churning out the pips
Here's a breakdown of trading dynamics:
1. Expecting price to break past for continuation up
2. Price might bounce back for which; will be looking for a continuation from -50/-100 or -150pips to the upside
3. Will be looking for double tops/bottom along the way
As always price action determines trades.

Gold (XAUUSD) – Lower TF Wave (B) Top in Place? Higher TF Conflu⚠️ Price has now completed what appears to be a clean 5-wave advance into the key supply zone — potentially completing wave ((C)) of (B) on the lower timeframe.
• Wave ((ii)) = expanding flat
• Wave ((iv)) = expanding triangle
• Final ((v)) push into supply with RSI/MACD divergence
A breakdown below 3435 could confirm the reversal into wave (C). Downside fib targets align around 3400, 3350, and 3280.
A marginal high can’t be ruled out, but structure is now favouring bears short term.

GOLD OPENS BULLISHJust as analysed, there was a strong bullish setup at the close of last week so this move was just taking out top liquidity, continuing its course of bullish rally. We can also spot a bullish trend build up from the 3400's which projected to the 3450's before making its retracement last week.
we expect Gold to go for more higher liquidity as we are close to the ATH, in other words; ROAD TO 3500'S as a visible path has been analysed

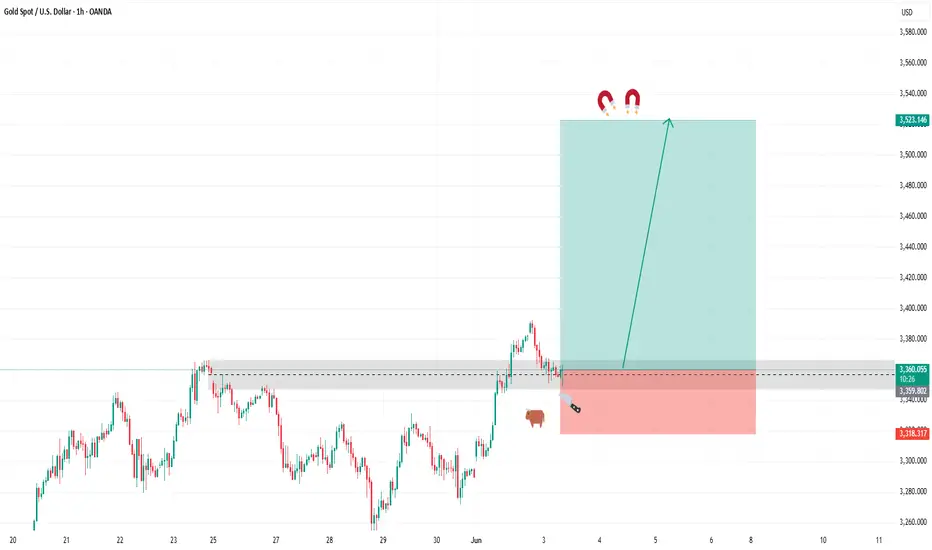
BULLISH GOLDIn todays session we are adding more buys to our initial bias on bullish gold heading for new highs. Our entry is at 3360.84 tp new highs of 3523.15 and stop for this one is 3318. Adjust your positions according to your risk management. Use proper money management. Best of luck
Watch for price action near the upper resistance and trendline.XAUUSD (Gold vs USD) 1H chart analysis:
📊 XAUUSD 1H Technical Analysis Overview:
The chart shows a clear ascending channel pattern, indicating a short-term bullish trend. Price action is currently respecting the channel boundaries well.
🔹 Key Highlights:
Support Zone: The green horizontal zone around 3,310 – 3,330 represents a strong demand area where price previously reversed.
Resistance Zone: The upper green box near 3,460 – 3,470 marks a significant supply area where potential selling pressure could emerge.
Current Position: Price is trading near the mid-to-upper range of the ascending channel, showing bullish momentum.
🔀 Projection:
Two potential scenarios are outlined:
Bullish Continuation: Price may continue to respect the channel and push towards the resistance zone before reacting.
Bearish Reversal: If price fails to break higher and shows weakness, a breakdown below the channel could lead to a sharp move toward the lower demand zone (3,310 area).
📌 Outlook: Watch for price action near the upper resistance and trendline. A break above may lead to further gains, while rejection or bearish candlestick patterns could confirm a potential reversal setup.

BTC update!!Good day traders, here is another update on BTC and I have adjusted my narrative but my overall bias is still remaining bearish…

Natural Gas | Oil | Dollar | Silver | Gold Price Forecast.Natural Gas | Oil | Dollar | Silver | Gold Price Forecast.
COMEX:SI1! COMEX:GC1! NYMEX:CL1! AMEX:UNG

Gold Eyes ATH Amid Escalating Geopolitical TensionsGOLD – OVERVIEW
Commodities, particularly gold, are experiencing strong bullish pressure due to escalating tensions between Israel and Iran. With no signs of negotiation or de-escalation, the ongoing conflict continues to fuel safe-haven demand. As long as geopolitical risks remain elevated, bullish momentum in commodities is expected to persist.
Technical Outlook:
Gold maintains a bullish structure as long as it trades above 3404. Holding above this level supports a continuation toward the ATH at 3486, with potential extensions to 3529 and 3560. A retest of the 3404 support remains possible, and an opening gap toward 3486 cannot be ruled out. Overall, the prevailing trend remains upward.
A bearish scenario would only be valid if tensions in the Middle East ease significantly or if negotiations between Israel and Iran begin.
Key Levels:
• Pivot: 3431
• Resistance: 3486, 3529, 3560
• Support: 3404, 3381, 3347

Turbulent Week Ahead? Gold Outlook June 9-13, 2025Hey fellow traders,
Let's dive into the OANDA:XAUUSD outlook for the upcoming week, June 9-13, 2025. The recent price action has been a rollercoaster 🎢, and the next few days promise even more fireworks 🎇.
Looking back at the 30-minute chart from May 22 to June 6, gold saw an initial consolidation, then a strong rally to multi-week highs near 3,420. However, this was followed by a sharp, dramatic reversal, pushing prices back below 3,300. This "bull trap" 🐂 pattern suggests underlying weakness and potential preemptive market positioning.
Another view on this could be the possibility that a gap on the chart at 3300-3295 of around $5 could get closed. Since strong support is right below this, it could serve as a good launchpad 🚀 for an upward rally. Let's see if the upcoming Asia session on Monday triggers this because its only - $14 from $3309.
Key Drivers for the Week Ahead:
📅 June 9, 2025 (Monday)
US-China High-Level Trade Talks Commence in London
High-level delegations from the United States and China began trade discussions in London. This meeting followed an announcement by President Donald Trump on Friday, June 6, 2025, who described a preceding 90-minute phone call with Chinese President Xi Jinping as "very positive".
The US delegation included Treasury Secretary Scott Bessent, Commerce Secretary Howard
Lutnick, and US Trade Representative Jamieson Greer, reflecting a coordinated approach to addressing complex trade issues. The talks were primarily aimed at resolving the ongoing bilateral trade war, with a particular focus on tariffs and the global supply of critical rare earth minerals.5 While no specific time for the commencement of talks was provided, it is understood they began during London's daytime, approximately (10:12 CEST / 04:12 EDT).
These discussions occurred in the context of a temporary 90-day agreement reached on May 12, 2025, which had seen the US reduce its tariffs on Chinese imports from 145% to 30%, and China reciprocate by lowering its tariffs on US goods from 125% to 10%.9 However, this temporary truce is set to expire in early August, and President Trump had recently accused China of violating the agreement, specifically regarding critical mineral exports. The broader bilateral relationship remains strained by issues extending beyond tariffs, including restrictions on advanced chips, student visas, and concerns over China's state-dominated economic model.
The prompt scheduling of these high-level talks immediately after a leader-to-leader call suggests a tactical move towards de-escalation of immediate trade tensions, aiming to prevent a full-blown trade war. The objective appears to be managing current conflicts rather than achieving a fundamental resolution, especially with the May 12 agreement nearing its expiration. The core disputes, such as control over rare earths and technology, are deeply entrenched and reflect a broader geopolitical competition rather than mere economic disagreements. This pattern of temporary de-escalation followed by persistent underlying tensions indicates a long-term,structural competition. It suggests that trade policy is increasingly intertwined with national security and geopolitical strategy, implying that businesses should anticipate continued volatility and strategic decoupling in certain sectors, rather than a return to pre-trade war normalcy.
Other big movers for gold will be the US inflation reports. 💥
📅 Wednesday, June 11 (14:30 CEST / 08:30 EDT):
We get the crucial US Consumer Price Index (CPI) data.
Watch for Core CPI (YoY) with a forecast of 2.9% and headline CPI (YoY) at 2.5%.
📅 Thursday, June 12 (14:30 CEST / 08:30 EDT):
The US Producer Price Index (PPI) follows.
Forecasts are for Core PPI (YoY) at 3.0% and headline PPI (YoY) at 2.6%.
📊 These numbers are critical. If inflation comes in hotter 🔥 than expected, it will likely strengthen the US Dollar 💵 and push real interest rates higher 📈, making gold less attractive. This could trigger further declines 📉, especially given the current market structure. Conversely, cooler 🧊 inflation could spark a significant rebound 🔄.
Beyond US data, keep an eye 👁️ on speeches from various European Central Bank (ECB) officials throughout the week, including President Lagarde on Tuesday (23:15 CEST / 17:15 EDT). Their collective tone 🎤 could influence EUR/USD dynamics and indirectly impact the US Dollar Index, offering a counterbalance ⚖️ or amplification to gold's movements.
Key Numbers and Technical Levels to Watch:
Gold is currently sitting on a substantial speculative net long position of 187.9K contracts. This is a massive amount of bullish bets 📊🐂, making gold highly vulnerable to rapid liquidation 💣 if the fundamental picture turns sour. A "long squeeze" could amplify any downside move.
Immediate Support: The 3,300 level is paramount. A decisive break below it would signal further weakness. Below that, 3,250 is strong technical support where we saw a bounce previously.
Overhead Resistance: Look for resistance at 3,350-3,360, and then the recent peak of 3,420. Reclaiming these levels would require a significant shift in sentiment.
Expect high volatility ⚡, especially around the US inflation releases. Trade smart 🧠, manage your risk ⚖️, and stay nimble! 🏃
Geopolitical News Landscape 🌍
India / Pakistan
The ceasefire from May 10 is holding, but diplomatic relations remain frosty. India has launched a global image campaign to gain support, while Pakistan insists on dialogue and accountability.
Outlook: Without substantial agreements on border terrorism and water issues, tensions will stay latently high, with potential for new escalation risks. ⚠️
Gaza Conflict
Violence escalated again in early June. Israel intensified attacks, killing civilians seeking aid in Gaza City, and at least six people were killed at a distribution point.
Outlook: The humanitarian situation continues to worsen 🚨, and international mediation efforts are urgently needed. However, an immediate ceasefire seems unrealistic. ❌
Russia / Ukraine
In the first week of June, Russia launched one of its largest series of attacks: hundreds of drones and missiles hit Kharkiv and Kyiv, resulting in civilian casualties. Simultaneously, a planned prisoner exchange has stalled.
Outlook: Strategic air attacks will likely continue 💥, and the prisoner exchange remains deadlocked. Without a diplomatic initiative, the conflict will stay entrenched. 🕳️
U.S.–China Trade War
Following talks between Trump and Xi, new negotiation rounds are expected in London. China has opened up rare earth exports, a sign of cautious de-escalation.
Outlook: If dialogue channels open 🗣️, systemic trust could grow, but genuine reforms remain uncertain. 🤔
🌐 Global Trade War
The OECD has lowered its growth outlook to 2.9%, warning of protectionism 🧱 and delayed investments. The ECB is also maintaining synchronization with the FED.
Outlook: Without de-escalation, the world faces a global economic slowdown 🐌 and permanent fragmentation of supply chains. 🔗
🏛 Trump vs. Powell
Trump has again complained about the FOMC's hesitancy, nicknaming Powell “Too Late,” and demanding a full 1% interest rate cut.
Outlook: Pressure is mounting 📣. Whether the Fed yields depends on if inflation and labor data allow for a loose policy. 🎯
💵 U.S. Inflation – May 2025
Forward-looking data shows a weakening services sector and consumer prices rising again as tariffs pass through. Official CPI data for May 2025 will be released on June 11.
Outlook: Higher inflation could halt the Fed's "dereflexion" course — a dilemma ⚖️ between growth 📈 and price stability. 🛑
Technical View 📐
Regarding the major Head and Shoulders (H&S) reversal pattern on the 4H chart I shared previously, I'd like to explain some new developments that are altering its potential outcome.
Since the price has re-entered and fallen below the neckline, I activated my "second brain cell" 🧠 to guess what could be next. This led me to revise the larger 4-hour chart structure with the adjustments shown in the accompanying image.
As you can also see in the updated version below, a reversed H&S pattern remains a possibility, as the proportions still appear valid. 🔄
Potential Scenarios for Gold 🧩
Under this revised idea, Gold could potentially reach the neckline entry at 3397 (+88) from the current price. This is one plausible scenario. ✅
Alternatively, the price could drop further to the "Head" at 3120 (-191 from the current 3309), which would, of course, invalidate this H&S pattern. ❗
While this is speculative 🔮, given that trading often involves psychological movements and their resulting impacts, I believe this is a favorable approach to forecasting.
Another reason to see it as bullish is the formed standard bull flag 🚩🐂.
Please take the time to let me know what you think about this. 💬
-------------------------------------------------------------------------
This is just my personal market idea and not financial advice! 📢 Trading gold and other financial instruments carries risks – only invest what you can afford to lose. Always do your own analysis, use solid risk management, and trade responsibly.
Good luck and safe trading! 🚀📊

Gold is in the bullish direction after correcting the supportHello Traders
In This Chart GOLD HOURLY Forex Forecast By FOREX PLANET
today Gold analysis 👆
🟢This Chart includes_ (GOLD market update)
🟢What is The Next Opportunity on GOLD Market
🟢how to Enter to the Valid Entry With Assurance Profit
This CHART is For Trader's that Want to Improve Their Technical Analysis Skills and Their Trading By Understanding How To Analyze The Market Using Multiple Timeframes and Understanding The Bigger Picture on the Charts

EURUSD ||| '' W '' PATTERN IDENTIFIED . ✅ Harmonic Formation (Bearish Potential)
⚠️ Selling Bias forming soon
---
🧩 Pattern Breakdown:
A Bearish Harmonic Pattern (likely Butterfly or Deep Crab) has been identified and is now nearing completion at the D point.
Current price is approaching key resistance / reversal zone, precisely around the 0.786 - 0.886 fib area (highlighted red).
The Risk-to-Reward is clearly mapped:
🔺 Stop Loss: 1.19405
✅ Entry Zone: Around 1.17106
🎯 Target: 1.09588
Potential short setup if price respects the harmonic symmetry and fails to break above resistance.

Risk aversion escalates, prices continue to rise?Information summary:
On the last trading day of last week, gold rose again under the stimulation of risk aversion. The gold market is shrouded in risk aversion in the Middle East. In the short term, the trend of gold is still supported by risk aversion and may continue to rise. At present, the relationship between Israel and Iran has not been eased; there is the latest news: Iran may retaliate against the air strikes it suffered this time. This will provide momentum for the rise of gold.
Market analysis:
Gold 1 hour shows that the moving average forms a golden cross and diverges upward, and the bullish trend of gold is still there. After the rise of gold risk aversion, gold has adjusted sideways in the short term, but it is still oscillating strongly at a high level; it is still in the process of rising. The short-term fluctuation of gold is the adjustment in the process of rising, and it will continue to rise at any time. After the gold bulls broke through 3400, they have been stabilizing above this position, so the strategy for next week is still to buy on dips.
However, it should be noted that if the international situation suddenly changes, the price may not fall back, but directly rush to a new high.
In addition, if the international situation eases and falls below 3400, we must adjust the operation strategy in time to avoid losses.
Important positions:
Resistance levels: 3450, 3475, 3490
Support levels: 3410, 3400, 3380
Operation strategy:
Buy near 3410, stop loss at 3400, win range above 3450 points.
There are still 7 hours left before the Asian market opens. I hope my analysis can help all traders gain something in the gold market.
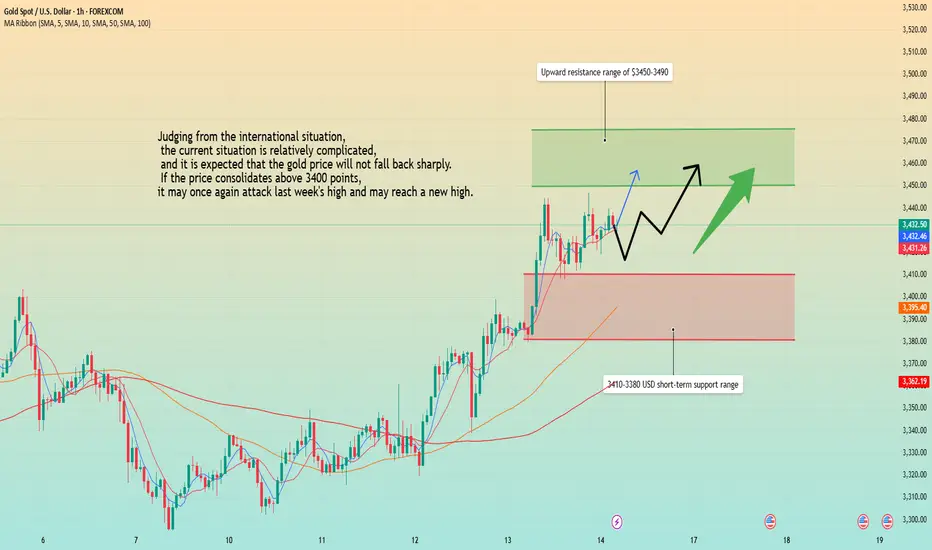
The Critical Resistance of Gold at 3500!
The probability of a higher opening for gold next week is relatively high, but I hold a high degree of skepticism towards its sustainability. After three days of fermentation, relevant parties have exhausted all available measures. If there is a higher opening on Monday, chasing the trend is not recommended. The pressure reference for the market in the early week is at the 3462/72 level. From the perspective of the upward channel trend that started from 3200, as long as it does not gap up directly above 3462/72, even if the price touches this area, it will face certain suppression. If it gaps up strongly above 3472 and has a wave of continuation, the previous high of 3500 will also be difficult to break through - at least from the current technical perspective, an optimistic expectation of breaking through 3500 cannot be formed. The most critical influence next week will still be the Fed's speech on Thursday, and the core time point for whether the market can truly break through 3500 will be at that time.
The key support level next week is viewed at 3400. The current price has broken through and stabilized above 3400, and it is expected to operate above this level for a period of time. When the market first pulls back to test around 3400, buying can be continued. Through cycle operation judgment, a high-level consolidation market in the 3500/3400 range is highly likely to form
Humans need to breathe, and perfect trading is like breathing—maintaining flexibility without needing to trade every market swing. The secret to profitable trading lies in implementing simple rules: repeating simple tasks consistently and enforcing them strictly over the long term.
Trading Strategy:
buy@3410-3420
TP:3460-3470

"Due to the economic crisis, the gold market may open with a gap"Due to the economic crisis, the gold market may open with a gap tomorrow."
This upward trend is attributed to increased demand for gold as a safe-haven asset amid geopolitical uncertainties. The conflict has also led to a spike in oil prices and a decline in global stock markets, further enhancing gold's appeal .

XAUUSD Analysis todayHello traders, this is a complete multiple timeframe analysis of this pair. We see could find significant trading opportunities as per analysis upon price action confirmation we may take this trade. Smash the like button if you find value in this analysis and drop a comment if you have any questions or let me know which pair to cover in my next analysis.

XAUUSD BULLISH OR BEARISH DETAILED ANALYSISGold (XAUUSD) continues to maintain strong bullish momentum, with current price action sitting around 3,430. We have been holding a bullish outlook since the key accumulation zone between 3,150 and 3,200. Price has consistently formed higher highs and higher lows, and recent consolidation has broken out with conviction. Based on technical structure, my immediate upside target is 3,500, where I expect price to react before potentially extending even higher depending on upcoming macro drivers.
Fundamentally, gold is being fueled by a combination of sticky inflation data and a cautious Fed stance. Even though the FOMC held rates steady in June, market expectations are shifting towards policy easing later in the year due to softening labor data and a cooling economic outlook. Additionally, geopolitical uncertainties and continued central bank gold buying remain strong tailwinds for the metal. The U.S. dollar index has shown minor weakness post-CPI, offering further support to gold bulls.
Technically, the daily chart shows a clean bullish flag breakout that aligns with the trendline support and impulsive wave structure. Price broke above 3,400 with strong volume and minimal resistance, indicating clear bullish dominance. As long as price holds above the 3,380–3,400 zone, continuation toward 3,500 remains highly probable. There is also confluence from previous structure highs and minor Fibonacci extension levels around that mark.
Overall, I remain confidently long on XAUUSD. I’ve been tracking this bullish cycle since the 3,150–3,200 region and continue to favor upside moves backed by macroeconomic and technical alignment. I’ll be watching key reaction zones near 3,500 for potential profit-taking, while holding swing positions with dynamic risk management in place.

Unlock Gold's Secrets: A Daily Tape Reading Analysis for XAUUSDHey everyone! Today,
we're diving deep into XAUUSD (Gold) using a daily candle tape reading approach that aims to uncover critical turning points and price levels. If you're looking for an edge in understanding Gold's movements, this analysis could be a game-changer.
On the accompanying chart, you'll see yellow horizontal lines that highlight key bullish and bearish price levels. These aren't just arbitrary lines; they represent significant battlegrounds where buyers and sellers have historically shown their hand.
In addition, the vertical lines on the chart pinpoint specific days where we've observed a change in trade direction or a potential reversal. It's important to note that these shifts can sometimes occur within one or two candles before or after the marked day, so keep an eye on the immediate vicinity.
We're interpreting these price levels with a 3% to 5% tolerance, allowing for the natural ebb and flow of the market around these crucial points.
Key Price Levels to Watch:
Bullish Price Levels:
3477.67: A critical zone where bullish momentum has historically taken hold.
3522.40: Another strong support level that could propel Gold higher.
3562.30: Watch this level for signs of continued upward pressure.
3631.31: A significant resistance-turned-support level that could signal a strong bullish continuation.
Bearish Price Levels:
3323.72: A key level where bearish pressure has often intensified.
3245.09: If this level breaks, it could indicate further downside for Gold.
3165.42: A crucial support level; a breach here could accelerate a downtrend.
3077.23: The ultimate test for the bears; a break below could signal a more substantial correction.
__________________________________________________________________________________
What are your thoughts on these levels? Have you noticed similar patterns in your own XAUUSD analysis? Share your insights in the comments below!
⚠️ Disclaimer: This post is educational content and does not constitute investment advice, financial advice, or trading recommendations. The views expressed here are based on technical analysis and are shared solely for informational purposes. The stock market is subject to risks, including capital loss, and readers should exercise due diligence before investing. We do not take responsibility for decisions made based on this content. Consult a certified financial advisor for personalized guidance
