4-Hour Analysis for XAUUSD (14 June 2025)4-Hour Analysis: The Bigger Picture
Price Action & Market Structure
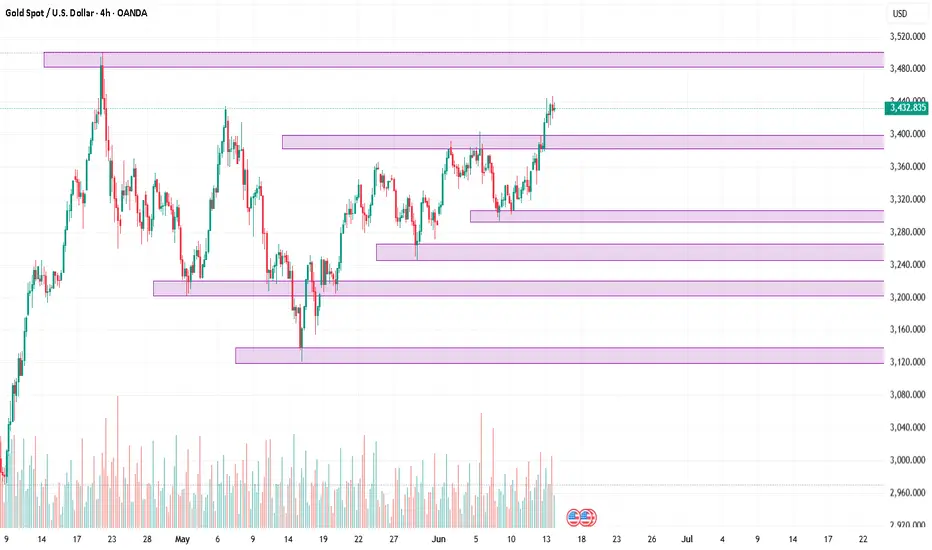
Current price is at $3432.835.
The market has printed a higher high above the previous swing at ~$3425.
Last Break of Structure (BOS): Occurred to the upside at ~$3412.
Recent CHoCH (Change of Character): None yet to the downside—bullish structure still intact.
Conclusion: Bullish Market Structure is dominant.
Fibonacci Levels
Measured from the swing low at $3362 to the recent swing high at $3437:
38.2% retracement: ~$3410
50% retracement: ~$3399
61.8% retracement: ~$3388
These are our retracement zones where demand is likely to step in.
Smart Money Key Concepts
Imbalance: Clean imbalance exists between $3408–$3415.
Bullish Order Block (OB): 4H candle at $3394–$3402
Liquidity Grab: Sweep below $3411 (old low) before reversal signals smart money accumulation.
Premium/Discount Zone: Current price is above 50% of last impulse → In premium zone (better to look for sells here until retracement).
Key Zones (Interaction Points)
Buy Zone Cluster (Discount Price)
Zone A (OB + 61.8% + Liquidity Pool) → $3385–$3402
Zone B (Imbalance + Fib 50%) → $3408–$3415
Sell Zone Cluster (Premium Price) – for retracements
Zone C (Last Supply + Swing Highs) → $3437–$3445
Zone D (Rejection Block + Liquidity Above) → $3455–$3462
4-Hour Bias: Bullish
We are in a bullish continuation phase. Ideal trades are buys from demand zones, aiming for new highs or liquidity sweeps above swing points.
Zoom-In: 1-Hour Chart – Trade Setups
Setup 1: Buy from Demand + OB Reaction
Entry Zone: $3394–$3402
Direction: Buy
Stop-Loss: $3384
Take Profit 1: $3430
Take Profit 2: $3445
Trigger Condition: Bullish engulfing or bullish BOS on 15-min chart after liquidity grab into the zone.
Reason: Overlap of OB, 61.8% fib, and clean liquidity pool below $3400.
Setup 2: Buy from Imbalance Tap
Entry Zone: $3408–$3415
Direction: Buy
Stop-Loss: $3398
Take Profit 1: $3432
Take Profit 2: $3440
Trigger Condition: CHoCH on 15m with FVG fill (imbalance closes with bullish follow-through).
Reason: Bullish continuation with low-risk entry within imbalance zone and close to 50% fib retracement.
Setup 3: Short from Supply Zone for Retracement
Entry Zone: $3455–$3462
Direction: Sell
Stop-Loss: $3472
Take Profit 1: $3432
Take Profit 2: $3415
Trigger Condition: Bearish engulfing or 1H CHoCH inside the zone.
Reason: Price likely to grab liquidity above highs before retracing; this is a countertrend scalp within premium pricing.
Final Takeaway:
“Stay bullish on Gold while it’s above $3394—but let price correct into demand before looking to join the trend.”
Xauusd(w)
Intraday Gold Trading System with Neural Networks: Step-by-Step________________________________________
🏆 Intraday Gold Trading System with Neural Networks: Step-by-Step Practical Guide
________________________________________
📌 Step 1: Overview and Goal
The goal is to build a neural network system to predict intraday short-term gold price movements—typically forecasting the next 15 to 30 minutes.
________________________________________
📈 Step 2: Choosing Indicators (TradingView Equivalents)
Key indicators for intraday gold trading:
• 📊 Moving Averages (EMA, SMA)
• 📏 Relative Strength Index (RSI)
• 🌀 Moving Average Convergence Divergence (MACD)
• 📉 Bollinger Bands
• 📦 Volume Weighted Average Price (VWAP)
• ⚡ Average True Range (ATR)
________________________________________
🗃 Step 3: Data Acquisition (Vectors and Matrices)
Use Python's yfinance to fetch intraday gold data:
import yfinance as yf
import pandas as pd
data = yf.download('GC=F', period='30d', interval='15m')
________________________________________
🔧 Step 4: Technical Indicator Calculation
Use Python’s pandas_ta library to generate all required indicators:
import pandas_ta as ta
data = ta.ema(data , length=20)
data = ta.ema(data , length=50)
data = ta.rsi(data , length=14)
macd = ta.macd(data )
data = macd
data = macd
bbands = ta.bbands(data , length=20)
data = bbands
data = bbands
data = bbands
data = ta.atr(data , data , data , length=14)
data.dropna(inplace=True)
________________________________________
🧹 Step 5: Data Preprocessing and Matrix Creation
Standardize your features and shape data for neural networks:
from sklearn.preprocessing import StandardScaler
import numpy as np
features =
scaler = StandardScaler()
data_scaled = scaler.fit_transform(data )
def create_matrix(data_scaled, window_size=10):
X, y = ,
for i in range(len(data_scaled) - window_size - 1):
X.append(data_scaled )
y.append(data .iloc )
return np.array(X), np.array(y)
X, y = create_matrix(data_scaled, window_size=10)
________________________________________
🤖 Step 6: Neural Network Construction with TensorFlow
Use LSTM neural networks for sequential, time-series prediction:
import tensorflow as tf
from tensorflow.keras.models import Sequential
from tensorflow.keras.layers import LSTM, Dense, Dropout
model = Sequential( , X.shape )),
Dropout(0.2),
LSTM(32, activation='relu'),
Dense(1)
])
model.compile(optimizer='adam', loss='mse')
________________________________________
🎯 Step 7: Training the Neural Network
history = model.fit(X, y, epochs=50, batch_size=32, validation_split=0.2)
________________________________________
📊 Step 8: Evaluating Model Performance
Visualize actual vs. predicted prices:
import matplotlib.pyplot as plt
predictions = model.predict(X)
plt.plot(y, label='Actual Price')
plt.plot(predictions, label='Predicted Price')
plt.xlabel('Time Steps')
plt.ylabel('Gold Price')
plt.legend()
plt.show()
________________________________________
🚦 Step 9: Developing a Trading Strategy
Translate predictions into trading signals:
def trade_logic(predicted, current, threshold=0.3):
diff = predicted - current
if diff > threshold:
return "Buy"
elif diff < -threshold:
return "Sell"
else:
return "Hold"
latest_data = X .reshape(1, X.shape , X.shape )
predicted_price = model.predict(latest_data)
current_price = data .iloc
decision = trade_logic(predicted_price, current_price)
print("Trading Decision:", decision)
________________________________________
⚙️ Step 10: Real-Time Deployment
Automate the model for live trading via broker APIs (pseudocode):
while market_open:
live_data = fetch_live_gold_data()
live_data_processed = preprocess(live_data)
prediction = model.predict(live_data_processed)
decision = trade_logic(prediction, live_data )
execute_order(decision)
________________________________________
📅 Step 11: Backtesting
Use frameworks like Backtrader or Zipline to validate your strategy:
import backtrader as bt
class NNStrategy(bt.Strategy):
def next(self):
if self.data.predicted > self.data.close + threshold:
self.buy()
elif self.data.predicted < self.data.close - threshold:
self.sell()
cerebro = bt.Cerebro()
cerebro.addstrategy(NNStrategy)
# Add data feeds and run cerebro
cerebro.run()
________________________________________
🔍 Practical Use-Cases
• ⚡ Momentum Trading: EMA crossovers, validated by neural network.
• 🔄 Mean Reversion: Trade at Bollinger Band extremes, validated with neural network predictions.
• 🌩️ Volatility-based: Use ATR plus neural net for optimal entry/exit timing.
________________________________________
🛠 Additional Recommendations
• Frameworks: TensorFlow/Keras, PyTorch, scikit-learn
• Real-time monitoring and risk management are crucial—use volatility indicators!
________________________________________
📚 Final Thoughts
This practical guide arms you to build, deploy, and manage a neural network-based intraday gold trading system—from data acquisition through backtesting—ensuring you have the tools for robust, data-driven, and risk-managed trading strategies.
________________________________________

EUR/USD Bulls in Control... But the Trap Is Set at 1.1600? 🇺🇸 EUR/USD – Technical & Macro Outlook
EUR/USD has posted an impressive rally over the past few weeks, driven by a combination of technical and macro factors. It is currently trading around 1.1586, right at the edge of a major supply zone where previous sharp rejections and reversals have taken place.
🔍 Technical Analysis
Price action remains within a well-defined ascending channel that began in mid-April, fueling the bullish move from the 1.07 lows.
The current daily candle is showing signs of exhaustion within the 1.1550–1.1600 resistance zone, with upper wicks and declining volume.
RSI is in a high-neutral zone but not yet overbought, leaving room for more upside — but also increasing the probability of a technical pullback.
🔁 Key Levels:
Primary resistance: 1.1600 (multi-touch supply area)
Support 1: 1.1460–1.1430 (previous resistance, now potential support)
Support 2: 1.1300–1.1270 (demand zone + channel base)
📉 COT Report – June 3, 2025
Non-Commercials (speculators) remain net-long with over 200,000 contracts, though both long (-1,540) and short (-4,830) positions saw reductions. This suggests a bullish structure with early signs of profit-taking.
Commercials are heavily net-short, with 575,000 short contracts versus 437,000 long — a structurally bearish stance from physical market participants.
Open interest increased significantly by +20,813, pointing to renewed speculative participation and potential volatility.
🧭 Retail Sentiment
Retail traders are heavily short (80%) with an average entry around 1.1253.
This contrarian behavior is typically supportive of continued upside pressure — especially if price holds above key supports.
📅 Seasonality – June
Historical averages over 10, 15, and 20 years show a slightly bullish tendency in June.
The 2- and 5-year patterns suggest more neutral to mildly bearish behavior.
This supports a consolidation or corrective pullback, without ruling out higher moves during the summer rally.
🎯 Trading Conclusion
Current bias: Moderately bullish, with rising pullback risks near 1.1600
Possible setup: Tactical short between 1.1580–1.1610 if confirmed by bearish price action
Target: 1.1430–1.1300
Bullish scenario remains valid unless we break below 1.1270
📌 Summary
The bullish trend is strong but technically extended. Speculative positions remain net-long but are starting to unwind. The retail crowd is still betting against the move, which favors bulls. However, structural resistance calls for caution — a pullback could be imminent.

Massive GBP/USD Reversal Ahead? Head & Shoulders FormationGBP/USD is at a critical technical juncture following a sharp bullish impulse that pushed the pair above the 1.34 handle, printing a strong weekly bullish engulfing candle and breaking out of a multi-week consolidation zone. This move unfolded in a macro context where the U.S. Dollar Index (DXY) is showing clear signs of weakness, with Non-Commercial net long positions dropping drastically—from around 20,000 to less than 5,000 contracts. This shift points to a fading speculative appetite for the dollar, historically a leading indicator of upcoming corrective phases or broader declines in the DXY.
On the flip side, the Commitments of Traders (COT) report on the British Pound reveals that Non-Commercials (typically hedge funds and asset managers) remain net long on GBP, with a slight increase week-over-week. However, Commercials (generally institutions and hedgers) have aggressively built up a significant net short position—levels that in the past preceded major reversals on the pair. This divergence between speculators and institutional hedgers suggests short-term bullish potential, but with rising risk of exhaustion near current resistance levels.
Adding fuel to this outlook is the retail sentiment: approximately 63% of retail traders are currently short GBP/USD, with an average entry price around 1.3021. This kind of retail crowd positioning, typically inefficient from a historical perspective, adds contrarian support for further upside, as long as price holds above the 1.3340 structure.
From a seasonality perspective, June tends to be a mildly bullish-to-sideways month for GBP/USD, especially when looking at the 10- and 15-year seasonal averages. While the seasonal bias is not particularly strong, there’s also no statistical downward pressure this time of year, leaving room for technically-driven moves influenced by liquidity and sentiment rather than macro patterns alone.
On the technical front, the daily chart shows a steep rally capped by a large green candle on Monday, breaking cleanly through the 1.34 resistance zone. The price is now hovering inside a key supply area between 1.3499 and 1.3550—a historically reactive zone that has triggered major rejections in previous months. How price reacts here will likely shape the next major swing. A confirmed breakout and consolidation above 1.3550 would open the door for an extension toward 1.37–1.3750. Conversely, a sharp rejection followed by a break below 1.3412—and especially under 1.3340—would set the stage for a deeper correction toward 1.3170.
The RSI is currently showing early signs of momentum loss, although no strong bearish divergence has emerged yet. This implies that the pair could still fuel another push higher before running out of steam—possibly forming the right shoulder of a head & shoulders pattern if the rejection scenario plays out.

GBPJPY At the Top? Massive Liquidity Grab📈 1. Price Action & Key Technical Levels (Daily Chart)
Price reached a major supply zone between 196.0 and 197.0, showing clear rejection (weekly pin bar and a lower high structure relative to the previous peak).
The long-term descending trendline acted as resistance again.
A confirmed rising wedge pattern broke to the downside, with first target around 191.4, and extended target near 187.4 (key demand zone with historical confluence).
Weekly RSI shows a bearish divergence vs price highs – an additional signal of bullish exhaustion.
📊 2. COT Data (as of June 3, 2025)
GBP (British Pound)
Net long positions increased by +30,371 contracts (Commercial + Non-Commercial).
Non-Commercials: 103,672 long vs 68,457 short → net long +35,215 but the increase is relatively modest.
Commercials are increasing both long and short positions, but the net delta supports medium-term GBP resilience.
JPY (Japanese Yen)
Net short worsened by -13,566 contracts.
Non-Commercials are cutting longs and adding shorts → aggressive yen selling.
Commercials remain heavily short (275,659 vs 100,151 long).
➡️ COT Conclusion: GBP remains structurally strong, but the JPY is now extremely oversold, increasing the likelihood of a technical correction in favor of JPY (GBPJPY pullback).
📉 3. Retail Sentiment
72% of retail traders are short GBPJPY, with an average entry at 191.2.
Current price is above 195.8 → a liquidity sweep above retail shorts may have already occurred.
The order book shows a heavy sell cluster between 195.0–195.9 → potential zone of manipulation/liquidation.
➡️ Contrarian view: After sweeping liquidity above retail highs, we may now see downside pressure to clean out breakout longs.
📅 4. Seasonality
June tends to be neutral to bearish:
5-year average: +0.45% (weak gain)
10- and 15-year averages: -1.24% and -1.30%
Historically, the first 10 days of June often mark a local top, followed by a decline – consistent with the current price structure.
🧠 5. Macro-Technical Confluence
The broader setup points to a distribution phase between 195.5–196.5, with high probability of a technical pullback toward 193.5–191.4 in the short-to-medium term.
The yen's oversold conditions may ease temporarily, supporting a corrective GBPJPY retracement.
Break below 193.5 would confirm the move toward 191.4 and eventually 187.4 – an area of institutional interest.
🔍 Trade Setup Summary (Bias: Bearish)
Technical context: Short setup confirmed by structure break, divergence, and supply rejection.
Macro/sentiment context: Supports a corrective pullback on the pair.
Strategy: Look for intraday weakness below 195.0–194.5 → targeting 193.5, then 191.4.
Invalidation: Daily/weekly close above 197.0.

Gold Wave Analysis and OutlookHi Traders,
My technical analysis of OANDA:XAUUSD suggests we are currently in a corrective wave 2 pattern. This correction could take gold to the 1800-1780 region , likely around October 2023.
After wave 2 finishes, wave 3 has potential to break above 2000 and resume the larger bullish trend.
However, we need to see the correction play out first, so I don't anticipate a sustained upside move until after wave 2 completes.
For now, I'm cautious on new long positions in gold until we see signs of wave 2 bottoming out around 1780-1800. Once the correction finishes, I will look to go long for the next leg up towards 2000 (around 2300).
Let me know if you have any other opinion!

XAU/USD: Next Week's Trend Analysis and Trading SuggestionsI. Global Central Banks' Gold Purchases Continue to Support Long-Term Gold Uptrend
For instance, China's central bank has increased gold reserves for 7 consecutive months, India's gold reserve ratio has doubled compared to 2021, and countries like Thailand and Brazil followed suit in May. Central banks' gold buying, driven by reserve structure optimization and geopolitical risk hedging, provides long-term support for gold prices via sustained demand growth.
II. Technicals Show Intense Range Battle at $3,400 Key Level
Gold prices, after breaking through $3,400, are oscillating near $3,430. Short-term bulls dominate, but $3,450 acts as a significant resistance. The $3,400 level has turned into strong support— a breakdown could trigger pullbacks. While moving averages show a bullish alignment, overbought technical signals warrant correction vigilance.
III. Geopolitical Conflicts Escalate Sharply
Israel's precision strikes destroyed Iranian nuclear facilities and decapitated high-ranking officials, prompting Iran's immediate retaliation. With multiple Middle Eastern nations now involved, escalating geopolitical risks strongly underpin the rally in gold and crude oil.
Conclusion
Geopolitical tensions will sustain short-term upward momentum for gold, but investors must monitor Middle East developments and Fed policy shifts. Prudent position management based on risk tolerance is advised, with caution against excessive leverage in volatile markets.
Next Week's XAU/USD Trading Strategy
buy@3410-3420
tp:3440-3450
I am committed to sharing trading signals every day. Among them, real-time signals will be flexibly pushed according to market dynamics. All the signals sent out last week accurately matched the market trends, helping numerous traders achieve substantial profits. Regardless of your previous investment performance, I believe that with the support of my professional strategies and timely signals, I will surely be able to assist you in breaking through investment bottlenecks and achieving new breakthroughs in the trading field.

GOLD D1 Chart Shorter Term UpdateHello Traders,
Gold D1 Chart just shared with you with crucial zone for now GOLD is facing war scenarios and keep goin in Buy Direction further you may check Israel & Iran War updates time to time for the latest scenarios
All eyes on for now 3500 Psychological Level we may expect some selling from 3500 but keep in mind but if war scenarios gets heat up then GOLD will may rise towards 3600/3700 or 3800 Psychological Levels
for downside only if market breaks below 3400 Psychological then it will move towards 3350 or even 3300 Psychological Level
Disclaimer: Forex is Risky

Gold: silence on the charts—because the real money already movedThe gold market isn't reacting — it's confirming. The Israeli strikes on Iran? That’s the trigger. But the move started earlier. Price was already coiled, already positioned. All the market needed was a headline. And it got it.
Price broke out of the accumulation channel and cleared $3,400 — a key structural level that’s acted as a battleground in past rotations. The move from $3,314 was no fluke — it was a textbook build: sweep the lows, reclaim structure, flip the highs. Volume spiked exactly where it needed to — this wasn’t emotional buying. This was smart money pulling the pin.
Technicals are loaded:
— Holding above $3,396–3,398 (0.618 Fibo + demand re-entry zone)
— All major EMAs (including MA200) are now below price
— RSI strong, no sign of exhaustion
— Candles? Clean control bars — breakout, retest, drive
— Volume profile above price = air pocket — resistance is thin to nonexistent up to $3,450+
Targets:
— $3,447 — prior high
— $3,484 — 1.272 extension
— $3,530 — full 1.618 expansion — key upside target
Fundamentals:
Middle East is boiling. Iran is ready to retaliate. Israel is already escalating. In moments like these, gold isn't just a commodity — it's capital preservation. The dollar is rising — and gold still rallies. That means this isn’t about inflation, or rates. It’s about risk-off. Pure, institutional-level flight to safety.
Tactical view:
The breakout is done. Holding above $3,396 confirms the thesis. Pullbacks to that zone? Reloading points. While gold remains in the channel and momentum is clean, the only side that matters right now — is long.
When price moves before the news — that’s not reaction. That’s preparation. Stay sharp.

It Wasn’t on a Chart. It Was in My JournalYou don’t become consistent by learning more setups. You become consistent by learning more about yourself.
✍️ The Day I Started Journaling, I Stopped Guessing
I used to chase charts like they owed me something.One moment I was confident. The next, I was doubting everything, not because the market betrayed me, but because I wasn’t keeping track of who I was becoming .
Then I started journaling.
Not just logging wins and losses, but writing what I felt, what I saw, where I rushed, and why I broke my own rules. It changed everything.
What Journaling Gave Me (That Charts Alone Couldn’t)
1. Clarity Over Chaos
Every trade became a lesson. I stopped reacting and started reviewing.
2. Accountability Over Emotion
Writing “I entered out of fear of missing out” hits different when you see it five times in a row. I couldn’t lie to myself anymore.
3. Discipline Over Drama
No more revenge trades. No more “just one more” trades. Journaling made me pause, and that pause saved me more than any setup ever could
It’s Not Just a Journal. It’s a Mirror.
Most traders document price. Few document themselves. And yet that’s where the edge lives, not in more indicators, but in more self-awareness.
My Advice to Any Trader Trying to Break Through
Don’t just journal for results . Journal to understand who you are in the market. Your wins will mean more, and your losses will teach more. And if you're consistent with it, your growth won’t just be measurable. It’ll be undeniable.
The best setups won’t save you if your mindset is undisciplined.And the best mentors can’t help you if you don’t study your own patterns.
Journaling isn’t just about logging trades.It’s about documenting your evolution as a trader, from reactive to intentional, from hopeful to professional. So, if you’re serious about growth: Don’t just screenshot your wins, start writing your journey. That’s where the edge really begins.

Current Gold Trend Analysis and Trading RecommendationsOn Friday, the strategy of going long on gold at relatively low levels was once again precisely fulfilled. The morning strategy clearly suggested opening long positions within the range of 3400 - 3410. As expected, the price of gold once again surged to around the 3445 level, and profits were successfully secured once more.
The hourly chart of gold shows a volatile upward trend. Driven by risk aversion in the early morning, it surged rapidly but fell back for correction after hitting resistance at 3444 during the European session. Before the U.S. session, it stabilized at 3412 and rallied again. The previous large bearish candlestick was more of a minor shakeout—after washing out floating chips, it has now regained its upward momentum.
Maintain a strongly bullish approach for now. The 3415-3410 range forms a key support zone, and long positions can be continued above this level. Upper resistance remains at 3445-3450; a valid breakout could lead to further gains toward 3475 and beyond. However, be aware that a sustained rally may trigger a pullback due to overbought indicators or divergences. For operations, consider going long near support and exercise caution when chasing highs near resistance
XAUUSD
buy@3405-3315
tp:3430-3450
Investment itself is not the source of risk; it is only when investment behavior escapes rational control that risks lie in wait. In the trading process, always bear in mind that restraining impulsiveness is the primary criterion for success. I share trading signals daily, and all signals have been accurate without error for a full month. Regardless of your past profits or losses, with my assistance, you have the hope to achieve a breakthrough in your investment.

GOLD Sellers In Panic! BUY!
My dear friends,
My technical analysis for GOLD is below:
The market is trading on 3330.6 pivot level.
Bias - Bullish
Technical Indicators: Both Super Trend & Pivot HL indicate a highly probable Bullish continuation.
Target - 3338.3
Recommended Stop Loss - 3326.5
About Used Indicators:
A pivot point is a technical analysis indicator, or calculations, used to determine the overall trend of the market over different time frames.
Disclosure: I am part of Trade Nation's Influencer program and receive a monthly fee for using their TradingView charts in my analysis.
———————————
WISH YOU ALL LUCK

"XAU/USD Bearish Setup: Rising Channel Breakdown AnticipatedPrevious Resistance Zone (Red Rectangle):
The chart shows a clear resistance zone between ~3,340 and ~3,370 USD.
Price was rejected sharply from this zone earlier (marked by the large blue dot at the swing high).
Current Rising Channel (Blue Channel):
A rising wedge or ascending channel is forming, typically a bearish continuation pattern when found in a downtrend.
Price is currently testing the upper boundary of this pattern.
Bearish Projection (Red Path & Arrows):
The chart creator expects a rejection from the top of the channel, leading to a breakdown and a move toward the next key support at ~3,246.94 USD.
A large red arrow and projected box highlight the short setup zone with an implied favorable risk/reward ratio.
Support Target:
Blue horizontal line at 3,246.94 marks the next significant support level, likely a take-profit target for short sellers.
Macro Factors:
Three small icons indicate upcoming U.S. economic events, possibly influencing XAU/USD volatility and confirming the move.
✅ Summary:
Bias: Bearish
Pattern: Rising Channel (bearish structure)
Entry Zone: Around 3,350–3,360 USD (top of channel)
Target Zone: ~3,246 USD
Risk: Invalid if price closes strongly above the resistance zone (~3,370 USD)

XAUUSD(GOLD): +1874 PIPS Target| Touching $3600? Gold experienced a significant price surge, driven by the ongoing conflict between Iran and Israel. This heightened uncertainty among global investors led to a price touch of $3445. The current price is accumulating, and we anticipate a strong bullish distribution in the near future. Please prioritise accurate risk management during trading.
Good luck,
Team Setupsfx_

Geopolitics Trigger Gold Breakthrough Above $3,400Last night's released strategy accurately predicted Israel's military action against Iran – the strike was launched in the early morning. The driving effect of geopolitics on gold is significant. As a major global oil supply region, the Middle East situation has directly triggered a surge in oil prices.
The key focus is on Iran's subsequent counterattack: if retaliation is carried out, gold's safe-haven attribute will be further activated, and the possibility of gold prices breaking through the $3,500 threshold is significantly increased.
Currently, go long near the $3,400 support level. Pay attention to changes in the international situation, and I will notify you immediately of any new news.
XAU/USD
buy@3400-3410
tp:3430-3440
I am committed to sharing trading signals every day. Among them, real-time signals will be flexibly pushed according to market dynamics. All the signals sent out last week accurately matched the market trends, helping numerous traders achieve substantial profits. Regardless of your previous investment performance, I believe that with the support of my professional strategies and timely signals, I will surely be able to assist you in breaking through investment bottlenecks and achieving new breakthroughs in the trading field.

May peace prevail on earthIf geopolitical conflicts continue to fester, gold prices may keep climbing due to safe-haven demand—yet this is far from our wish. 📈
When risk aversion pushes candlestick charts higher, we'd rather see battlefield fires cease by dawn, letting the rhythm of peace replace market volatility. 🌍✨

Bull market continues? Beware of the possibility of a pullback📰 Impact of news:
1. The geopolitical situation between Israel and Iran deteriorates
📈 Market analysis:
In the short term, gold is expected to rise further. Relatively speaking, there is still room for further increase. If it continues to rise today, it depends on the test of 3440 points, which is the opening position of the previous decline. In the short term, pay attention to the 3340-3350 resistance. If it can break through and stay above it, the 3468-3493 line we gave in the morning can still be used as a reference, and it is even expected to reach 3500. But at the same time, the RSI indicator in the hourly chart is approaching the overbought area, so we still need to be vigilant about the possibility of a pullback.
🏅 Trading strategies:
SELL 3440-3450
TP 3430-3420
BUY 3415-3400
TP 3420-3440
If you agree with this view, or have a better idea, please leave a message in the comment area. I look forward to hearing different voices.
TVC:GOLD FXOPEN:XAUUSD FOREXCOM:XAUUSD FX:XAUUSD OANDA:XAUUSD

GOLD ROUTE MAP UPDATEHey Everyone,
Great finish after completing each of our targets throughout the week with ema5 lock confirmations on our proprietary Goldturn levels. Yesterday we finished off with 3388 and stated we would look for ema5 cross and lock above 3388 to open 3428 and failure to lock will follow with a rejection.
- This played out perfectly with the cross and lock confirmation and then the target hit at 3428 completing the range.
BULLISH TARGET
3318 - DONE
EMA5 CROSS AND LOCK ABOVE 3318 WILL OPEN THE FOLLOWING BULLISH TARGETS
3352 - DONE
EMA5 CROSS AND LOCK ABOVE 3352 WILL OPEN THE FOLLOWING BULLISH TARGET
3388 - DONE
EMA5 CROSS AND LOCK ABOVE 3388 WILL OPEN THE FOLLOWING BULLISH TARGET
3428 - DONE
We’ll be back now on Sunday with our multi-timeframe analysis and trading plans for the week ahead. Thanks again for all your likes, comments, and follows.
Wishing you all a fantastic weekend!!
Mr Gold
GoldViewFX

XAUUSD H4 Outlook – CHoCH Confirmed & Discount Pullback in Motio👋 Hey traders!
Here’s your fresh H4 XAUUSD Outlook for June 9, 2025 — real-time structure, sniper zones, and bias clarity, right where price is sitting. Let’s dive in 👇
📍 Bias: Bearish short-term → clean CHoCH & liquidity sweep, targeting discount retracement
🔹 1. 🔍 H4 Structure Summary
CHoCH (Lower) confirmed after recent LH at 3384.
Price failed to reclaim supply → now trading back below the 3350 level.
Multiple internal CHoCHs + bearish OB at 3368 showing clear short-term rejection.
Market is shifting from a bullish continuation into a retracement leg.
🔹 2. 🧭 Key H4 Structure Zones
Zone Type Price Range Structure Notes
🔼 Supply Zone (Flip Trap) 3360 – 3384 Clean CHoCH, FVG, + OB rejection area — major sell trigger
🔽 Mid-Demand Range 3272 – 3252 Retest OB + FVG cluster, ideal reaction zone for possible bounce
🔽 Deep Discount Zone 3174 – 3145 Last major accumulation + bullish origin block
🔹 3. 📐 Price Action Flow
Previous HH → LH → CHoCH confirms internal structure break.
Liquidity swept above LH at 3384, trapping late bulls.
Now targeting equilibrium zone around 3260–3280 as next H4 liquidity base.
🔹 4. 📊 EMA Alignment (5/21/50/100/200)
EMA5 and EMA21 are starting to cross down.
Price has lost momentum above EMA50 → retracement expected into EMA100/200 territory (sub-3280).
Full bullish EMA stack remains — but this is a controlled correction inside trend.
🔹 5. 🧠 RSI + Momentum View
RSI has dropped below 50 → bearish control short-term.
Momentum flow fading after multiple rejection wicks from premium zones.
📌 Scenarios
🔽 Retracement Flow in Progress
Price likely heading to 3272–3252 demand block for reaction
If this zone fails → we open door to 3174–3145 clean swing zone
🔼 Invalidation
Bullish pressure only regains control on break + hold above 3384
Until then: favor selling the supply + letting price reach discount
✅ GoldFxMinds Final Note
We’ve officially shifted into retracement mode on H4. The game now is to either:
Sell retests into supply, or
Wait for clean confirmations at demand for new longs
Let price come to your zone. No emotion — just structure.
💬 Drop your chart view below or ask if you’re unsure where to position next.
Locked in for next move,
— GoldFxMinds 💡

XAUUSD: Analysis June 13This morning, the gold market witnessed a strong price increase after receiving two important news:
- US CPI was lower than expected, causing the USD to weaken.
- Israel continued to strike Gaza, raising concerns about escalating conflict in the Middle East.
🟨Trend: Strong increase - Break resistance
✅ Potential Buy Zone: 3410 – 3405: This is the breakout zone after the news, you can wait to buy if the price retests. SL 2399
❌ Potential Sell Zone (exit block or surfing):
✅ 3450 - 3455, SL 3461: Strong resistance, old accumulation zone (according to Bar chart, Resistance is determined at 3,455). If RSI/H1 shows overbought signal, consider taking profit or short Sell.

Analysis of the latest gold trend on June 13:
Gold multi-period resonance analysis
1. Daily level - trend strengthening stage
Structural breakthrough: The price effectively stood above the 3350 neckline (the upper edge of the previous oscillation range), and the daily closing was "engulfing the positive line", confirming the bullish dominance.
Moving average system: 5/10/20-day moving averages are arranged in a bullish pattern, MACD double lines diverge upward from the zero axis, and RSI (14) remains above 60 without overbought.
Key pressure: 3390-3400 area (weekly Fibonacci 78.6% retracement level).
2. 4-hour level - momentum verification
Wave structure: The 3320 low point can be regarded as the end of wave C, and the current running is sub-wave 3 of driving wave 3, with a theoretical target of 3415 (1.618 extension level).
Volume and price coordination: The rise is accompanied by an increase in trading volume, while the Asian session pullback is reduced, indicating that the selling pressure is limited.
3. 1-hour level - short-term trading anchor point
Time-sharing support:
Strong defensive position 3356 (starting point of Asian morning session + Bollinger middle rail)
Bull lifeline 3348 (previous high conversion support + V-shaped retracement 61.8% position)
Intraday channel: Currently running along the rising channel (lower rail 3355/upper rail 3395)
Today's three-dimensional trading strategy
▶ Main long plan
Best entry area: 3362-3355 (4-hour EMA10 and channel lower rail overlap area)
Position allocation: 50% main position, stop loss 3345 (stop loss moves up after breaking through the previous high)
Target 1: 3385 (equal amplitude measurement after breaking through the Asian session high)
Target 2: 3400 (reduce position by 50% in the daily pressure zone)
Target 3: 3415 (clear position at the wave theory target position)
▶ Auxiliary short opportunities
Counter-trend conditions: first touch 3408 and appear:
1-hour chart pregnancy line/evening star
MACD top divergence + shrinking trading volume
Operation: light position short (position ≤ 20%), stop loss 3418, target 3380
▶ Breakthrough chasing order strategy
Break above 3402: fall back to 3392 to chase long, stop loss 3385, target 3425
Break below 3348: rise and rebound to 3352 to short, stop loss 3360, target 3330
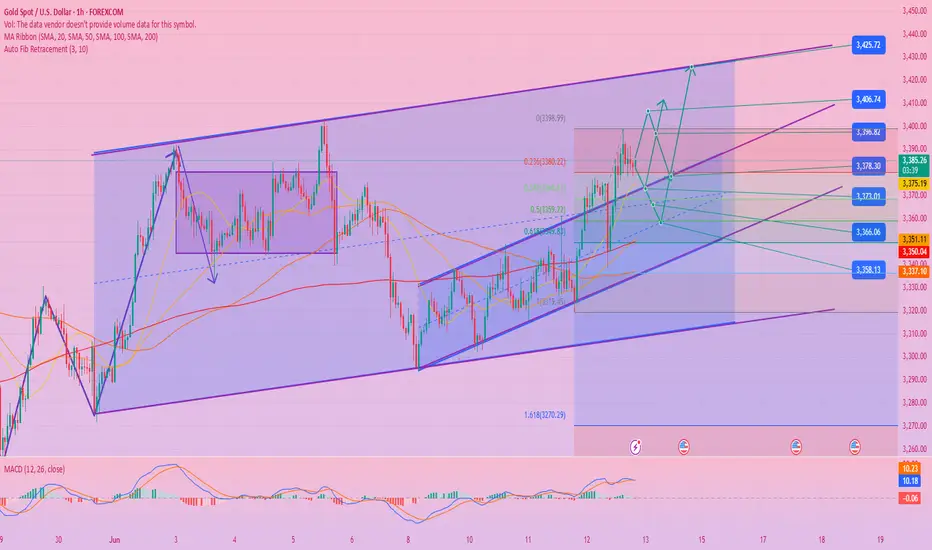
Elliott Wave Analysis – XAUUSD Trading Plan for June 13, 2025🌀 Wave Structure Overview
As anticipated in previous plans, a strong bullish move has unfolded. Unfortunately, wave 2 within wave 3 was extremely sharp, triggering our stop loss — but that’s part of trading. Not every market movement will go perfectly as planned.
Currently, by closely observing wave 3, we can see that each bullish leg has shown similar length. This suggests a high probability of an extended wave, possibly wave 3 or wave 5.
In Elliott Wave theory, extended waves are the most difficult to predict in terms of where they will end. That’s why selling against the trend (“standing in front of the train”) is discouraged. Instead, we should rely on corrective structures to find buy opportunities in line with the main trend.
On the chart, the price is showing a 5-wave structure (i ii iii iv v) in purple. There’s also a possibility that wave iii itself is extending, forming 5 smaller waves, making a total of 9 subwaves — all with similar bullish momentum. This reinforces the potential for an extended wave in progress.
🎯 Target Zone for Wave iv Correction (Purple)
Watch levels: 3419 and 3411
This is the ideal zone to look for buying opportunities aligned with the prevailing uptrend.
📉 Momentum Analysis
- Daily (D1): Momentum remains bullish, which supports the continuation of the upward trend — a key requirement for a sustained wave move.
- H4: Momentum is currently in the overbought zone and may remain there for a while, waiting for D1 to also reach overbought. However, this also signals a potential risk of reversal that should not be ignored.
- H1: Momentum has turned downward, which supports the idea that wave iv is forming.
✅ Trade Plan
BUY ZONE: 3415 – 3412
STOP LOSS: 3405
TAKE PROFITS:
TP1: 3428
TP2: 3444
TP3: 3480
📌 Note: Stick to trend-following trades and avoid counter-trend positions that try to "catch the top." Be patient, wait for clear confirmation signals around wave iv’s zone, and manage your risk carefully.

XAUUSD:Buy or SellRegarding the trend of XAUUSD (gold against the US dollar), it is completely in line with my expectations yesterday. The current price has reached the watershed of 3345. If it breaks through, continue to be bullish. If it does not break through. Then wait for the market to fall.
### Key analysis points
1. Confirmation of resistance breakthrough
- The importance of the 3345 level: If this position is a resistance that has been tested many times recently (such as previous highs, Fibonacci retracement levels or trend line suppression), it may trigger short-covering or new buying after the breakthrough, pushing the price further up.
- Verify the effectiveness of the breakthrough: It is necessary to observe the momentum at the time of the breakthrough (such as accompanied by a large positive line, increased trading volume) and whether the closing price can stand above 3345 to avoid false breakthroughs.
2. Upward target
- First target: If the breakthrough is established, the next resistance may look at the 3360-3380 area (previous high or extended Fibonacci level).
- Medium-term potential: If the trend reversal is confirmed, it may even challenge the 3400 psychological level.
3. Pullback risk management
- Support level: If it fails to break through 3345 or falls back after a false breakout, you need to pay attention to the support below (such as 3320-3300), which is the short-term long-short watershed.
- Stop loss reference: The stop loss of long positions can be set below 3300 to protect the safety of funds.
Trading strategy suggestions
- Aggressive strategy (breakthrough trading):
- Entry: Go long when the price breaks through 3345 and then confirms the pullback.
- Stop loss: Below 3320 (adjusted according to volatility).
- Take profit: Close orders in batches (3360, 3380).
- Conservative strategy (retracement trading):
- Wait for the pullback to the 3320-3300 support area to stabilize and then go long, stop loss 3280.
- The target is the same as the breakthrough strategy.
- Short warning:
If the 3345 resistance continues to suppress and a bearish pattern appears, consider shorting with a stop loss above 3360.
Variables to be added
1. Time frame: Is the above analysis based on the daily or 4-hour chart? Short-term trading requires a smaller cycle to confirm the signal.
2. Driving factors: Pay attention to the Fed's policy expectations, the US dollar index, the geopolitical situation, etc., which may suddenly change the technical pattern.
Summary
Whether the current rebound can continue depends on the effectiveness of the breakthrough of 3345. If successful, it can be bullish, but a strict stop loss is required.
If you need a more detailed entry point analysis or position management plan, please feel free to let me know your trading cycle and risk preference, and I will provide you with a customized strategy.
