Gold Surges on Middle East Conflict: What's the Next Move?XAUUSD – Gold Surges on Middle East Conflict: What's the Next Move?
🌍 Geopolitical Shock Fuels Market Volatility
The gold market responded sharply after Israel launched a series of targeted airstrikes on Iran’s nuclear facilities, including the Natanz uranium site. These actions triggered global concern:
Gold jumped to $3,430/oz, hitting a new weekly high
WTI crude surged by over 8%
US equity indices dipped significantly
The US remains officially neutral but confirmed it will defend its troops if provoked
Investors are now moving rapidly into safe-haven assets, especially gold.
📊 Technical Breakdown (H1/M30)
Trend Structure: Bullish momentum continues following the breakout above $3,392
Key Support Zone: $3,412–$3,426, with price holding above this region
Fair Value Gap (FVG): Identified between $3,405–$3,412, could act as re-entry zone
EMA Alignment: Price is above the 13, 34, 89, and 200 EMAs — signalling strength across short and long-term moving averages
Psychological Resistance: Eyes now on the $3,454–$3,456 zone for potential selling pressure
🧠 Market Sentiment & Risk Behaviour
Risk-off mood dominates: Capital is rotating into gold, CHF, and JPY
Traders are reacting to news headlines over economic data
Institutional flows are entering strongly on dips, building positions in defensive assets
🎯 Trade Setup for 13th June
✅ Buy Zone: 3384 – 3382
Stop-Loss: 3378
Targets: 3388 – 3392 – 3396 – 3400 – 3405 – 3410
❌ Sell Zone: 3454 – 3456
Stop-Loss: 3460
Targets: 3450 – 3446 – 3442 – 3438 – 3434 – 3430
📌 Tactical Summary
Gold remains a go-to asset amid geopolitical uncertainty. While the technicals support further upside, caution is warranted near resistance. Any easing in military headlines could trigger a fast retracement.
🔍 Pro tip: Avoid chasing. Let price confirm near key levels before entering. Manage risk diligently in high-volatility environments.
Xauusd(w)

Hellena | GOLD (4H): LONG to resistance area of 3428.Colleagues, in the last forecast I wrote that I expect to reach the target in the area of 3439.37 and I am not giving up on it. At the moment, the price has made a strong correction and so I will make a new forecast, in which the targets will remain almost unchanged, but I see that the wave pattern has changed a bit.
Now wave “1” lower wave is located higher and at the moment I believe that the price is in wave “5”.
A correction to the support area of 3265 is possible, but in general I expect to reach the resistance area of 3428.
Manage your capital correctly and competently! Only enter trades based on reliable patterns!

Update of the Bullish/Bearish Catalysts for Gold prices________________________________________
⚡️ Gold’s Pullback: A Reset, Not the End
After peaking above $3,500/oz in April, gold’s slide back toward $3,210 marks a sharp—but not unusual—correction. What’s changed in the gold narrative? The rapid unwinding of panic bids as the Fed stays hawkish, the dollar flexes, and risk appetite returns. But beneath the surface, multiple structural drivers—old and new—are shaping gold’s next act.
________________________________________
1. Fed “Higher for Longer” Policy Bias (9/10)
Still the #1 driver.
With inflation sticky and the U.S. labor market robust, the Federal Reserve’s reluctance to cut rates (4.25–4.50%) is pinning real yields near multi-year highs. This erodes the appeal of non-yielding assets like gold, particularly for Western investors.
🦅 Watch for any dovish shift—a single Fed pivot could reignite gold fast.
________________________________________
2. U.S. Dollar Resilience (8.5/10)
The DXY recently surged above 101, buoyed by relative U.S. growth outperformance and ongoing EM weakness. Since gold is dollar-priced, a strong greenback makes gold more expensive for non-dollar buyers, crimping global demand.
💵 Sustained dollar strength could push gold closer to $3,100 unless countered by inflation or new geopolitical stress.
________________________________________
3. Central Bank Buying & “De-Dollarization” Flows (8/10)
This is the new wild card.
Countries like China, India, Turkey, and Russia are accelerating gold reserves accumulation—partly to hedge against dollar-centric sanctions and diversify away from U.S. Treasuries. Q2 2025 data shows a 35% jump in net central bank purchases year-on-year.
🏦 This bid underpins the gold market even when ETFs and retail are sellers.
________________________________________
4. U.S.–China Trade Normalization (7.5/10)
The May 2025 Geneva agreement was a big de-risking event. While tariffs haven’t vanished, steady progress on tech and agriculture reduces tail risk for global trade, putting downward pressure on gold’s safe-haven premium.
🌏 Any breakdown or tariff surprise could quickly reverse this.
________________________________________
5. Algorithmic & Quant Trading Flows (7/10)
Gold’s volatility is now heavily influenced by systematic funds. CTA (commodity trading advisor) and quant-driven selling accelerated the recent drop once $3,300 was breached. This non-fundamental selling creates overshoots—but also sharp reversals on technical bounces.
🤖 Expect snapbacks when positioning reaches extremes.
________________________________________
6. U.S.–U.K. & EU Trade Deals (6.5/10)
Both deals have reduced the global uncertainty premium. While the economic impact is moderate, improved global relations have pushed capital into equities and away from gold.
🇬🇧 Keep an eye on political risk, especially if new tariffs or Brexit-related shocks re-emerge.
________________________________________
7. India–Pakistan and Middle East Geopolitical Risks (6.5/10)
Tensions have cooled, but remain a latent driver. The India–Pakistan border saw restraint in May; Iran–U.S. talks are “cautiously positive.” Any surprise flare-up, especially involving oil, can quickly restore gold’s safe-haven bid.
🕊️ Event-driven spikes likely, but not sustained unless escalation persists.
________________________________________
8. ETF Flows, Retail & Institutional Demand (6/10)
ETF inflows have slowed sharply in 2025, but central bank and Asian buying partly offset this. U.S. retail interest has faded due to higher Treasury yields, but any sign of real rates rolling over could spark new inflows.
📈 ETF demand is now more a symptom than a cause of price moves.
________________________________________
9. Technological Demand & Jewelry Trends (5.5/10)
Longer-term, gold’s use in electronics, EVs, and green tech is rising modestly (up ~3% YoY). Indian and Chinese jewelry demand—seasonally soft now—could rebound late 2025 if income and sentiment recover.
📿 Not a short-term driver, but a steady tailwind in the background.
________________________________________
10. Fiscal Risk & U.S. Debt Sustainability (5.5/10)
Rising concerns about the U.S. debt trajectory, especially if deficits widen or the U.S. nears a shutdown or downgrade, can trigger flight-to-quality bids for gold. This is not the main driver now, but is a key “black swan” risk if Treasury auctions stumble.
💣 Could move up the list rapidly on negative headlines.
________________________________________
🌐 Other Catalysts to Watch:
• Israel – Iran tensions in the Middle East – limited impact on gold prices.
• Crypto Market Volatility (5/10): Periods of sharp crypto drawdowns have triggered some rotation into gold, but the correlation is inconsistent.
• Chinese Real Estate Stress (5/10): Signs of further slowdown or crisis (e.g., major developer defaults) could boost gold as a defensive play in Asia.
• Physical Supply Disruptions (4/10): Mine strikes, export restrictions, or transport bottlenecks can create localized price spikes, but rarely move the global market for long.
________________________________________
🏆 2025 Gold Catalyst Rankings (with Impact Scores)
Rank Catalyst Strength/10 Current Impact Direction Notes
1 Fed “Higher for Longer” Policy 9.0 Very High Bearish Key yield driver
2 U.S. Dollar Resilience 8.5 Very High Bearish Hurts non-USD demand
3 Central Bank & “De-Dollarization” Buying 8.0 High Bullish Structural support
4 U.S.–China Trade Normalization 7.5 High Bearish De-risks global trade
5 Algorithmic/Quant Trading Flows 7.0 High Bearish Magnifies volatility
6 U.S.–U.K./EU Trade Deals 6.5 Moderate Bearish Risk appetite rising
7 India–Pakistan/Mideast Geopolitics 6.5 Moderate Neutral Event risk
8 ETF, Retail & Institutional Flows 6.0 Moderate Bearish Trend follower
9 Tech/Jewelry Physical Demand 5.5 Low Bullish Seasonal uptick possible
10 U.S. Debt/Fiscal Sustainability 5.5 Low Bullish Potential tail risk
11 Crypto Market Volatility 5.0 Low Bullish Risk-off flows (sometimes)
12 China Property Crisis 5.0 Low Bullish Asian safe-haven buying
13 Physical Supply Disruptions 4.0 Very Low Bullish Rare but possible
________________________________________
🚦Where Next for Gold?
• Current price: ~$3,210/oz
• Key support: $3,150/oz
• Key upside triggers: A dovish Fed surprise, sharp dollar reversal, sudden geopolitical event, or central bank “buying spree.”
• Risks: Extended strong dollar, yield spike, no escalation of global risks.
________________________________________
Summary Table: 2025 Gold Price Catalysts Comparison
Catalyst 2024 Score 2025 Score Change Impact Direction (2025) Commentary
Fed Rate Policy 9 9 – Bearish Unchanged, still dominant
U.S. Dollar 8 8.5 ↑ Bearish Gained in strength
Central Bank Buying 7 8 ↑ Bullish Grown in importance, especially in Asia
U.S.-China Trade 7.5 7.5 – Bearish Still relevant, deal holding for now
Algorithmic/Quant Flows 6 7 ↑ Bearish Systematic trading influence is rising
Geopolitics (excl. Russia/Ukraine) 6 6.5 ↑ Neutral Slight increase, mostly latent risks
ETF/Institutional Flows 5 6 ↑ Bearish Slower, but still influential
Jewelry/Tech Demand 4.5 5.5 ↑ Bullish Tech/jewelry more important now
U.S. Debt/Fiscal Risk 5 5.5 ↑ Bullish Gaining attention with deficit concerns
Crypto Market Volatility 4 5 ↑ Bullish Correlation growing, but inconsistent
China Property Risk N/A 5 NEW Bullish Added due to emerging Asian risk
Physical Supply Disruption 3.5 4 ↑ Bullish Minor, only spikes on rare events
________________________________________
🥇 Bottom Line:
Gold’s retreat reflects a rebalancing of risk and yield, but the stage is set for sudden moves—especially if the Fed blinks, the dollar falters, or new shocks emerge. The top three catalysts (Fed, Dollar, Central Bank buying) are especially worth watching as we head into the second half of 2025.

Gold (XAUUSD) Technical Breakdown : Structure Shifting + Target📍 Overview:
Gold (XAUUSD) has been displaying a classic technical development that traders need to pay close attention to. What initially looked like a smooth parabolic rally has now transitioned into a clear structure shift, as evidenced by the breakdown of a rounded support curve and rejection from a major resistance zone. The market is signaling a bearish retracement or even a deeper correction, and this setup offers potential trading opportunities both for short-term scalpers and swing traders.
📊 Chart Breakdown:
🔸 1. The Rounded Support Curve (Black Mind Curve):
The curve outlines a strong upward acceleration phase starting from the June 9 low.
This curve often acts like a dynamic support — similar to a parabolic trendline.
As long as price stays above it, the momentum remains intact.
In this case, Gold broke below the curve, which is a sign of exhaustion and potential bearish control.
🔸 2. Major Resistance Zone (~$3,417 – $3,427):
This level has acted as a ceiling multiple times in the past, visible in earlier highs from June 5 and 6.
Upon re-approaching this zone, price showed aggressive wicks to the upside followed by strong bearish candles — signaling institutional selling and profit-taking.
This triple rejection reinforced the resistance’s significance.
🔸 3. Structure Mapping and Transition:
After the breakdown, we observed a clean market structure shift: the formation of lower highs and lower lows, a key sign of bearish trend development.
The current price action is flowing downward in an organized pattern, suggesting further downside unless a strong reversal or bullish engulfing setup occurs.
🔸 4. Next Reversal Zone (~$3,360):
This area is identified as a high-probability support zone based on:
Past price reaction.
Previous accumulation zone from June 10–11.
Psychological round number proximity (e.g., $3,350 – $3,360).
Traders should monitor this level for potential reversal setups such as bullish engulfing candles, pin bars, or RSI divergence.
🧠 Market Psychology:
This pattern reflects a classic distribution phase at resistance after an emotionally driven uptrend:
Retail traders jump in late as the price approaches highs.
Institutions begin distributing (selling into strength).
Support breaks down as retail stops get triggered.
Price drops into a demand zone where accumulation may begin again.
Understanding this psychological cycle helps traders align with the smart money rather than chasing price action blindly.
🛠️ Potential Trading Plans:
✅ Scenario 1: Bearish Continuation
Wait for a retest of the broken structure (~$3,390 – $3,400).
Look for rejection patterns (e.g., bearish engulfing, shooting star).
Entry: ~$3,395–$3,400 | Target: ~$3,360 | SL: Above $3,420.
✅ Scenario 2: Bullish Reversal from Support
Monitor price action around $3,360 zone.
Look for bullish structure forming: higher lows, reversal candles, divergence.
Entry: On confirmation (e.g., bullish pin bar on 1H or 4H).
Target: Back to structure at ~$3,400–$3,410.
⚠️ Risk Considerations:
Avoid entering in the middle of the range.
Use proper stop-loss positioning to manage volatility.
Keep an eye on macro catalysts like:
US inflation reports
Fed commentary or interest rate decisions
Geopolitical tensions that can spike gold
🧭 Summary:
The market is unfolding a textbook technical setup:
Resistance rejection
Rounded support breakdown
Bearish structure
Approaching a high-probability support zone
Patience is key — let price come to your level. Watch the $3,360 zone for potential reversal, and use structure to guide entries and exits.
📌 Final Note:
This analysis is part of the MMC Methodology (Market Mapping Cycle), which focuses on identifying macro structure, confirming micro structure, and mapping turning points with precision.
Let the market reveal itself. Don't chase — plan and execute with clarity.

GOLD (XAU/USD) 4H CHART – BULLISH BREAKOUT TRADE SETUP🔵 Trendline Breakout 📈
📏 Price broke above a descending trendline, signaling a potential bullish reversal.
🔼 This breakout is often seen as a buy signal by traders.
🧱 Resistance Area 🛑
🔹 Price has entered and broken through a horizontal resistance zone.
🔄 This zone may now flip into support, adding confidence to the long setup.
🟧 Demand Zone 📦
📍 Marked between 3,267 – 3,298.
🛡️ Strong buying interest historically observed in this area.
📉 EMA (70) at 3,298.065 acts as dynamic support.
🟦 Entry Point 🚪
🎯 Entry Level: 3,322.930
🔄 Enter after retest confirmation or bullish candle above resistance.
🔴 Stop Loss ⛔
⚠️ SL Level: 3,267.993
💣 Below the demand zone and EMA — protecting against false breakouts.
🟩 Target Point 🎯
🚀 TP Level: 3,490.000
📌 Prior high zone — strong historical resistance expected here.
💰 Trade Setup Summary
✅ Buy Above: 3,322.930
❌ Stop Loss: 3,267.993
🎯 Target: 3,490.000
📊 Risk/Reward Ratio: Favorable (approx. 1:3)
🔎 Technical Confidence Levels
🔵 EMA Support ✅
🔵 Trendline Breakout ✅
🔵 Resistance Flip ✅
🔴 False Breakout Risk

Israel attacks Iran, gold soars
⭐️Gold information:
Israel attacks Iran's capital Tehran! Gold and crude oil soar rapidly!
The Middle East bully attacks Iran, and the risk aversion sentiment affects the early trading of gold at 3380. 30 US dollars
⭐️Personal comments:
Due to the escalation of geopolitical tensions in the Middle East, market risk sentiment has slightly rebounded, and investors are more inclined to buy traditional safe-haven assets-gold
Moving towards 3480
⭐️Set gold price:
🔥Sell gold area: 3478-3480 SL 3485
TP1: $3462
TP2: $3450
TP3: $3435
🔥Buy gold area: $3375-$3377 SL $3370
TP1: $3389
TP2: $3400
TP3: $3412

GOLD Intraday Chart Update For 13 June 25Hello Traders,
First of all congratulations to all of you as 3430-40 zone GAP filled today but sad new is war scenarios resume
so advise for you is take limited risks
all eyes on 3450 Psychological level breakout, intraday expected range is 3400-3450 if markets break 3450 then it will move towards 3480
if market breaks 3400 successfully then it will move back towards 3370 or even 3355
Disclaimer: Forex is Risky

Middle East Tensions Drive Gold Back to $3,400Today, after pulling back to around $3,340, gold broke through $3,380 and has since fluctuated in a narrow range of $3,370-$3,400. With the Middle East tensions escalating, Iran has stated that even if its current nuclear facilities are damaged, it will continue to build new sites and is determined to rebuild them to safeguard its security. Israel will by no means tolerate this, dimming the hopes of the Trump administration's peace initiative.
Short positions are now infeasible. Although rallies to new highs are often followed by pullbacks, the risk of wiping out accounts entirely makes shorting too dangerous.
We recommend gradually building long positions near $3,350-$3,370, setting stop-loss orders 10-15 dollars below the entry price to avoid heavy losses from major shifts in the situation.
I am committed to sharing trading signals every day. Among them, real-time signals will be flexibly pushed according to market dynamics. All the signals sent out last week accurately matched the market trends, helping numerous traders achieve substantial profits. Regardless of your previous investment performance, I believe that with the support of my professional strategies and timely signals, I will surely be able to assist you in breaking through investment bottlenecks and achieving new breakthroughs in the trading field.

XAU/USD 4H Technical Analysis 13 June 2025Market Structure & Bias:
On the 4H chart, gold has broken out of a recent sideways range and formed a sequence of higher highs and higher lows. This “break of structure” (BOS) through the old swing high confirms a bullish bias.
Price action respects key support zones (demand areas) on retracements, suggesting underlying buying interest. The overall bias is bullish, driven by risk‐off sentiment. Support and resistance act as natural pause/reversal zones
For example, a demand zone/order block around ~3390–3400 (from the prior swing low) has been tested and held, fueling the recent rally.
Likewise, an imbalance (fair value gap) left below 3400 could attract buyers if price returns. We also note that a change of character (CHOCH) would occur only if price breaks below a higher-low; so far that has not happened.
In short, gold’s 4H market structure is bullish (higher highs/lows) and the trend looks set to continue upward unless a strong reversal forms. Key Levels (4H): We use classic pivot points to mark critical levels (using the last 4H high, low, close). Pivot points can project future support and resistance.
Based on recent swings, key levels are:
Pivot: 3424 (calculated from last bar’s H/L/C)
Support 1: 3413
Support 2: 3399
Support 3: 3374
Resistance 1: 3438
Resistance 2: 3449
Resistance 3: 3474
Price currently hovers just below R1. These levels align with congestion zones and Fib retracements (50–61.8% of the last $3290–3427 upswing), so expect active bidding near S1–S2 and selling around R1–R2.
Intraday 1H Trade Setups
Buy Zone ~3395–3405 (Bullish OB/Demand):
Entry: Long on dips into the order-block/demand area near 3395–3405 (just above S1).
Stop: ~3385 (≈$10 below entry zone).
Targets: TP1 ≈ 3438 (Resistance 1), TP2 ≈ 3450 (near R2).
Reason: This zone aligns with a prior institutional order block/demand and a 61.8% Fib retrace of the recent rally. Price has shown bounce here before, so a bullish reaction is likely.
Trigger: Look for a bullish reversal candle (e.g. bullish engulfing or pin bar) on 1H in this zone, or a market structure low (MSL) turning point. A break back above the high of that candle can serve as confirmation to enter.
Sell Zone ~3435–3445 (Bearish Retrace):
Entry: Short near resistance around 3435–3445 (just below R1–R2).
Stop: ~3455 (≈$10 above entry zone).
Targets: TP1 ≈ 3413 (Support 1), TP2 ≈ 3399 (Support 2).
Reason: This area is the upper end of the recent range. It contains a minor supply zone and the R1–R2 pivots. A liquidity sweep (stop-hunt) may occur above recent highs.
If price loses momentum here, expect a pullback.
Trigger: Watch for a bearish price action signal (e.g. a bearish engulfing candle or a double-top swing) on 1H. A break of the immediate lower low (lower than the last minor swing) would confirm a short-term change of character and signal entry.
Breakout Long ~3449+:
Entry: Long on a sustained break above R2 (≈3450). Confirm entry when price closes above 3449 on 1H.
Stop: ~3424 (just under the Pivot).
Targets: TP1 ≈ 3474 (Resistance 3), TP2 ≈ 3495+ (new highs).
Reason: A clean breakout of 3450 would indicate strong bullish order flow and trigger stop-run triggers. This would be a continuation trade in line with the 4H uptrend.
Trigger: A bullish candle closing above 3449 (ideally with above-average size) or a 1H break of structure (higher high over 3449) would signal entry.
Takeaway: Gold remains in a bullish 4H trend; focus on buying dips into demand zones and watch for clear candlestick triggers at support/resistance.

Eurgbp Buy price is currently bullish on 4hr timeframe. its trading around the 4hr demand zone and there are also lower timeframe demands zones within the 4hr demand zone add stregnth to it. there are multiple pois above current pirce action which may fuel the buy bias. im wating for price to break a 5min supply zone thats near a 4hr poi in order to enter the trade.

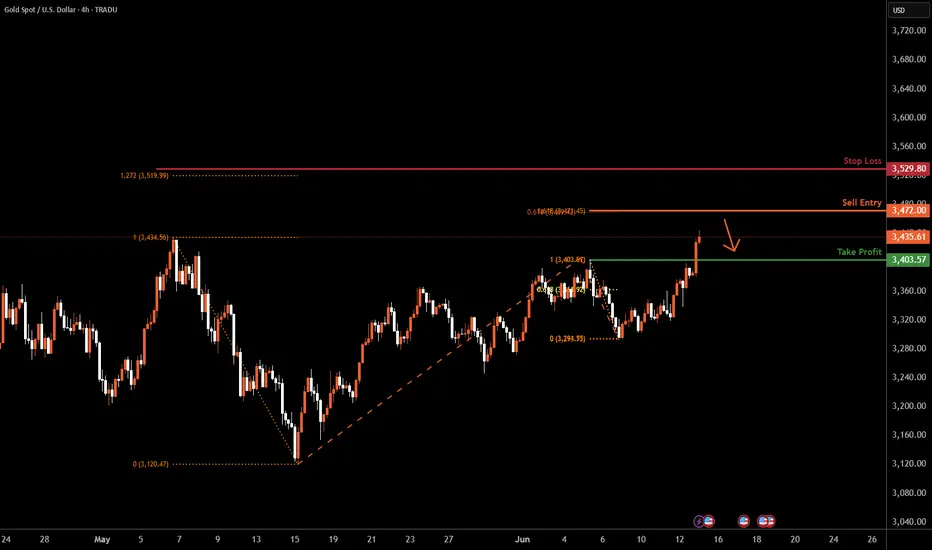
XAUUSD H4 I Bullish ContinuationBased on the H4 chart analysis, we can see that the price is falling toward our buy entry at 3403.57, which is a pullback support.
Our take profit will be at 3472, which aligns with the 61.8% Fibonacci projection and the 161.8% Fibonacci extension, adding a significant level for a potential bearish reversal.
The stop loss will be placed at 3347.94, an overlap support.
High Risk Investment Warning
Trading Forex/CFDs on margin carries a high level of risk and may not be suitable for all investors. Leverage can work against you.
Stratos Markets Limited (tradu.com/uk ):
CFDs are complex instruments and come with a high risk of losing money rapidly due to leverage. 63% of retail investor accounts lose money when trading CFDs with this provider. You should consider whether you understand how CFDs work and whether you can afford to take the high risk of losing your money.
Stratos Europe Ltd (tradu.com/eu ):
CFDs are complex instruments and come with a high risk of losing money rapidly due to leverage. 63% of retail investor accounts lose money when trading CFDs with this provider. You should consider whether you understand how CFDs work and whether you can afford to take the high risk of losing your money.
Stratos Global LLC (tradu.com/en ):
Losses can exceed deposits.
Please be advised that the information presented on TradingView is provided to Tradu (‘Company’, ‘we’) by a third-party provider (‘TFA Global Pte Ltd’). Please be reminded that you are solely responsible for the trading decisions on your account. There is a very high degree of risk involved in trading. Any information and/or content is intended entirely for research, educational and informational purposes only and does not constitute investment or consultation advice or investment strategy. The information is not tailored to the investment needs of any specific person and therefore does not involve a consideration of any of the investment objectives, financial situation or needs of any viewer that may receive it. Kindly also note that past performance is not a reliable indicator of future results. Actual results may differ materially from those anticipated in forward-looking or past performance statements. We assume no liability as to the accuracy or completeness of any of the information and/or content provided herein and the Company cannot be held responsible for any omission, mistake nor for any loss or damage including without limitation to any loss of profit which may arise from reliance on any information supplied by TFA Global Pte Ltd.
The speaker(s) is neither an employee, agent nor representative of Tradu and is therefore acting independently. The opinions given are their own, constitute general market commentary, and do not constitute the opinion or advice of Tradu or any form of personal or investment advice. Tradu neither endorses nor guarantees offerings of third-party speakers, nor is Tradu responsible for the content, veracity or opinions of third-party speakers, presenters or participants.

XAUUSD H4 I Bearish Reversal Based on the H4 chart analysis, we can see that the price is rising toward our sell entry at 3472.00, which aligns with the 61.8% Fibonacci projection and the 161.8% Fibonacci extension, adding a significant level for a potential bearish reversal
Our take profit will be at 3403.57, a pullback support level.
The stop loss will be placed at 2529.80, above the 127.2% Fib extension.
High Risk Investment Warning
Trading Forex/CFDs on margin carries a high level of risk and may not be suitable for all investors. Leverage can work against you.
Stratos Markets Limited (tradu.com/uk ):
CFDs are complex instruments and come with a high risk of losing money rapidly due to leverage. 63% of retail investor accounts lose money when trading CFDs with this provider. You should consider whether you understand how CFDs work and whether you can afford to take the high risk of losing your money.
Stratos Europe Ltd (tradu.com/eu ):
CFDs are complex instruments and come with a high risk of losing money rapidly due to leverage. 63% of retail investor accounts lose money when trading CFDs with this provider. You should consider whether you understand how CFDs work and whether you can afford to take the high risk of losing your money.
Stratos Global LLC (tradu.com/en ):
Losses can exceed deposits.
Please be advised that the information presented on TradingView is provided to Tradu (‘Company’, ‘we’) by a third-party provider (‘TFA Global Pte Ltd’). Please be reminded that you are solely responsible for the trading decisions on your account. There is a very high degree of risk involved in trading. Any information and/or content is intended entirely for research, educational and informational purposes only and does not constitute investment or consultation advice or investment strategy. The information is not tailored to the investment needs of any specific person and therefore does not involve a consideration of any of the investment objectives, financial situation or needs of any viewer that may receive it. Kindly also note that past performance is not a reliable indicator of future results. Actual results may differ materially from those anticipated in forward-looking or past performance statements. We assume no liability as to the accuracy or completeness of any of the information and/or content provided herein and the Company cannot be held responsible for any omission, mistake nor for any loss or damage including without limitation to any loss of profit which may arise from reliance on any information supplied by TFA Global Pte Ltd.
The speaker(s) is neither an employee, agent nor representative of Tradu and is therefore acting independently. The opinions given are their own, constitute general market commentary, and do not constitute the opinion or advice of Tradu or any form of personal or investment advice. Tradu neither endorses nor guarantees offerings of third-party speakers, nor is Tradu responsible for the content, veracity or opinions of third-party speakers, presenters or participants.
Fakeout or Takeoff? Gold Retakes 3350 Before NY Close1. Recap of Yesterday's Move
Yesterday was a volatile day for Gold. Price initially broke above the key 3340–3350 resistance zone, only to drop back below it—but intriguingly, it closed above it on the New York session. That close is the detail that changes everything.
2. Key Question: Will Gold Stay Above 3400 and Push Toward New ATHs?
Let’s split this into two scenarios:
________________________________________
🟢 Bullish Scenario – Buy the Dip?
• The short-term structure is undeniably bullish.
• The reclaim of 3340–3350 is not a fakeout, but a clean signal of strength.
• If momentum holds, we can expect price to push toward 3405 and then 3435.
• As such, the strategy remains: buy dips, targeting those key levels.
________________________________________
🟡 Long-Term Breakout? Not So Fast
• Yes, the higher lows at 3120, 3250, and 3295 suggest that the correction from 3500 may be over.
• A clean breakout and stabilization above 3400, ideally near 3430, could signal a path toward a new all-time high.
• ❗ However, volatility remains wild, and if geopolitical tensions de-escalate or trade tariffs get resolved, Gold could see a sharp drop of 1500–2000 pips, as part of a broader risk-off unwind. Peace and stability could hurt safe-haven demand.
________________________________________
📌 Trading Plan
• Short-term: Buy dips while above 3340-3350 (ideally on a re-test), aiming for 3405 and 3435.
• Long-term: Stay flexible. Wait for confirmation above 3430 before going for the ATH narrative.
________________________________________
💡 Conclusion
Technically, Gold is bullish in both the short and long term. But with global uncertainty in play, don't ignore the fundamentals. Trade the chart, but respect the world around it. 🚀
Disclosure: I am part of TradeNation's Influencer program and receive a monthly fee for using their TradingView charts in my analyses and educational articles.

Bullislh continuation?The Gold (XAU/USD) is falling towards the pivot which is a pullback support that aligns with the 23.6% Fibonacci retracement and could bounce to the 1st resistance that lines up with the 100% Fibonacci projection.
Pivot: 3,374.04
1st Support: 3,348.45
1st Resistance: 3,414.78
Risk Warning:
Trading Forex and CFDs carries a high level of risk to your capital and you should only trade with money you can afford to lose. Trading Forex and CFDs may not be suitable for all investors, so please ensure that you fully understand the risks involved and seek independent advice if necessary.
Disclaimer:
The above opinions given constitute general market commentary, and do not constitute the opinion or advice of IC Markets or any form of personal or investment advice.
Any opinions, news, research, analyses, prices, other information, or links to third-party sites contained on this website are provided on an "as-is" basis, are intended only to be informative, is not an advice nor a recommendation, nor research, or a record of our trading prices, or an offer of, or solicitation for a transaction in any financial instrument and thus should not be treated as such. The information provided does not involve any specific investment objectives, financial situation and needs of any specific person who may receive it. Please be aware, that past performance is not a reliable indicator of future performance and/or results. Past Performance or Forward-looking scenarios based upon the reasonable beliefs of the third-party provider are not a guarantee of future performance. Actual results may differ materially from those anticipated in forward-looking or past performance statements. IC Markets makes no representation or warranty and assumes no liability as to the accuracy or completeness of the information provided, nor any loss arising from any investment based on a recommendation, forecast or any information supplied by any third-party.

Have a nice BUY GOLD !!Dear traders you can get long on 3382$ Now on GOLD and enjoy.
Huge benefit is waiting for you.
Take care, relax and enjoy

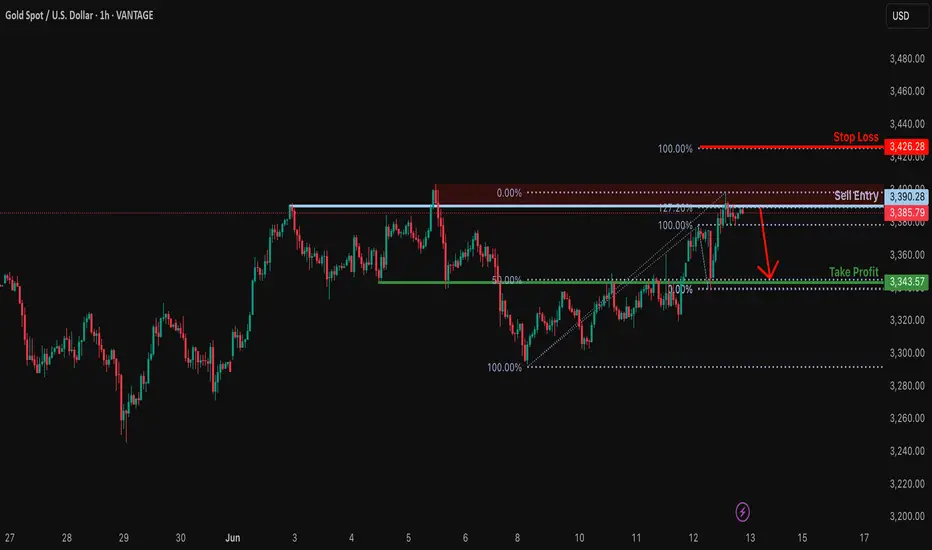
Could the Gold reverse from here?The price is reacting off the resistance level which is a pullback resistance that aligns with the 127.2% Fibonacci extension and could drop from this level to our take profit.
Entry: 3,390.28
Why we like it:
There is a pullback resistance level that lines up with the 127.2% Fibonacci extension.
Stop loss: 3,426.28
Why we like it:
There is a pullback resistance level that lines up with the 100% Fibonacci projection.
Take profit: 3,343.57
Why we like it:
There is an overlap support level that aligns with the 50% Fibonacci retracement.
Enjoying your TradingView experience? Review us!
Please be advised that the information presented on TradingView is provided to Vantage (‘Vantage Global Limited’, ‘we’) by a third-party provider (‘Everest Fortune Group’). Please be reminded that you are solely responsible for the trading decisions on your account. There is a very high degree of risk involved in trading. Any information and/or content is intended entirely for research, educational and informational purposes only and does not constitute investment or consultation advice or investment strategy. The information is not tailored to the investment needs of any specific person and therefore does not involve a consideration of any of the investment objectives, financial situation or needs of any viewer that may receive it. Kindly also note that past performance is not a reliable indicator of future results. Actual results may differ materially from those anticipated in forward-looking or past performance statements. We assume no liability as to the accuracy or completeness of any of the information and/or content provided herein and the Company cannot be held responsible for any omission, mistake nor for any loss or damage including without limitation to any loss of profit which may arise from reliance on any information supplied by Everest Fortune Group.
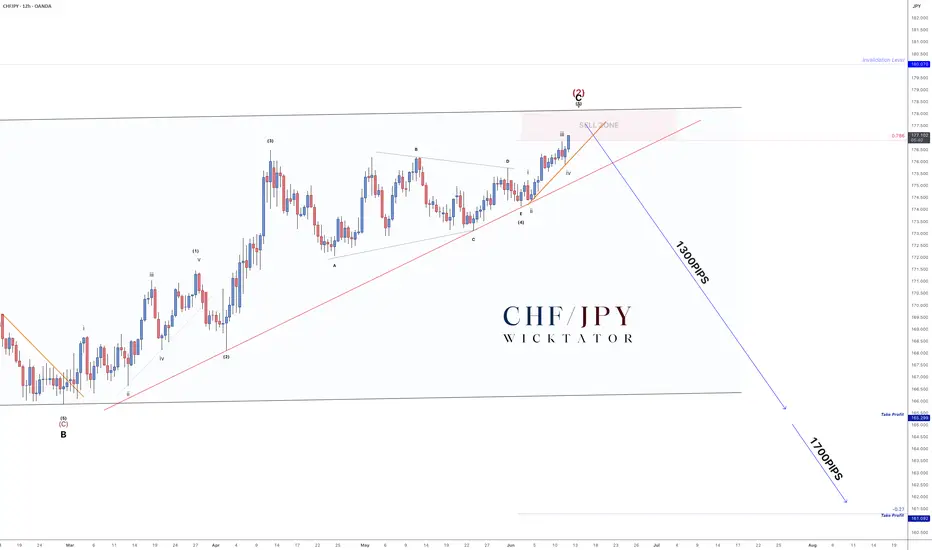
CHFJPY - How To Enter This MASSIVE 1700pip Swing Trade!As promised - here’s the lower timeframe breakdown after hitting 100+ likes.
We’re in wave 5, currently moving cleanly into the swing zone. Since wave 5 typically forms 5 subwaves, all we needed was to connect points 2 and 4 to draw our entry trendline.
Trade Idea:
- Entry on break of the orange trendline
- Stops above recent highs after entry
- Aggressive option: Enter inside the sell zone with stops above invalidation
Targets:
- TP1: 165.00 (≈1300 pips)
- TP2: 161.50 (≈1700 pips)
- Optional: Leave a runner for the longer swing move
Scroll down for the full 4H breakdown.
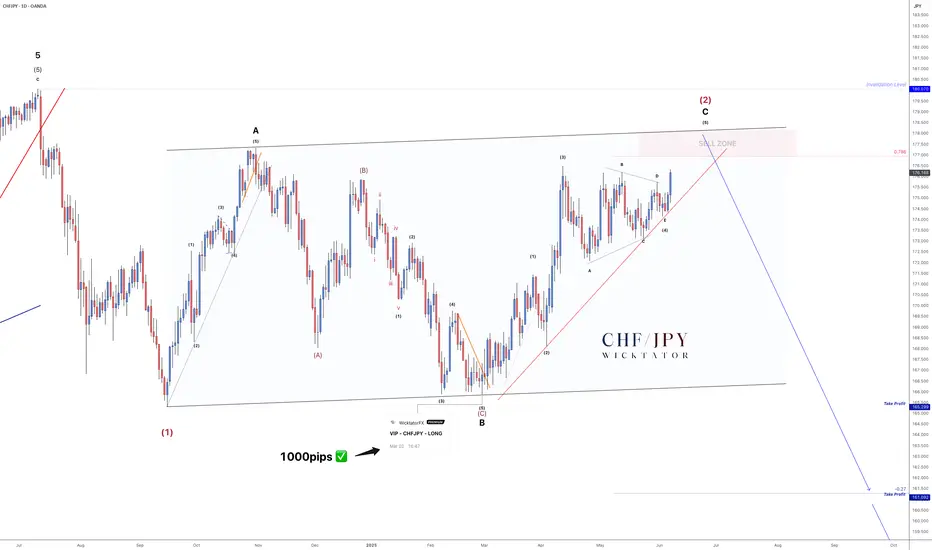
CHFJPY - 1700 Pip Reversal Incoming!The last time we looked at CHFJPY was back in October 2024, where we forecasted a large ABC correction. Fast forward to now - that correction is nearly complete!
We're currently in the 5th subwave of wave C, and everything points toward a massive drop setting up. We expect a move of at least 1500 pips.
On the Daily timeframe, structure is clear:
- Clean 5-3-5 ABC correction
- Price is approaching a key sell zone
- A clear entry trendline is in place — couldn’t ask for a cleaner setup
Trade Idea:
- Watch for rejection within the sell zone
- Aggressive entry: Inside sell zone with stops above invalidation
- Conservative entry: On break of trendline, stops above the break candle
Targets:
TP1: 165.00 (≈1300 pips)
TP2: 161.50 (≈1700 pips)
Optional: Leave a runner for a long-term swing
Let me know what you think in the comments.
See below for our last VIP setup for CHFJPY which played out perfectly. 1000pips secured!
Good luck and as always, trade safe!
Iran tensions rise: a setup brewing for gold and oil Geopolitical tensions surrounding Iran might fuel safe-haven demand for gold.
A break above $3,403 might open the door for a test of the May high at $3,437. However, price action over the last two sessions potentially indicates that buyers are reluctant to drive spot prices above $3,400.
At the same time, analysts are suggesting that oil could climb toward $120 if Israel takes military action against Iran. “I don’t want to say it’s imminent, but it looks like something that could very well happen,” President Trump said during a White House event.
Meanwhile, cooler-than-expected US CPI and PPI prints have potentially strengthened expectations that the Federal Reserve could begin cutting interest rates by September, with a second cut possibly following before year-end.

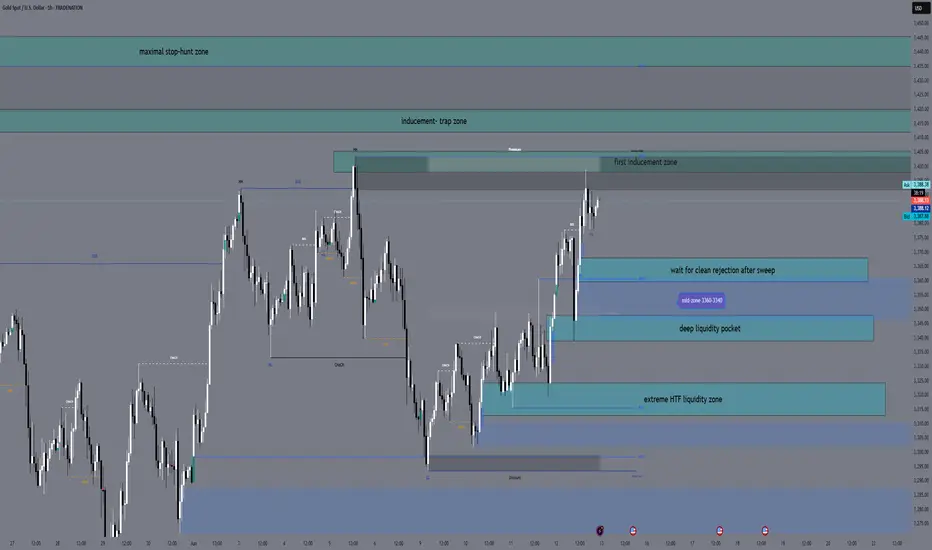
XAUUSD Daily Plan — June 13, 2025 By GoldFxMinds👋 Hello traders, and welcome to your full preparation for tomorrow’s gold session.
Gold continues to respect its structural map while liquidity traps remain active on both sides of the range. We’ve seen clean sweeps and fast reactions this week, but tomorrow brings a new catalyst: key U.S. data combined with fresh geopolitical tensions that may fuel additional volatility before the weekly close.
🌐 MACRO & GEOPOLITICAL OUTLOOK:
📊 Prelim UoM Consumer Sentiment & Inflation Expectations are scheduled tomorrow:
Consumer Sentiment ➔ 52.2
Inflation Expectations ➔ 6.6%
These data points often trigger sharp USD moves and liquidity grabs.
🌍 Geopolitical tension has increased as President Trump authorized the evacuation of U.S. personnel from several Middle East locations due to rising threats in the region, particularly concerning the Iran nuclear situation.
This development triggered sharp moves across commodities, with oil rallying strongly.
Gold remains well-supported in this environment as global risk sentiment deteriorates.
Traders should expect elevated intraday volatility and potential liquidity sweeps on both sides as markets digest these developments.
🔎 The combination of macro data and geopolitical risk creates highly reactive conditions where liquidity hunts may precede any clear directional moves.
🔎 STRUCTURE OVERVIEW:
Price remains inside premium territory after recent bullish expansions.
Liquidity has already been taken above and below earlier this week, but additional traps may unfold before Friday’s close.
Larger structure remains bullish while short-term supply zones may attract quick inducements.
Tomorrow's flow will likely begin with manipulation during or after news, before real momentum develops.
🎯 BIAS
Main bias: Controlled bullish, but highly reactive inside premium.
As long as price holds above 3340, bulls remain in control on higher timeframe.
However, premium zones above 3395 may act as liquidity traps, inviting fast selloffs after inducements.
Best opportunities likely to come from either:
Controlled retracement into buy zones for continuation higher.
Fast spikes into premium traps for short-term sell opportunities.
Patience will be critical as both news and geopolitical headlines may trigger manipulations before real trend unfolds.
🔑 KEY ZONES TO WATCH:
BUY ZONES
🔵 3368 - 3360
Intraday pullback zone.
Look for minor liquidity dips followed by bullish rejection.
Targets: 3390 → 3405.
🔵 3348 - 3340
Deeper liquidity pocket into H4 imbalance and OB.
Engage only after strong downside sweep with sharp bullish reaction.
Targets: 3380 → 3396.
🔵 3325 - 3312
Extreme HTF liquidity zone.
Valid only if aggressive liquidation occurs into deeper discount.
Targets: 3360 → 3380.
SELL ZONES
🔴 3398 - 3405
First premium inducement area.
Look for fast spikes with M15 bearish rejection candles.
Targets: 3370 → 3348.
🔴 3412 - 3420
Secondary premium trap zone.
Valid only after upside wick rejection.
Targets: 3385 → 3355.
🔴 3435 - 3445
Maximum stop-hunt exhaustion zone.
Only valid if price aggressively squeezes into final liquidity.
Targets: 3390 → 3360.
⚠ TRADING REMINDER:
Friday’s session will likely be driven by both news and geopolitical headlines. Let liquidity play out inside the zones, wait for clear rejection signals, and execute with full confirmation. No chasing — sniper discipline only. 🎯
💎 Hit that 🚀 if you found this plan helpful.
👉 Feel free to follow for daily gold plans and share your thoughts in the comments.
We remain disciplined. We trade structure.
🌙 Rest well tonight — tomorrow we execute with precision and control.
— GoldFxMinds
Gold Market Analysis and Trading Recommendations for TodayYesterday, gold surged then pulled back in a washout move triggered by CPI data, before rebounding again in the evening on news-driven sentiment, closing the daily chart bullish. This morning's opening saw further rally breaking new highs, confirming strong bullish momentum. Today's strategy remains buying on dips with the uptrend.
On the 4H chart, gold stabilized at the mid-Bollinger band before rebounding with consecutive bullish candles. Moving averages are bullishly aligned and Bollinger bands are widening—all signaling strong bullishness. However, as the triangle consolidation range remains unbroken, chasing the rally is unadvised. Focus on dip-buying: key supports at 3,345–3,340 and 3,325; resistances at 3,385 and 3,400, where potential shorting opportunities may be considered based on price momentum.
XAUUSD
buy@3340-3350
tp:3370-3380
Investment itself is not the source of risk; it is only when investment behavior escapes rational control that risks lie in wait. In the trading process, always bear in mind that restraining impulsiveness is the primary criterion for success. I share trading signals daily, and all signals have been accurate without error for a full month. Regardless of your past profits or losses, with my assistance, you have the hope to achieve a breakthrough in your investment.

ELLIOT WAVEOANDA:XAUUSD 4 HOUR
**According to the Elliott Wave theory, the ongoing pattern appears to be a double correction. Wave 3 of {Y} has been completed, and Wave 4 is currently in progress. A potential buying opportunity may arise between the levels of 3360 and 3350. **
**However, if gold breaks below the 3350 level, further downside movement is expected, with the next support zone likely between 3315 and 3297. **
**Furthermore, if gold breaks the critical level of 3250, it may extend its decline toward the 3215–3197 range.**

Accurately capture golden trading opportunitiesBased on the current trend, it is recommended to focus on low-long operations, but be wary of the market repeating the pattern of the previous few days of high-rush, wash-out and fall. From the perspective of key points, 3360 has been converted from a previous resistance level to a support level. At the same time, the hourly line forms an important support near 3358. If there is a stabilization signal at this position, it can be regarded as a good opportunity to go long. However, if the market falls below the 3356 line, it is not ruled out that the price will further fall to around 3345. This position is the key long-short watershed during the day. Once it is lost, the short-selling force may increase; in extreme cases, if there is a deep wash-out, the gold price may even pull back to 3325. For the upper resistance, pay attention to 3395-3405 first. If it can break strongly, it can further look to 3414.
Based on the above analysis, the trading strategy is as follows:
If gold falls back to the area near 3345-3355 and does not break, you can consider arranging long orders;
When the price rises to the area near 3395-3405 and does not break, you can try to arrange short orders.
When operating, be sure to strictly set stop losses and control risks.
Today's market trend is completely in line with the predicted rhythm, with a clear shock structure and flexible response around key points. With precise layout based on two-way thinking, we can achieve a double kill of long and short positions and a steady harvest. If your current gold operation is not ideal, and we hope to help you avoid detours in your investment, please feel free to communicate with us!
