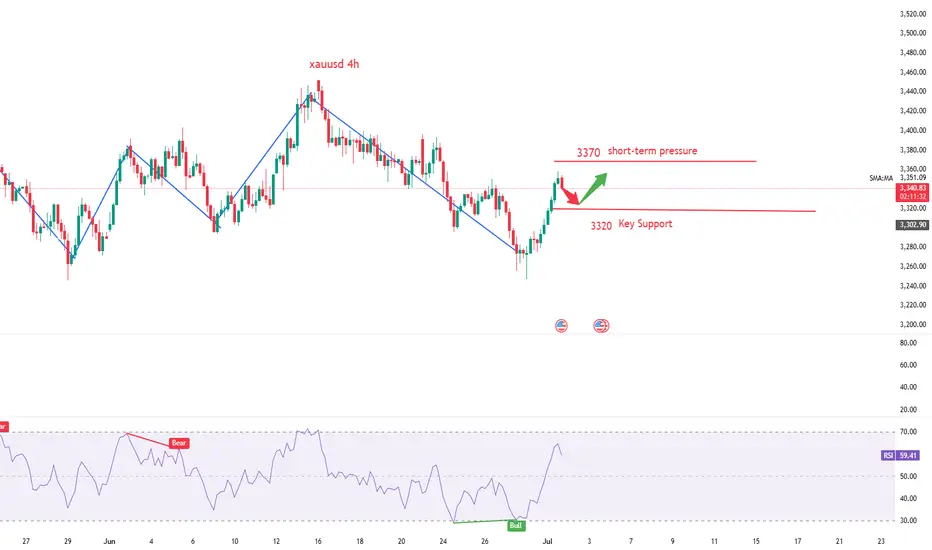
GOLD H2 Intraday Chart Update For 2 July 2025Hello Traders,
Today all eyes on breakout of 3360-70 zone in order to GOLD go for further advance below this zone all eyes are remains on 3318 level if market successfully maintain 3330 level then will go down further towards 3300 Psychological Level after passing 3318
NFP main event of the day which is held by tomorrow
Disclaimer: Forex is Risky
Xauusd(w)

SUI/USDT Short Setup (2025-07-25)SUI/USDT Short setup for day traders.
Please enter with confirmation in 5M time frame.
⚠️ This Analysis will be updated ...
👤 Sadegh Ahmadi: GPTradersHub
📅 2025.Jul.2
⚠️(DYOR)
❤️ If you apperciate my work , Please like and comment , It Keeps me motivated to do better

SPY/QQQ Plan Your Trade For 7-1 : Post Market UpdateToday was a very powerful day for the Cycle Patterns - particularly for Gold and BTCUSD.
Gold rallied as the Cycle Pattern predicted a RALLY in TREND mode.
BTCUSD collapsed on a CRUSH Cycle Pattern.
The SPY Cycle Pattern predicted a Gap Reversal pattern. We did see the Gap today and a moderate reversal in price. But the SPY, as usual, continued to try to melt upward.
I highlighted a very interesting TWINNING pattern in Bitcoin in this video. Pay attention.
Get some.
#trading #research #investing #tradingalgos #tradingsignals #cycles #fibonacci #elliotwave #modelingsystems #stocks #bitcoin #btcusd #cryptos #spy #gold #nq #investing #trading #spytrading #spymarket #tradingmarket #stockmarket #silver

Gold (XAUUSD) – Bias for July 2Yesterday, price broke above the key H4 Lower High zone (3348–3350) with strong bullish momentum.
This breakout suggests a possible shift in the higher timeframe structure — indicating that the market may now be building toward a larger uptrend.
But we don’t chase breakouts — we prepare for the pullback phase .
🔍 What to Watch:
At present, M15 remains in a clean uptrend , fully in sync with the new H4 structure.
This multi-timeframe alignment gives us a clear bullish bias — but not an entry by itself.
We now need to see how price develops the pullback.
The best trades come when structure retraces with clarity — and confirms before continuation.
📍 Key M15 Level to Track:
• 3302 – Current M15 Higher Low
→ If this level holds, we may see a continuation of the uptrend from here.
→ If it breaks, the next potential reversal zone is around 3290 , where demand may reappear.
🎯 Execution Plan:
The trend is now clearly bullish across HTF and LTF.
We will only look for long setups , and only where structure confirms — either at the current HL or at deeper demand zones.
No confirmation = No trade.
No alignment = No edge.
Let price come to you. Our job is not to anticipate, but to align.
📖 From the Mirror Philosophy:
“In trend-following, the edge lies in waiting — not in chasing.
The market will reflect your patience back at you.”
📘 Shared by @ChartIsMirror
Author of The Chart Is The Mirror — a structure-first, mindset-grounded book for traders

Gold operation suggestionsLooking back at the market in May and June, although gold has experienced adjustments, its shape is very resilient. In the monthly cycle, the price of gold is firmly above the MA5 moving average. From the perspective of large-cycle technical analysis, this is a typical strong bullish pattern, demonstrating the strong control of the bulls. As the adjustments are gradually in place, the later bullish outbreak is worth looking forward to. However, the adjustment to 3247 this time is not small, so in the short term, the gold price is likely to fluctuate upward. At present, 3451 is an important watershed. Once it is effectively broken through, the gold price is expected to hit the 3500 mark, and I personally believe that 3500 will not be the end point, and it is expected to be refreshed later.
Gold retreats as expected, how to trade in the future📰 News information:
1. Geopolitical situation
2. PMI data
3. Global Central Bank Governors Meeting
📈 Technical Analysis:
Our short orders have achieved profits. I closed the position near 3337, turning losses into profits. Interested friends can follow my previous post. In the short term, I am still optimistic that gold will retreat below 3335-3325. Today, gold rose sharply, and the rebound momentum was strong, while the short-term correction was slightly weak, so the space for a second decline in the short term will be limited. If it falls to the 3333-3323 range during the day and gets effective support, you can consider going long. The short-term upper resistance is 3360-3375.
🎯 Trading Points:
BUY 3333-3323-3315
TP 3341-3355-3360-3375
In addition to investment, life also includes poetry, distant places, and Allen. Facing the market is actually facing yourself, correcting your shortcomings, confronting your mistakes, and strictly disciplining yourself. I hope my analysis can help you🌐.
TVC:GOLD OANDA:XAUUSD FX:XAUUSD FOREXCOM:XAUUSD PEPPERSTONE:XAUUSD FXOPEN:XAUUSD
xauusd gold analysis and signalhello everyone, i was posting in minds for quick analysis and signal, now i'll start posting here, so you can get an idea of my gold analysis everyday and make money... the price is still in bearish trend on htf, price was bullish all day yesterday as dollar kept getting weaker (see dxy chart). today with job news usd revive on bullish side.. price reversing from order block.. price can continue bearish if it breaks the support level 3337.. if not it can reverse in next Asian session.. there fore use proper risk management... good luck

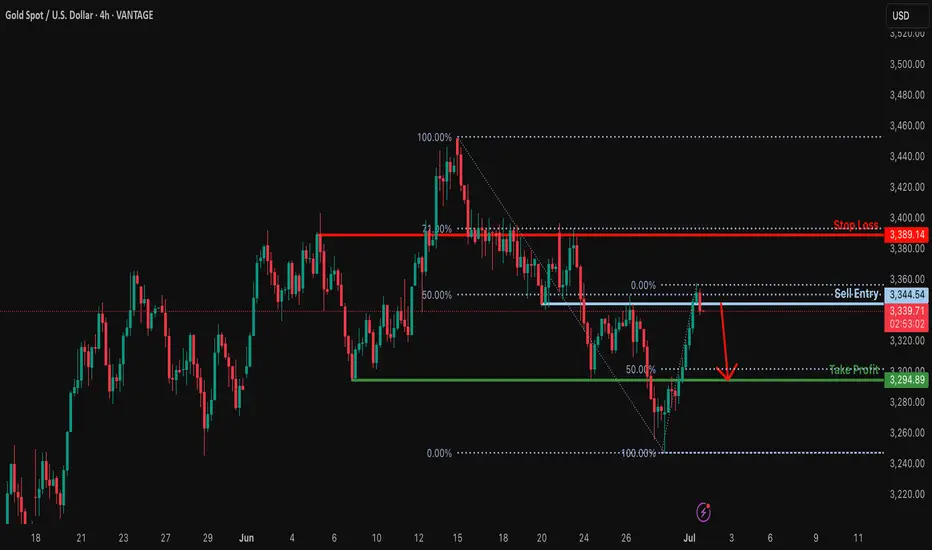
Bearish drop?XAU/USD is reacting off the resistance which is a pullback resistance that lines up with the 50% Fibonacci retracement and could drop from this level to our take profit.
Entry: 3,344.54
Why we like it:
There is a pullback resistance that lines up with the 50% Fibonacci retracement.
Stop loss: 3,389.14
Why we like it:
There is a pullback resistance that lines up with the 71% Fibonacci retracement.
Take prpofit: 3,294.89
Why we like it:
There is a pullback support level that aligns with the 50% Fibonacci retracement.
Enjoying your TradingView experience? Review us!
Please be advised that the information presented on TradingView is provided to Vantage (‘Vantage Global Limited’, ‘we’) by a third-party provider (‘Everest Fortune Group’). Please be reminded that you are solely responsible for the trading decisions on your account. There is a very high degree of risk involved in trading. Any information and/or content is intended entirely for research, educational and informational purposes only and does not constitute investment or consultation advice or investment strategy. The information is not tailored to the investment needs of any specific person and therefore does not involve a consideration of any of the investment objectives, financial situation or needs of any viewer that may receive it. Kindly also note that past performance is not a reliable indicator of future results. Actual results may differ materially from those anticipated in forward-looking or past performance statements. We assume no liability as to the accuracy or completeness of any of the information and/or content provided herein and the Company cannot be held responsible for any omission, mistake nor for any loss or damage including without limitation to any loss of profit which may arise from reliance on any information supplied by Everest Fortune Group.
Gold Breakout and Potential RetraceHey Traders, in today's trading session we are monitoring XAUUSD for a buying opportunity around 3,330 zone, Gold was trading in a downtrend and successfully managed to break it out. Currently is in a correction phase in which it is approaching the retrace area at 3,330 support and resistance area.
Trade safe, Joe.

GOLD - SHORT TO $2,800 (UPDATE)We've seen s sharp move back up overnight which is no surprise considering we are at the start of a new month & quarter. Markets will be spiking to both sides for monthly liquidity, before moving in the direction of the trend.
We're still holding below our yellow support zone & below 'Minor Wave 2'. If this continues to hold, then it'll be a good sign for sellers.

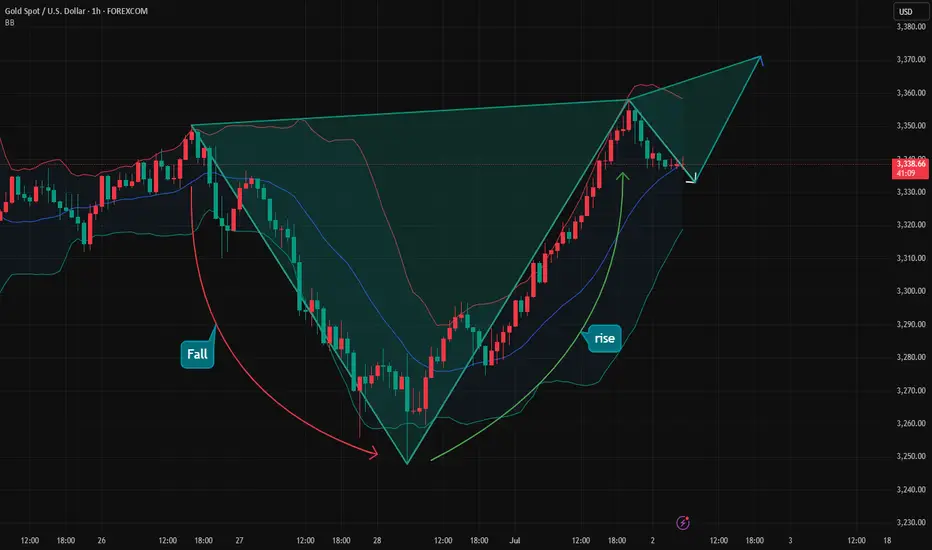
Gold falls back, is a bottom structure emerging?In terms of one-hour structure, this round of phased adjustment started from 3450 has not ended yet, but it will soon, especially the rapid rebound after the bottom of 3260 on Monday. This rebound has strong momentum. After bottoming out and rebounding, it is currently fluctuating around 3340, with a large overall span. This also shows that after the price has risen, the amplitude of the correction has increased, which means that the upward space is limited. This adjustment is likely to be over soon, but there is no definite bottom structure yet, so we need to wait for some time.
Before going out of the definite bottom structure, based on the principle of following the trend, you can try to short with a light position. At present, in terms of the one-hour pattern, the key point is here at 3355, and it is currently falling back from this position to 3340. If it falls back to the 3320 area today and stabilizes above it, you can operate a long strategy. On the whole, Quaid suggests that the short-term operation strategy for gold today should be mainly long on pullbacks, supplemented by shorting on rebounds.
Operation strategy:
Short at 3345, stop loss at 3355, profit range 3330-3325.
Long at 3320, stop loss at 3310, profit range 3340-3345.

Gold Rebound Underway – Support Zone Holds Strong! - Short termGold( OANDA:XAUUSD ), as I anticipated in the previous idea , has attacked the Support zone($3,281-$3,243) and Support lines .
From an Elliott Wave theory perspective , it appears that Gold has completed 5 sub-waves of the main wave C .
Also, we can see the Regular Divergence(RD+) between Consecutive Valleys.
I expect Gold to rise to at least $3,307 in the coming hours.
Second Target: $3,321
Note: Stop Loss (SL) = $3,240
Gold Analyze (XAUUSD), 1-hour time frame.
Be sure to follow the updated ideas.
Do not forget to put a Stop loss for your positions (For every position you want to open).
Please follow your strategy; this is just my idea, and I will gladly see your ideas in this post.
Please do not forget the ✅ ' like ' ✅ button 🙏😊 & Share it with your friends; thanks, and Trade safe.

GOLD ROUTE MAP UPDATEHey Everyone,
Another PIPTASTIC day on the charts today with our analysis playing out to perfection!!!
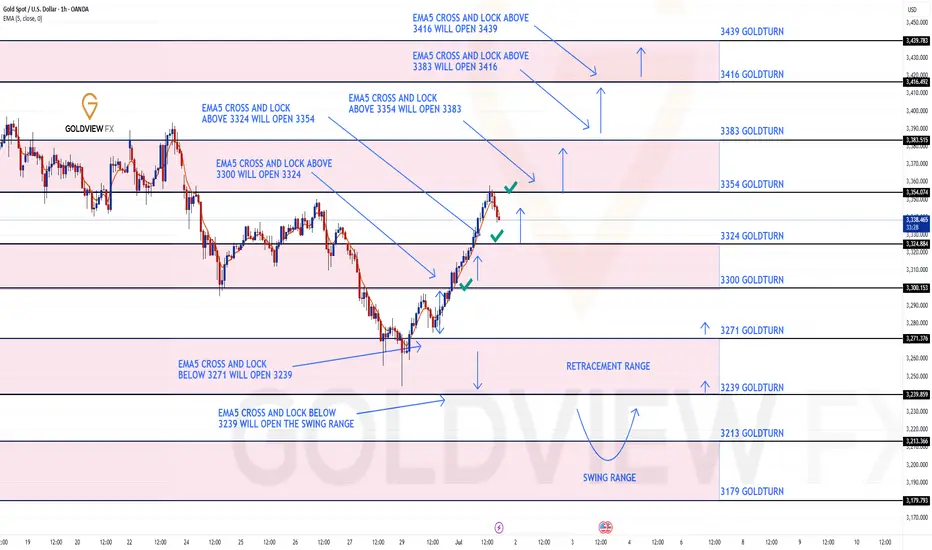
After hitting 3300 target yesterday, we stated that we would now look for ema5 cross and lock above 3300 to open 3324. This was locked and loaded and we got the target hit at 3324. This followed with a further ema5 cross and lock above 3324 opening 3354, which was also hit perfectly completing this range.
We are now seeing a perfect rejection from this level and unless we get a ema5 cross and lock above this level for a continuation, we are likely to see the lower Goldturns tested for support and bounce.
We will keep the above in mind when taking buys from dips. Our updated levels and weighted levels will allow us to track the movement down and then catch bounces up.
We will continue to buy dips using our support levels taking 20 to 40 pips. As stated before each of our level structures give 20 to 40 pip bounces, which is enough for a nice entry and exit. If you back test the levels we shared every week for the past 24 months, you can see how effectively they were used to trade with or against short/mid term swings and trends.
The swing range give bigger bounces then our weighted levels that's the difference between weighted levels and swing ranges.
BULLISH TARGET
3300 - DONE
EMA5 CROSS AND LOCK ABOVE 3300 WILL OPEN THE FOLLOWING BULLISH TARGETS
3324 - DONE
EMA5 CROSS AND LOCK ABOVE 3324 WILL OPEN THE FOLLOWING BULLISH TARGET
3354 - DONE
EMA5 CROSS AND LOCK ABOVE 3354 WILL OPEN THE FOLLOWING BULLISH TARGET
3383
BEARISH TARGETS
3271
EMA5 CROSS AND LOCK BELOW 3354 WILL OPEN THE FOLLOWING BEARISH TARGET
3239
EMA5 CROSS AND LOCK BELOW 3239 WILL OPEN THE SWING RANGE
3213
3179
As always, we will keep you all updated with regular updates throughout the week and how we manage the active ideas and setups. Thank you all for your likes, comments and follows, we really appreciate it!
Mr Gold
GoldViewFX
Why Gold Trading is Not Easy for Beginners - Trading PsychologyGold Doesn’t Just Teach Trading. It Teaches You Discipline.
1. Why Gold? Why Not Everything Else?
Gold is the most honest manipulator in the market.
It respects structure down to key intraday levels—but builds traps around it like a pro.
It fakes direction, sweeps liquidity, teases early entries, then moves beautifully for anyone patient enough to wait.
And it’s daily: one premium buy and one killer sell almost every day—hundreds of pips on the table for eyes that can see.
Other assets feel slow once you lock into Gold’s rhythm.
So what to expect:
2. The Phases Before Profit
• Lucky Dumb Money
Early wins boost your confidence. You increase your risk. It all feels easy—until the market proves otherwise.
• The Slap
Suddenly, things don’t work anymore. Indicators stop making sense. Emotions interfere. Results shift, and frustration creeps in. This is the breaking point for most traders. 6 months to 1 year on XAUUSD and they are out.
• The Awakening
This is when clarity begins. Indicators are dropped. Structure, liquidity, and timing take center stage.
What once looked random now starts to make sense.
Progress begins the moment YOUR EGO gets quiet.
Consistency only follows those who choose patience over panic.
3. Gold Is a Mirror
Gold doesn’t just reflect your trades — it reflects YOU.
Every personal flaw shows up on the chart: impatience, doubt, greed, fear, ego.
It mirrors your decisions, your reactions, your emotional patterns — all of it.
Blaming the market delays growth.
But the moment you turn inward, you begin to see the truth:
your results reflect your level of discipline, clarity, and self-awareness.
Gold forces you to evolve.
Not just as a trader, but as a thinker, a decision-maker, a human.
That’s why it’s not for everyone. Some people are not ready to recognize who they truly are yet.
4. What Leads to Profitability
What actually leads to profitability in Gold?
It’s fast. It’s full of adrenaline.
But you have to get a routine - consistent, structured, and effective — when applied with discipline.
→ One pair only. Mastery on XAUUSD
→ Structure first. Liquidity, imbalance, session timing
→ Fewer trades, cleaner entries
→ Smaller lots, more control = emotions are in check
→ Relentless observation. Learn from each execution and adjust with intention
This is what leads to results.
Not noise. Not hope. Just precision and presence — again and again.
5. You Won’t Win Until You Commit
You don’t need to destroy your schedule or stay up all night.
But you do need to make time for growth.
Signals won’t help if you’re not willing to understand the asset you’re trading.
Gold filters out shortcuts, distractions, and surface-level effort.
But those who take it seriously earn every pip — and they earn it with clarity, not luck.
So stop asking,
“How long until I’m profitable?”
Start asking,
“Am I ready to do what Gold actually demands?”
CONCLUSION:
Most traders don’t fail because Gold is too complicated—
they fail because they try to figure it out alone.
They chase signals, skip the process, and ignore the real path to consistency:
invest in education, proper mentorship, and trading psychology coaching.
The ones who grow fastest are those who seek guidance early—
from people who live and breathe this market, and understand structure, mindset, and pressure.
If you choose to go at it alone, that’s also a good choice.
Just know: it will take longer. It will test your patience and your clarity.
But when the structure clicks… when you stop chasing setups and start executing with confidence…
When you secure 3–4 solid trades a week and avoid unnecessary losses—
everything changes. Trading becomes calm. Focused. Even enjoyable.
Whichever path you take, the outcome depends on the same thing:
Gold won’t just test your trades.
It will develop your discipline.
If this lesson helped you today and brought you more clarity:
Drop a 🚀 and follow us✅ for more published ideas.

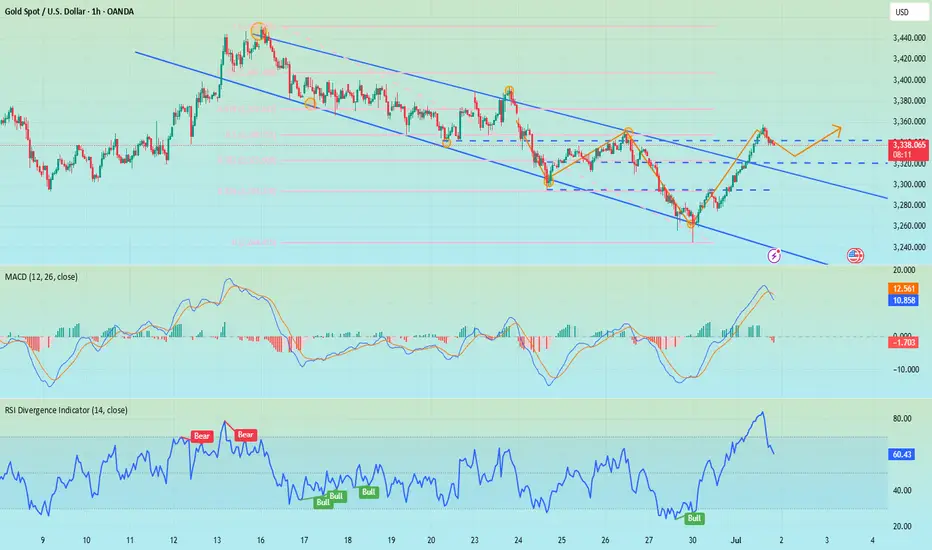
Can gold hit a new high again?During the U.S. trading session, spot gold trended higher in a volatile manner, reaching a three-day high of 3,357.88 as of 22:30. The rally was primarily driven by a weaker U.S. dollar, heightened uncertainty over U.S. trade agreements, and intensified market expectations for Federal Reserve rate cuts. The global economic uncertainties have highlighted gold's safe-haven value. Market participants should monitor the negotiation progress ahead of the tariff deadline on July 9. Traders have priced in at least two rate cuts in 2025. This Thursday's U.S. employment report may catalyze a decline in U.S. Treasury yields. Trump plans to replace Powell, demanding that the new chairman supports rate cuts. The market is focused on this week's ADP and non-farm payroll data to gauge the Fed's policy trajectory.
From a 4-hour technical perspective, the MACD has formed a bullish divergence, triggering a rebound with expanding red histogram bars. Prices are advancing along short-term moving averages, breaking through the previous range of resistance levels, indicating a short-term bullish trend. Before the non-farm payroll data, prices are expected to remain range-bound, with attention paid to safe-haven demand triggered by geopolitical risks. Focus on the opportunity for a secondary rally after the end-of-session pullback confirmation. Short-term resistance is seen at the 3,375-3,380 zone.
On the hourly chart, prices are in a narrow high-range consolidation with limited pullback momentum. Candlesticks maintain strength by relying on short-term moving averages.
you are currently struggling with losses,or are unsure which of the numerous trading strategies to follow,You have the option to join our VIP program. I will assist you and provide you with accurate trading signals, enabling you to navigate the financial markets with greater confidence and potentially achieve optimal trading results.
Trading Strategy:
buy@3330-3335
TP:3360-3365
XAU/USD Start July 20251. i start after XAU/USD break previous High and correction (fibbo 32.0) respected. based on elliot wave strategy we can targeting end of wave 3 at 3353 area and than correction wave 4 (target at fibbo 32.0 - 50.0). after target correction, continue wave 5 at target 3403 area.
2. fundamentally speaking, new months new quarter. there ins't new catalist and sentiment. Macro Economic this week focus on labour market at US and FED projection to cut rate.
3. War at Iran and Israel, Russia and Ukraine, India and Pakistan, Trade War case, etc,.
4. Will be update

XAU/USD : GOLD AnalysisGold now shifts its direction downward as it was rejected from an hourly Order Block.
I am planning a short position in it, you guys can trade accordingly by managing your risk

Gold price rises by more than $100, will the bull run continue?📰 News information:
1. Geopolitical situation
2. PMI data
3. Global Central Bank Governors Meeting
📈 Technical Analysis:
The NY session is about to begin, and there are two things we need to pay attention to. First, the PMI data, and second, the talks between global central bank governors. If Powell again hints that the inflation outlook is weaker than expected, this will increase the Fed's easing bets and trigger a new round of decline in the US dollar. The dovish tone may help gold prices to further rebound. On the contrary, if Powell makes some hawkish or cautious remarks, this may exacerbate the recent downward trend in gold prices. The key point at present is the 3350 mark. If the 4H closing line of the NY session remains below 3350, then in the short term we are expected to continue to retreat to the 3330-3320 range. If the 4H closing line is above 3350 and stabilizes, gold may rebound to the 61.8% position, which is around 3372.
🎯 Trading Points:
SELL 3340-3350-3355
TP 3330-3325-3320
BUY 3330-3320
TP 3340-3350-3372
In addition to investment, life also includes poetry, distant places, and Allen. Facing the market is actually facing yourself, correcting your shortcomings, confronting your mistakes, and strictly disciplining yourself. I hope my analysis can help you🌐.
FX:XAUUSD FXOPEN:XAUUSD PEPPERSTONE:XAUUSD FOREXCOM:XAUUSD FX:XAUUSD OANDA:XAUUSD TVC:GOLD

Gold Bounces from Demand Zone – Next Targets in Sight!By analyzing the gold chart on the 4-hour timeframe, we can see that today, price once again dipped into our key demand zone (Bullish Rejection Block) between $3245 and $3262, where it faced strong buying pressure and rallied up to $3296.
Currently, gold is trading around $3281, and as long as price holds above $3273, we expect further upside. The next potential targets are $3294, $3300, and $3309.
🎥 If you enjoyed this video analysis and found it helpful, please show your support with a LIKE and COMMENT below!
These video-style breakdowns take time and effort, and I’ll only continue them with your support 🙌
Your engagement is my biggest motivation to keep going 💛
Thanks for being part of the journey!

Gold toushes major trendlinemajor trendline on 1d timeframe
RSI divergence
Reverse of trend HH and HL
Risk 1:2

GOLD Massive Short! SELL!
My dear followers,
This is my opinion on the GOLD next move:
The asset is approaching an important pivot point 3350.4
Bias - Bearish
Safe Stop Loss - 3363.2
Technical Indicators: Supper Trend generates a clear short signal while Pivot Point HL is currently determining the overall Bearish trend of the market.
Goal - 3328.2
About Used Indicators:
For more efficient signals, super-trend is used in combination with other indicators like Pivot Points.
Disclosure: I am part of Trade Nation's Influencer program and receive a monthly fee for using their TradingView charts in my analysis.
———————————
WISH YOU ALL LUCK

International gold prices rise slowly and reach new highsAnalysis of gold trend:
Gold fell sharply near 3247 at the opening of Monday, then stopped falling and began to fluctuate and rise slowly. It rose to a high of 3297 before the European session, then fell back after being blocked. After dropping to 3274, it stabilized again and began to rise slowly. The US session continued to rise. Another key point in the market that everyone needs to pay attention to is that the US dollar index has now hit a new low, and the current price is 96.3. This wave of US dollar decline is extremely weak, and there is basically no sign of rebound. According to this trend, the US dollar index may continue to fall, and it is possible to go to 88. In the case of such a weak US dollar index, it is natural for gold to be supported by the market. Moreover, gold has not yet walked out of the bullish trend. Gold has turned from weakness in the early stage to strength. Next, it depends on the strength of the rise. This wave of rise is expected to see 3350-3400.
From a technical point of view, gold closed positive at a low level on Monday, and the K line was above the lower Bollinger track, turning from weak to strong. Under the bullish trend, the rise can be seen to be continuous, so the high points of the middle and upper Bollinger tracks can be seen above. In the 4-hour chart, the K-line stands firmly above the middle rail of Bollinger, and the moving average system diverges upward, showing a very obvious strong performance. Therefore, the basic idea this week is to continue to do more on the decline. In the short term, first look at the upper rail of Bollinger in the 4-hour chart at 3350. There are two points to pay attention to in the decline of the small cycle within the day, one is 3300, and the other is 3285 support. Although bullish, do not chase high. After the decline, make sure to stop the decline and continue to be bullish. Operation strategy: Go long when gold falls back to around 3320, stop loss at 3210, and target 3330-3340.

Gold intraday trading strategyFrom the 4-hour analysis, the focus on the upper side is the 3324 line of the bull-bear watershed pressure, and the short-term support on the lower side is the short-term pressure around 3295-3301 yesterday. The overall support relies on this range to maintain the main tone of high-altitude and low-multiple participation unchanged.
Gold operation strategy:
1. Short gold at 3321-24, stop loss at 3332, target at 3295-3301, continue to hold if it breaks;
2. Long gold at 3295-3301, stop loss at 3287, target at 3320-24, continue to hold if it breaks;
