GOLD GOES 'PREPARING FOR SCORCHING-HOT JULY'. UPSHOT OF 1H 2025Gold market shines bright in first half of 2025, with nearly 25 percent year-to-date gain, which becomes one of the best start of the year in history ever following 1H 2016 (became a launching pad for Gold to more than Triple in price over next decade) and 1H 1973 (where Gold bugs sharply skyrocketed to infinity and beyond, printed more than 10x over next decade).
The gold spot market in July 2025 is shaped by both fundamental and technical factors supporting a cautiously bullish outlook.
Fundamental perspectives
Were you ready or not, Gold prices have surged significantly in 2025, driven by persistent global uncertainties including geopolitical conflicts (e.g., Middle East tensions), trade disputes, and inflation concerns.
Central banks, notably the Federal Reserve, are expected to cut interest rates later in 2025, reducing the opportunity cost of holding gold, a non-yielding asset. This monetary easing alongside continued inflation worries and safe-haven demand underpins strong gold fundamentals.
Major financial institutions like J.P. Morgan and UBS forecast gold prices averaging around $3,500–$3,675 per ounce in late 2025, with potential to reach $4,000/oz by mid-2026.
Central bank gold purchases and diversification away from US dollar assets also support demand.
Technical perspectives
Technically, gold has experienced volatile but mostly sideways trading in a roughly $300 range around $3,200–$3,500 since mid-2025, reflecting consolidation after a strong rally earlier in the year.
Key support lies near $3,000 and $3,200 levels (125-Day, or 6-Month SMA), with resistance around $3,500 to $3,800. Indicators such as moving averages and RSI suggest an upward trend with possible short-term corrections.
A breakout above $3,500 could trigger further gains toward $3,800, while a drop below $3,200 may lead to testing $3,000 support.
Overall, July is expected to see continued range-bound trading amid new external uncertainties, with bullish momentum intact.
In summary, gold’s fundamentals remain robust due to macroeconomic and geopolitical drivers, while technicals point to consolidation with potential for renewed upward moves in the July 2025 spot market.
--
Best #GODL wishes,
@PandorraResearch Team 😎
Xauusd(w)

XAUUSD 01 July - Price pushing into premium zone 🔹 Macro Structure:
Gold has successfully broken structure (BOS) after forming a bullish shift in market structure (MSS) around the 326x – 327x zone.
Current price action is respecting internal bullish order flow, with higher highs and higher lows being maintained.
Breakout above 3300 psychological level + recent BOS confirms bullish intent.
🔹 Liquidity Map:
Buy-side liquidity is still resting above 3350 and into the strong OB at 3388, where a potential sell-side reaction could occur.
Sell-side liquidity below 3267 has not been swept recently, meaning deeper retracements may still occur after internal liquidity is cleared.
🔹 Expectation:
Current wave is likely in impulse phase (Wave 3 → Wave 5) aiming for 3388 OB.
A retracement into the discount zone (3301 – 3303 OB) is ideal for a continuation trade.
Watch for bearish signs near 3388 – this zone aligns with high liquidity, strong OB, and trendline confluence.
🔵 BUY SETUP (Retracement entry – continuation)
Buy Zone: 3301 – 3303 OB
Entry Trigger: Bullish engulfing / FVG fill
Stop Loss: Below 3297 (below recent swing low)
Targets: 3306 – 3310 – 3315 – 3320 – 3330 – 3346 – 3388
🔴 SELL SETUP (Reversal entry – premium zone)
Sell Zone: 3348 – 3350 (mitigation area)
Entry Trigger: CHoCH + bearish rejection wick
Stop Loss: Above 3354
Targets: 3344 – 3340 – 3335 – 3325 – 3310 – 3300
✅ Alternative Entry (Low sweep)
Buy Limit: 3270 – 3267 (deep OB + SSL zone)
SL: 3262
TP: 3280 – 3290 – 3300 – 3315+
⏳ Wait for price to confirm intention via structure + liquidity reaction before entering trades.
🧠 SMC traders: focus on manipulation zones, OBs, and internal BOS for precision entries.

Gold (XAU/USD) Technical Outlook — July 1, 2025In the world of financial markets, few assets capture global attention like gold. A timeless store of value, gold continues to act as both a hedge against uncertainty and a battleground for technical traders seeking high-probability setups. As of today, gold (XAU/USD) is trading at $3328, a level that places it just beneath the most recent multi-month high at $3345. The recent surge in price is underpinned by both macroeconomic factors and bullish technical structure. However, as any seasoned trader knows, trends rarely move in straight lines — and gold is now approaching a technically sensitive juncture.
I. Gold’s Structural Landscape on the 4-Hour Chart
The four-hour chart reveals a textbook bullish trend. Beginning with a significant impulse from the $3194 base, gold has climbed steadily, printing higher highs and higher lows. The most recent break of structure (BOS) above $3312 confirmed the continuation of bullish intent, while the market remains firmly above key swing lows — signaling that the bullish regime has not yet been invalidated.
Price action shows clean, impulsive expansions followed by short consolidations, with buyers continuing to absorb supply at every retracement. Despite that strength, gold has now reached a potential exhaustion point, with the price reacting to overhead supply at $3345–3355, forming what could be an early-stage distribution zone.
Key Market Structure Developments:
BOS at $3312: confirms uptrend
No CHoCH (Change of Character) yet — no confirmed bearish reversal
Clean liquidity grab above $3345, followed by rejection — hinting at short-term profit-taking or internal bearish intent
II. The Fibonacci Grid: Retracement and Extension Zones
Applying Fibonacci retracement from the $3194 swing low to the $3345 high offers crucial levels of interest. The golden ratio at 61.8% ($3253) aligns perfectly with prior demand and a 4-hour bullish order block. Similarly, the 38.2% level at $3285 corresponds with a minor liquidity pool and potential reaccumulation base.
Fibonacci Level Price
23.6% $3308
38.2% $3285
50.0% $3269
61.8% $3253
78.6% $3228
On the extension side, should gold resume its rally beyond $3345, projected Fibonacci targets sit at $3372 (127.2%) and $3410 (161.8%), with both acting as measured projections for trend continuation.
III. Supply and Demand: Mapping Institutional Footprints
Institutional activity is best observed through unmitigated supply and demand zones — areas where large orders caused rapid price displacement. Gold currently trades between two such zones:
Demand Zone: $3250–$3260 — a sharp bullish rejection occurred here on the last visit, indicating strong buy-side interest and likely pending buy orders
Supply Zone: $3345–$3355 — where a sell-side liquidity grab recently occurred, followed by a strong rejection candle
These two zones bracket the market and serve as the highest probability areas for future reactions.
IV. The Smart Money Concepts (SMC) Framework
SMC theory revolves around observing the footprints of large market participants — often labeled “smart money.” In gold’s current structure, SMC tools provide a clearer roadmap than standard indicators.
Current Observations:
Break of Structure (BOS): Confirmed at $3312 (bullish continuation)
Change of Character (CHoCH): Absent (bull trend intact)
Buy-Side Liquidity Grab: Above $3345 — trapped breakout buyers likely fuel for reversal
Sell-Side Liquidity Pool: Uncollected beneath $3280 — probable magnet for a liquidity sweep
Fair Value Gap (FVG): Between $3260 and $3280 — price inefficiency offering high-probability reentry for smart money
Bullish Order Block (OB): At $3250–$3260 — final down candle before explosive up move, unmitigated
All these elements point to a high-probability pullback, rather than a full-blown reversal. Until structure is broken with a CHoCH, the base case remains bullish.
V. High-Probability Levels for 4-Hour-Based Opportunities
From this framework, we identify the following key price levels:
The highest-probability reaction is expected at $3250–$3260, where smart money is likely to re-engage if price retraces.
VI. Refinement on the 1-Hour Chart: Intraday Trade Setups
Zooming into the 1-hour chart allows us to fine-tune our execution strategy. Gold is consolidating just below $3330, forming what appears to be an ascending triangle — a common bullish continuation structure — but within the broader context of a possible short-term pullback.
Intraday Trade Idea #1 — High-Conviction Long
Entry: $3260
Stop-Loss: $3245
Take-Profit 1: $3308
Take-Profit 2: $3340
Risk–Reward: ~1:4
Rationale: Aligned with 4H demand, fair value gap, OB, and golden ratio retracement. Structure remains bullish.
Intraday Trade Idea #2 — Speculative Short (Low Conviction)
Entry: $3340–$3350
Stop-Loss: $3362
TP1: $3305
TP2: $3285
Risk–Reward: ~1:2.5
Rationale: Countertrend, only viable if bearish rejection candle forms. Not aligned with dominant 4H structure.
VII. The Golden Setup: Long from Demand + FVG Confluence
Among all technical configurations, the long setup at $3260 emerges as the most compelling. It is supported by:
An unmitigated bullish order block
A clear fair value gap
61.8% Fibonacci retracement
Untouched sell-side liquidity below
Directional alignment with trend
Institutional demand pattern
This setup offers both superior risk-to-reward and a technical foundation that aligns with Smart Money’s modus operandi. It represents a low-risk, high-reward opportunity for traders who wait for price to re-enter the value zone and confirm with bullish order flow (e.g., a bullish engulfing or BOS on 15m).
VIII. Final Thoughts and Tactical Summary
As of July 1, 2025, the gold market reflects strong bullish momentum, albeit entering a corrective phase that should not be mistaken for reversal. While intraday volatility and range compression may tempt countertrend trades, the smartest play remains to wait for a discounted reentry into a zone of value.
Until structure shifts significantly, the dominant trading thesis remains: “Buy the dip into institutional zones”. Patience, not aggression, will separate the retail trader from the professional in today’s complex market structure.

XAUUSD Long Setup – Watching 3247 Entry ZoneHi Traders,
The recent price action of XAUUSD has been a bit complex, but I hope this idea turns out to be profitable for everyone.
Feel free to share your thoughts if you see anything differently.
What I find most interesting is the entry zone around 3247–3245 . If we take the wave count starting from May 15, 2025 (3120.76) and consider wave 5 to be completed on June 15, 2025 (3451.52), then wave 2 should ideally retrace to around 3247.
On top of that, wave C of wave 2 seems to follow a clean 1–2–3–4–5 structure. If we treat the current move as a downtrend, wave 5 would likely complete right at 3247, which I find both accurate and technically compelling.
I'll be watching 3247 closely and plan to go long from there.

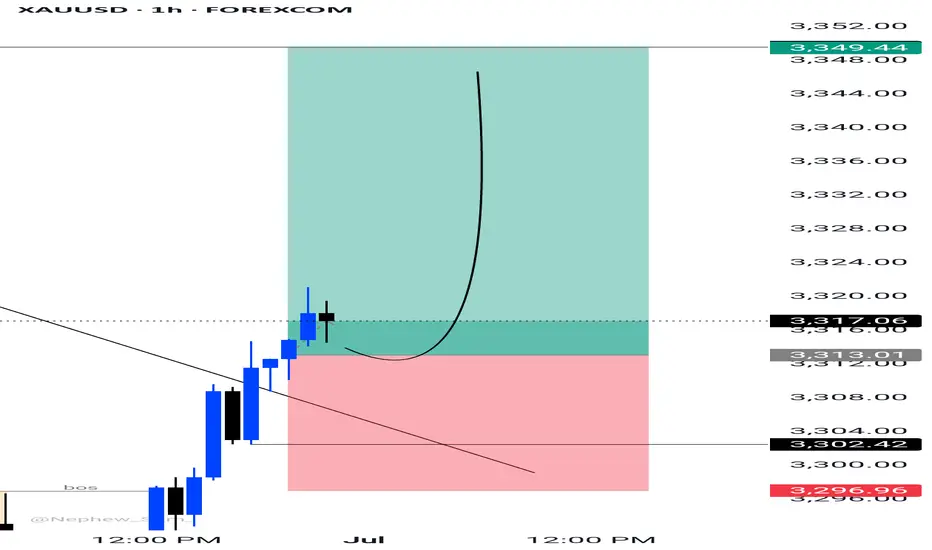
XAUUSD 15MIN - Bullish Setup I Trade Plan Above 3349This chart presents a carefully planned intraday buy opportunity on XAUUSD (Gold vs. US Dollar), focusing on short-term bullish price action.
📍 Key Levels & Setup Logic:
Buy Entry Zone: 3350
A strong potential demand area based on recent market structure. The price is expected to bounce from this level if bullish pressure sustains.
No Trading Zone: 3337–3349
This zone marks an area of high volatility and indecision. Traders are advised to avoid initiating trades within this range to prevent premature entries and whipsaws.
TP 1 – 3374.35:
First take profit level aligning with minor resistance and past consolidation.
TP 2 – 3390.91:
Second take profit target based on resistance zone and Fibonacci confluence.
Re-Entry Point:
If the price breaks and holds above 3397, a buy-side re-entry is valid at 3398, targeting continuation toward higher resistances.
TP 3 – 3420 & TP 4 – 3445 (Reversal Zone):
Strong resistance and potential exhaustion/reversal zone. Monitor price action closely here for signs of trend weakening.
SL- Previous Swing Low.
⚠️ ZONES:
🔴 No Trading Zone: 3337–3349 (Avoid trades in this range — potential indecision zone)
🔴 Reversal Zone: Near 3445 — monitor price action for potential exhaustion.
📌 Technical Commentary:
Structure favours upside as long as price sustains above the No Trading Zone.
Clean higher-low formation suggests momentum shift.
If price confirms break above 3397 resistance, bullish continuation toward 3445 is highly probable.
🔍 Trade Summary:
Strategy: Buy on Breakout & Pullback
Confirmation: Bullish bounce from 3350 or breakout above 3397
Risk Management: Avoid trades within 3337–3349; reassess if price falls below this zone
Profit Targets: Laddered exits at 3374.35, 3390.91, 3420, 3445
⚠️ Disclaimer & Important Note:
This analysis is for educational and informational purposes only. It does not constitute financial advice or a recommendation to buy or sell any financial instrument. All trading involves risk. We are not responsible for any kind of loss incurred, whether financial, emotional, or otherwise. Always do your own research and consult with a licensed financial advisor before making any trading decisions.
Trading involves significant risk, and you should never invest more than you can afford to lose. Past performance is not indicative of future results.
The trade idea shared above reflects personal market interpretation and is subject to change based on new market conditions.
📍Posted by: THEPATELCRYPTO
📈 Stay safe. Trade smart.
🔔 Follow for more ideas!

Gold Tests 6-Month TrendGold is attempting to find support at the yellow trendline below, which has held since late December. At today’s open, gold quickly found support at that level, which is a bullish signal. However, it may not be over yet.
For gold to recover meaningfully, it needs to break above the 3300 resistance first, followed by 3345 to confirm a move higher. This week, the U.S. Senate will discuss the "Big, Beautiful Bill," which markets expect will widen the deficit, despite Trump’s claims to the contrary. Regardless of the outcome, the discussion could provide gold with the fuel it needs to rebound after its weak performance in the second half of June.
Gold Short Term OutlookYesterday, we noted that gold was attempting a recovery from the Support Zone but remained below both the 50 and 200 MAs, meaning bearish pressure was still intact.
Since then, price has broken and held above $3,298, and is now trading around $3,330, just beneath the 200MA.
This marks a shift in short-term momentum — gold has reclaimed the 50MA and is now challenging the 200MA.
If bulls manage to break and hold above the $3,327 resistance, it could open the path toward $3,352 - $3,364 and potentially higher resistance zones.
However, if price rejects the 200MA and fails to hold above $3,327, we may see a pullback toward $3,298 or deeper into $3,270, where bulls could look to reload.
📌 Key Levels to Watch:
Resistance:
$3,327 • $3,364 • $3,383 • $3,400
Support:
$3,298 • $3,270 • $3,241
🧠 Fundamental Focus:
📌 Fed Chair Powell speaks today at the ECB Forum in Portugal.
Markets will closely watch for any shift in tone on inflation or rate outlook. His comments may influence USD direction and gold volatility.
📌 ISM Manufacturing PMI – a key gauge of economic activity. A strong print may pressure gold; a weak reading could support it.
📌 JOLTS Job Openings – offers insight into labor market strength. A tighter market could delay rate cuts and weigh on gold.
With multiple risk events packed into today, expect increased volatility across the board.

Smart Money Concepts or Inner Circle Trade methodologies.Key Zones and Annotations
FVG (Fair Value Gap) – Marked in green:
Represents an imbalance in price (gap between candles).
Price often returns here to “fill” or mitigate that inefficiency.
BSL (Buy-Side Liquidity) – Marked in blue near the $3,340 area:
Indicates an area above recent highs where stop-losses (liquidity) might be resting.
This area is often targeted before reversals.
SSL (Sell-Side Liquidity) – Marked in red near the $3,270 area:
Represents liquidity below recent lows.
This is a potential bearish target.
Structure Labels
LL (Lower Low), LH (Lower High), HH (Higher High), HL (Higher Low):
Used to track market structure direction (bearish/bullish trend).
ChoCH (Change of Character):
Indicates a shift in market structure, typically a sign of a trend reversal.
Price Projection
The projected path shows a short-term move upward toward the BSL region (~$3,340), suggesting liquidity grab or premium pricing area.
Then, a bearish reversal is projected targeting the SSL zone (~$3,270), suggesting a potential drop after the BSL is taken.
Conclusion
The chart suggests a short-term bullish move to clear buy-side liquidity followed by a bearish continuation targeting lower liquidity zones. This type of analysis is commonly used in Smart Money Concepts (SMC) or ICT (Inner Circle Trader) methodologies.

Gold is rising. Second starting point?Information summary:
1. The US dollar index has experienced the longest consecutive monthly decline since 2017. The weakening of the US dollar has increased the attractiveness of gold denominated in US dollars to non-US dollar holders, becoming an important support factor for gold prices.
2. Trump's continued pressure on the Federal Reserve to cut interest rates has formed a resonance effect with the weakening of the US dollar, which has jointly pushed up the short-term attractiveness of gold.
Multiple factors are intertwined, and gold has risen slightly again.
Market analysis:
Gold bottomed out and rebounded on Monday, showing a positive closing, and above 3300. After falling sideways for 5 consecutive trading days last week, although it fell for a short time on Monday, it did not continue. In this case, whether a new high can be reached, the watershed is the 3295 line. As long as the European session breaks the high, the long position is near the starting point of 3305 in the early trading session.
At present, the main focus is on the upper resistance around 3325. It opened directly upward on Tuesday, but did not break through too much space, unless it directly broke through 3325-3330; then the next resistance is around 3340. At present, the bulls are still running at a high level. The upward trend line generated after the reversal is more obvious, and the trend line has good effectiveness.
Since the current market is in the first wave of rise, the high point has not been confirmed. Quaid believes that when the high point is clear and the price falls back to the support area, consider entering the market to go long based on the support level. Of course, aggressive trading can choose to buy around 3320 and choose a suitable high point to take profit.
Operation strategy:
Short near the rebound 3340, stop loss 3350, profit range 3310-3300
Long near the fall 3305, stop loss 3290, profit range 3320-3335

"Gold at a Crossroads! Bullish or Bearish? (Trade Plan)"🦹♂️💰 "Gold Heist Alert: XAU/USD Bullish Raid or Bearish Ambush?" 💰🦹♂️
🌍 Greetings, Market Pirates & Profit Raiders! 🌍
(Hola! Oi! Bonjour! Hallo! Marhaba!)
Based on the 🔥Thief Trading Method🔥, here’s our strategic heist plan for XAU/USD (Gold vs. Dollar). Follow the chart markings for high-probability loot zones—whether you're a bullish bandit or a bearish burglar! 🏴☠️💸
🎯 Entry Strategy (Where to Strike)
"The treasure is ripe for taking! Breakout = GO TIME!"
✅ Long Entry (Bullish Raid): Jump in at current levels if the uptrend holds.
✅ Short Entry (Bearish Ambush): Wait for a break & close below 3280.00 (confirms downtrend).
🛑 Stop Loss (Escape Route)
🚨 For Bulls: Bail out if price hits 3240.00 (SL tightens if trend strengthens).
🚨 For Bears: Retreat if price surges past 3360.00 (only activate SL post-breakout!).
🎯 Take Profit (Loot & Scoot!)
💰 Bullish Thieves: Aim for 3600.00 (or exit early if momentum fades).
💰 Bearish Bandits: Target 3125.00 (or escape before the cops—err, reversal—arrives).
📡 Market Intel (Why This Heist?)
Gold’s in a neutral zone (but bulls have the edge! 🐂📈). Key factors:
Macroeconomic shifts
COT data clues
Sentiment & seasonal trends
(Full breakdown in the chart notes—klick the 🔗! 🔍🌐)
⚠️ Danger Zones (News & Risk Control)
🚨 High-Impact News = NO NEW TRADES!
🚨 Protect open positions: Use trailing stops to lock in profits.
🚨 Adjust SLs if volatility spikes!
💥 Boost the Heist! 💥
Like & Share to fuel our next market robbery! 🚀💰
Follow for more lucrative trade setups—coming soon! 👀🔥
🎯 Trade Smart, Steal Smarter! 🦹♂️💎

GoldHere's an analysis based on the information presented in the image:
Overall Market Structure (from a quick glance):
Recent Price Action: The price has recently experienced a significant decline, followed by a bounce.
Order Block (OB): There's a clearly marked "4 Hours OB" (Order Block) which is a key area of interest for potential resistance.
Potential Trading Setup:
Entry: The "Entry" price is set at 3,340.00. This entry point is within the bearish order block, suggesting a short (sell) position.
Stop Loss (S/L): The "S/L" is placed at 3,352.00. This is above the high of the 4-hour order block, aiming to limit losses if the price moves against the short position and breaks above the resistance.
Take Profit (Profit): The "Profit" target is set at 3,296.00. This target is significantly lower than the entry, aiming to capture a downward movement.
Risk-Reward Ratio:
Risk: The difference between the entry (3,340.00) and the stop loss (3,352.00) is 12 points.
Reward: The difference between the entry (3,340.00) and the take profit (3,296.00) is 44 points.
Ratio: This implies a risk-reward ratio of approximately 1:3.67 (44 / 12), which is generally considered favorable.
Key Technical Concepts Illustrated (from the inset image):
The smaller inset image on the left illustrates concepts commonly used in Smart Money Concepts (SMC) or Institutional Order Flow (IOF) trading:
Order Block (OB): A price range where significant institutional buying or selling occurred, often leading to price reversals. The red box indicates a bearish order block.
Entry: The point at which a trade is entered.
FVG (Fair Value Gap) / Imbalance: An area on the chart where price moved quickly in one direction, leaving an "inefficiency" or gap that price often retests.
CHoCH (Change of Character): An early sign of a potential trend reversal, indicating a shift in market sentiment.
BOS (Break of Structure): When price breaks a significant high (for a bullish trend) or low (for a bearish trend), confirming the continuation or reversal of a trend. The multiple "BOS" labels suggest a series of lower lows, confirming a bearish trend.
BERISH DISPLACEMENT: Implies strong bearish momentum leading to lower prices.
PRLII S: This specific acronym is not universally recognized but could refer to a specific pattern or setup within the trader's methodology, possibly related to liquidity or price action.
Conclusion/Potential Interpretation:
The chart suggests a bearish outlook for XAUUSD, with the trader looking to short Gold at the retest of a 4-hour bearish order block. The setup has a favorable risk-reward ratio. The concepts in the inset image provide a theoretical framework for why this particular entry and targets might be chosen, based on institutional trading principles. The current price is at 3,322.285 at 08:33:38 +04, which is below the proposed entry, suggesting this might be a setup that the trader is waiting to happen or a retrospective analysis of a potential trade idea.

XAUUSD 15min – Bearish Setup | Short Trade Plan Below 3328Price action on Gold (XAUUSD) is showing signs of exhaustion near the 3,328 resistance zone, where we anticipate potential bearish rejection. A short opportunity may unfold once confirmation occurs below the key structural level of 3316.
Sell Trade Setup:
🔹 Primary Entry (Sell Entry 1):
📍 Zone: Around 3,328.29
📌 Reaction expected near major supply & resistance zone.
🔹 Confirmation Entry (Sell Entry 2):
📍 Below 3,316
📌 Break below structure may trigger bearish momentum.
Targets:
🎯 TP 1: 3,296.97 (Initial reaction zone)
🎯 TP 2: 3,276.64 (Mid support/EMA cross zone)
🎯 TP 3: 3,259.88 (Key structural support)
🎯 Extended TP:
3,243.94 (Re-entry confirmation level)
3,225.53 (Prior base structure)
3,202.45 (Final target if strong momentum follows)
3,159.31 (Ultimate low if sellers dominate trend)
Re-Entry Plan:
🔄 If price retraces after TP 3, watch for rejection at 3,243.94 to re-enter short toward the next levels.
Confluence Factors:
✔ 45° TPC angle supports bearish path
✔ Structure break expected below 3316
✔ EMA resistance and trendline rejection from upper zone
✔ Volatility cluster observed near 3,328 – ideal for trap setup
Bias:
Bearish below 3,316 – Expecting a downward continuation if structure confirms breakdown.
Author:
📅 1 July 2025
📊 Chart: XAUUSD – 15min
🧠 Shared by: @THEPATELCRYPTO

XAUUSD/ GOLD M45 OUTLOOK XAUUSD 45M 🚀
Trendline broken — bulls in control!
Above 3317, aiming for 3349+
SL: 3296 🔒 | TP: 3349 🎯
Stay sharp, lock profits! ⚡️✨
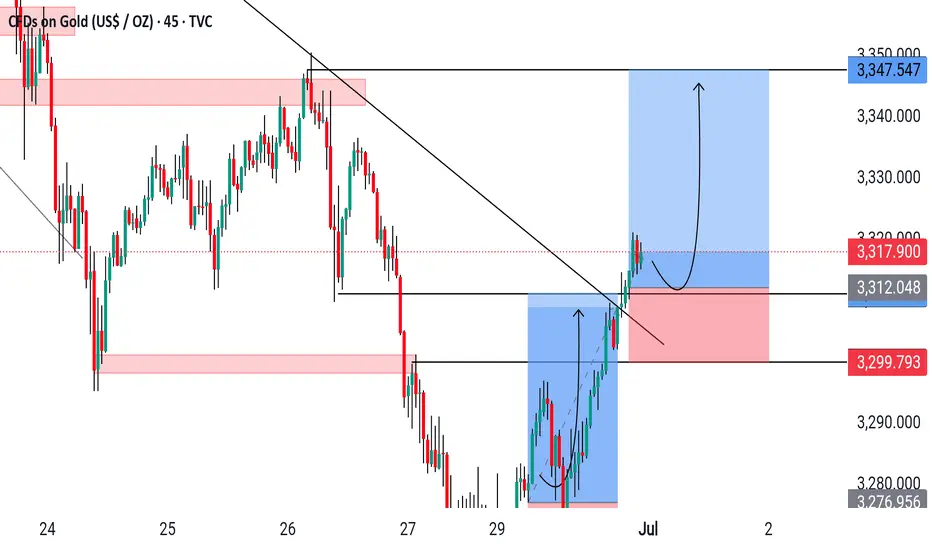
XAUUSD H1 Outlook XAUUSD 45M 🚀
Trendline broken — bulls in control!
Above 3317, aiming for 3349+
SL: 3296 🔒 | TP: 3350 🎯
Stay sharp, lock profits! ⚡️✨
XAUUSD H1 I Bearish Drop Based on the H1 chart analysis, we can see that the price is trading near our sell entry at 33192, which is a pullback support.
Our take profit will be at 3297.07, a pullback support.
The stop loss will be placed at 3350.85, which is a swing high resistance.
High Risk Investment Warning
Trading Forex/CFDs on margin carries a high level of risk and may not be suitable for all investors. Leverage can work against you.
Stratos Markets Limited (tradu.com ):
CFDs are complex instruments and come with a high risk of losing money rapidly due to leverage. 63% of retail investor accounts lose money when trading CFDs with this provider. You should consider whether you understand how CFDs work and whether you can afford to take the high risk of losing your money.
Stratos Europe Ltd (tradu.com ):
CFDs are complex instruments and come with a high risk of losing money rapidly due to leverage. 63% of retail investor accounts lose money when trading CFDs with this provider. You should consider whether you understand how CFDs work and whether you can afford to take the high risk of losing your money.
Stratos Global LLC (tradu.com ):
Losses can exceed deposits.
Please be advised that the information presented on TradingView is provided to Tradu (‘Company’, ‘we’) by a third-party provider (‘TFA Global Pte Ltd’). Please be reminded that you are solely responsible for the trading decisions on your account. There is a very high degree of risk involved in trading. Any information and/or content is intended entirely for research, educational and informational purposes only and does not constitute investment or consultation advice or investment strategy. The information is not tailored to the investment needs of any specific person and therefore does not involve a consideration of any of the investment objectives, financial situation or needs of any viewer that may receive it. Kindly also note that past performance is not a reliable indicator of future results. Actual results may differ materially from those anticipated in forward-looking or past performance statements. We assume no liability as to the accuracy or completeness of any of the information and/or content provided herein and the Company cannot be held responsible for any omission, mistake nor for any loss or damage including without limitation to any loss of profit which may arise from reliance on any information supplied by TFA Global Pte Ltd.
The speaker(s) is neither an employee, agent nor representative of Tradu and is therefore acting independently. The opinions given are their own, constitute general market commentary, and do not constitute the opinion or advice of Tradu or any form of personal or investment advice. Tradu neither endorses nor guarantees offerings of third-party speakers, nor is Tradu responsible for the content, veracity or opinions of third-party speakers, presenters or participants.

XAUUSD – Technical pullback before a breakout?On the 4H chart, gold is consolidating just below the descending trendline after a correction from $3,389 to the support zone at $3,252. The current price structure suggests continued range-bound movement between $3,252 and $3,318 before a potential breakout. If price breaks above the trendline, the next target could be the resistance zone at $3,389.
From a news perspective, the easing of Iran–Israel tensions has slightly reduced safe-haven demand, putting short-term pressure on gold. However, the US dollar remains at a 3-year low, and concerns over the US government’s $3.3–3.9 trillion tax reform package are fueling fears of a widening deficit—both of which support a bullish outlook for gold.
In summary, watch how price reacts to the trendline. A confirmed breakout could send gold surging toward the $3,389 zone.

Gold Trading Strategy for 500 Pips !Dear friends!
The exit from the bearish channel has led to an impressive price increase. At the time of writing, the financial market is trading above the $3,300 mark. The uptrend is very strong as it consolidates at high levels with stable trading activity on the 2-hour time frame.
Therefore, the upcoming reports on US employment and manufacturing are highly anticipated. This has contributed to the market being hotter than ever. The price increase is expected to reach $3,385, if the Fed signals monetary policy easing. What do you think about this? Do you agree with me?

The latest analysis and layout of gold in July made a good start📰 News information:
1. Geopolitical situation
2. PMI data
📈 Technical Analysis:
Yesterday, we gave the idea of looking at the upper resistance of 3310-3320. The 4H pressure is still at 3327. As long as this key resistance level is not effectively broken, gold will fall again. On the contrary, if it stabilizes above 3327, the trend may reverse. In the short term, pay attention to the upper resistance of 3327. If it is not broken, you can short with a light position. If it falls below 3300-3290, consider going long.
🎯 Trading Points:
SELL 3310-3320
TP 3305-3300
BUY 3300-3290
TP 3310-3320-3350
In addition to investment, life also includes poetry, distant places, and Allen. Facing the market is actually facing yourself, correcting your shortcomings, confronting your mistakes, and strictly disciplining yourself. I hope my analysis can help you🌐.
TVC:GOLD FXOPEN:XAUUSD PEPPERSTONE:XAUUSD FOREXCOM:XAUUSD OANDA:XAUUSD TVC:GOLD

The limit is 3320. Rebound and still short📰 News information:
1. Gold market liquidity at the end of the month
2. Impact of geopolitical situation
📈 Technical Analysis:
Currently, gold has rebounded to around 3295, reaching our ideal trading area. I have given the short-selling trading idea in the previous post. At present, in the short term, we still maintain the short-selling trading idea before effectively breaking through the upper resistance. Focus on the 3325 line of resistance
🎯 Trading Points:
SELL 3295-3310-3320
TP 3285-3270
In addition to investment, life also includes poetry, distant places, and Allen. Facing the market is actually facing yourself, correcting your shortcomings, confronting your mistakes, and strictly disciplining yourself. I hope my analysis can help you🌐.
OANDA:XAUUSD FOREXCOM:XAUUSD FX:XAUUSD PEPPERSTONE:XAUUSD FXOPEN:XAUUSD TVC:GOLD

Exclusive operation suggestions for future market trends!!!Gold bottomed out and rebounded on Monday, so wait patiently for room for future gains. Technically, from the current hourly chart, the gold entity has always been above 3278, and it only pierced through 3275 and then began to rebound. If the retracement does not break the 618 position, there will inevitably be a high point in the future. So next, we should focus on the vicinity of 3280. If gold always closes above 3280, then the high point of 3297 on Monday is likely to be refreshed. Secondly, from the perspective of 123 seeking 4, if it goes up again, it is very likely to touch around 3310. 3310 is exactly around 618. And it is also the top position of this hourly chart range. Therefore, gold should be shorted above 3280 with caution, and the probability of touching above 3300 is very high. In terms of operation, it is recommended to directly enter the market to go long near 3280, and look at 3310-3320. If you want to short, you must wait at least for 3310-3320 before you can enter the market to short once.

GOLD, back at higher base. BUY at 3250 enroute to ath 3500 / 4k.GOLD had a wonderful run this past few seasons grinding up a series of ATH taps every higher baselines since 1500.
After goin to a new parabolic highs of 3500 ATH, GOLD did hibernate a bit and got trimmed back to 3240 levels -- a precise 61.8 FIB tap. This is where most buyers converge, and position themselves on the next run up.
The next ascend series will be far more generous eyeing new higher numbers never before seen. Ideal seeding zone is at the current price range of 3250.
Current higher lows on momentum metrics has been spotted conveying intense upside pressure as it moves forward.
Spotted at 3250
Interim target at 3500 ATH
Long term: 4000
TAYOR.
Trade safely. Market will be market.
Not financial advice.

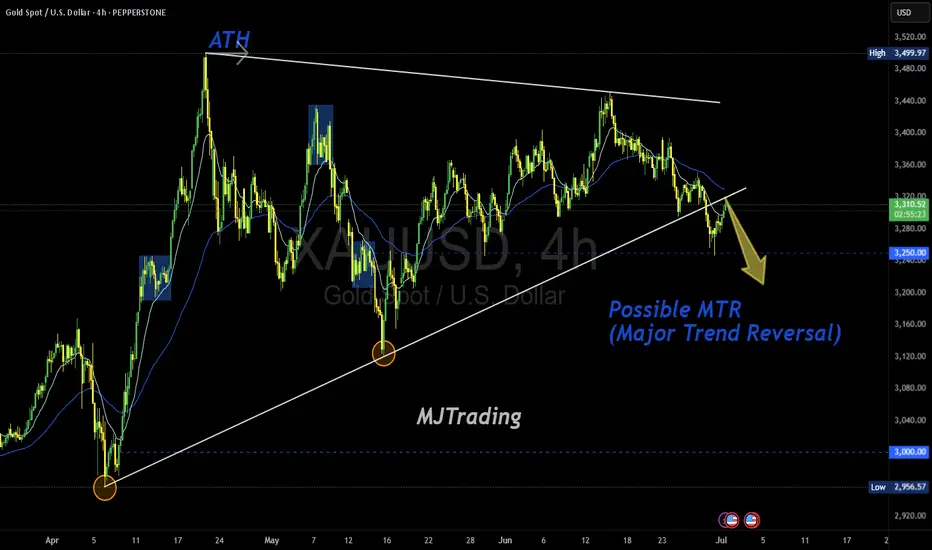
Possible MTR in Play (TBC)Gold has printed a textbook structure for a potential Major Trend Reversal (MTR) off the ATH zone, with a clean rejection and a shift in character. The descending trendline from the top aligns with lower highs, while the ascending base from April is now under pressure.
📌 Key Levels to Watch:
3,280.0 – neckline of the potential MTR
3,250.00 – psychological magnet and structural support
3,000.00 – major downside target if the reversal confirms
🧠 “Markets top on euphoria, not logic.” If price breaks and retests the neckline with momentum, the MTR thesis gains traction. Until then — TBC.
#XAUUSD #Gold #MajorTrendReversal #MTR #PriceAction #TechnicalAnalysis #GoldBears #ATHRejection #TrendShift #MJTrading
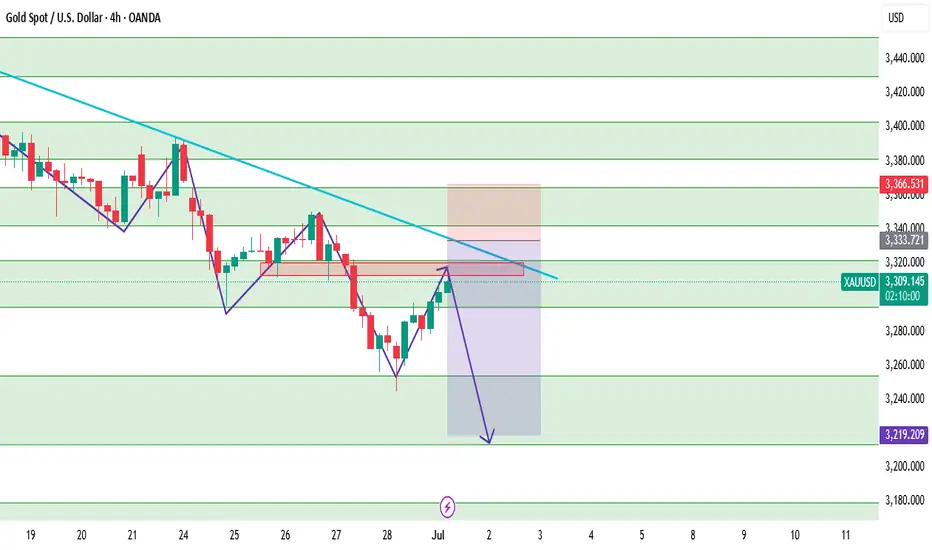
XAUUSD – Technical Outlook 4HXAUUSD is currently undergoing a corrective move after last week's bearish continuation. Price is now testing the minor resistance zone of 3295–3322, and could potentially extend the correction to test the descending trendline near 3333–3342.
The overall market structure remains bearish, with lower highs and lower lows clearly intact. Price has yet to break above the dynamic resistance trendline or the key swing high at 3366 — making any bullish move at this stage corrective, not a reversal.
Unless we see a strong bullish break and close above 3366, we expect sellers to return once price reaches the trendline or supply area around 3333–3342.
📌 Trade Plan (Sell on Pullback)
Sell Limit: 3333–3342
SL: 3368
TP1: 3296
TP2: 3255
TP3: 3220
📊 Key Levels:
R2: 3342
R1: 3322
Pivot: 3295
S1: 3254
S2: 3214
S3: 3180
Summary: Wait for bearish confirmation at the supply zone before entering. Bias remains bearish until proven otherwise by a structural break above 3366. Use smaller lot size or scale in slowly if price approaches the sell zone with weak bullish momentum.