Gold fluctuated and fell, and the rebound was directly short
📣Gold News
Due to the easing of the situation in the Middle East, gold has fallen in the past few days, and the market has been eagerly looking forward to the interest rate cut, because the tariffs in the Trump era may push up inflation, but it has not come yet. "
On Thursday, the U.S. Department of Labor and Commerce issued key economic data, including initial jobless claims and the final value of real GDP in the first quarter. The number of initial jobless claims was 236,000, a decrease of 9,000 from 245,000 in the previous week, better than the market expectation of 245,000. At the same time, as of June 14, the number of continued unemployment claims in the week increased by 37,000 to 1.974 million, a new high since November 2021. Gold stopped below the moving average today. Gold did not continue the small positive line rise, and the decline continued during the U.S. trading period.
Today, focus on the continuation of short positions, comprehensive Labaron believes that gold is bearish today. For today's operation, consider rebound shorting as the main, and low long as the auxiliary.
📣 Pay attention to the resistance of 3330-3345 US dollars above
📣 Pay attention to the support of 3300-3280 US dollars below
💰 Go long near 3295-3285, target 3310-3320
💰 Go short near 3330-3340, target 3000-3290
If you have just entered the market, you are confused about the market of gold, oil and silver, and you always do the opposite operation direction and the entry price is unstable. I hope Labaron's article will help you.
Xauusd1h

XAUUSD:Today's trading strategy
On Tuesday, the news that Trump announced a ceasefire between Iran and Israel dampened the risk aversion sentiment. Subsequently, the news that expectations of interest rate cuts had slowed down led to a further decline in gold prices. During the trading session, it once fell below the 3,300 mark. After the impact of the news weakened, it eventually rebounded to around 3,323, approaching the position where we first entered the market yesterday. Currently, there is no logic in the market. From a technical perspective, The resistance level above is at 3340-45, and the support level below is at 3305-10. We can conduct transactions around this range
Trading strategy:
SELL@3340-45
TP:3310-04
BUY@3305-10
TP:3335-40
More detailed strategies and trading will be notified here ↗↗↗
Keep updated, come to "get" ↗↗↗

Can we still go long if the decline of gold intensifies?
📊Comment Analysis
Looking back at today's trend, it rose to a high of 3350, and then continued to retreat. The current low is 3310. At present, due to the upward trend line broken by the hourly line, many orders can only be short. The trend is still biased to the short side, and the current market risk aversion does not facilitate the longs. But first of all, one thing can be confirmed that this round of gold decline lasted for a long time, which also enhanced the execution of gold to go long near 3310-3320 in the future.
Since gold has fluctuated greatly in the past two days, it means that the end point of emotions will not disappear so easily for the time being. In the short-term K-line pattern, continuous short-side artillery should not be constantly changed and increased. It is necessary to stop and see appropriately. The early trading is relatively difficult to grasp, but at least the current market has given some signals, so I hope that when the market is in place, your execution will be strong enough, and then you can look at gold according to the trading signals I gave. The rehearsal is definitely exciting enough, but the actual operation is not that simple!
💰Strategy Package
Gold: Pay attention to the low-long opportunities of 3310-3220 in the US market, and defend at the 3300 line. If the retracement continues, go long directly. Otherwise, the upper resistance will be around 3345!
⭐️ Note: Labaron hopes that traders can properly manage their funds
- Choose the number of lots that matches your funds

Gold fluctuated slightly, retreating to low-multiple operations
📌 Gold news
During the North American trading session on Wednesday, gold prices remained stable, rising by more than 0.30% as easing tensions between Israel and Iran boosted risk sentiment. Meanwhile, disappointing US housing data may prompt the Federal Reserve (Fed) to take action in the future. However, Fed Chairman Jerome Powell's continued tough stance has limited further upside for gold.
📊Comment analysis
Gold fluctuated in a small range yesterday, and the daily line closed with a positive cross star.
Daily support is around 3327-3324, and you can go long if you touch it.
Daily resistance is around 3368, and you can go short if you touch it.
If the market goes down to yesterday's low, the bottom continues to look near this week's low, and I am more inclined to be bullish
💰Gold operation strategy
If gold is close to 3327, you can go long, with a target of 3345.
Look for opportunities to short around 3350-3360, with a target around 3330.
I hope Labaron's article can help you with your investment. If you don't understand something, you can find me. I am not only a mentor, but also a friend worth making in your life.
⭐️ Note: Labaron hopes that traders can properly manage their funds
- Choose the number of lots that matches your funds

Gold today high-altitude low-multiple operation
📌 Gold news
On Tuesday, the spot gold price plummeted, hitting a two-week low. The main reason was that Iran and Israel announced a ceasefire, which suppressed the demand for safe-haven gold. In addition, Fed Chairman Powell made hawkish remarks, which also hit the gold price trend. Short-term long-short game will focus on the PCE inflation data to be released by the United States. If the economic data performs poorly or inflation continues to fall, it may still provide a medium-term rebound opportunity for gold.
📊Comment analysis
Yesterday, gold was weak overall, and the decline and rebound were limited. It fell directly from around 3357 to 3295, and then rebounded according to the news. It ran around 3326 in the morning. From a technical point of view, the daily low trend line support is around 3290, the 4-hour long lower shadow line bottomed out, and three consecutive positive rebounds, the daily line supports the lower track of the Bollinger band, and the Bollinger band tends to be parallel. There is no sign of opening downward, so the short-term decline of gold prices is limited. Consider paying attention to the support of 3294 during the day, and mainly use this position for defense and low long. Pay attention to the important suppression of the middle track 3363 above, and mainly short.
💰Strategy Package
Focus on the support near 3316-3317 in the short term, rely on this position to go long, stop loss 3307, take profit near 3345, and break 3363. If it falls strongly below 3294, then don't consider going long during the day.
Gold operation strategy: long near 3316, stop loss 3307. Take profit 3345
⭐️ Note: Labaron is not 100% correct here, only a steady operation idea, large warehouse for trend, small warehouse for wave, control the proportion by yourself, there is no unprofitable investment, only unsuccessful orders, whether to make money depends on the timing of buying up and buying down, making money depends on opportunities, investment depends on wisdom, and financial management depends on professionalism.

XAUUSD:Go long
The uncertainties in multiple dimensions such as geopolitics, US monetary policy and tariffs have significantly increased, which will bring more volatility to the gold price.
Today's market trend is still mainly volatile. During the Asian session, there has been a deep pullback. 3316 is the short-term support. It is expected that there will be a rebound in the future.
Trading strategy:
BUY@3325-30
TP:3345-50
More detailed strategies and trading will be notified here ↗↗↗
Keep updated, come to "get" ↗↗↗

Iran and Israel ceasefire? Gold price falls and adjusts
📌 Gold information:
Gold prices continued to be well supported during the North American trading session following the breaking news of Iran's retaliatory attack on the US military base in Qatar. The escalation was a response to Washington's weekend attack on Iran's nuclear facilities. As geopolitical tensions in the Middle East dominated the headlines, investors largely ignored US economic data
Macroeconomic indicators have taken a back seat as the intensification of the conflict has affected market sentiment. Arab TV cited Israeli media reports that Iran used missiles to attack US bases in Qatar, Kuwait and Iraq. In further escalation, Tehran approved the closure of the strategic Strait of Hormuz and launched more missiles at Israeli targets, which amplified the safe-haven demand for gold.
The situation in the Middle East has mixed signals. Trump announced a "stop" to the Iran-Israel conflict, while the exchange of fire between the two sides continued, and the proportion of gold longs fell back
📊Commentary Analysis
Gold prices responded to the reduction of positive news on peace in the Middle East and continued to rise.
💰Strategy Package
Short when the price rebounds to around 3370, stop loss at 3480, target at 3350-3388 points
Long around 3310-3320, stop loss at 3300, target at 3360-3368 points
⭐️ Note: Labaron hopes that traders can properly manage their funds
- Choose the number of lots that matches your funds

6/23 Gold Analysis and Trading ViewsGood morning, everyone!
Over the weekend, former President Trump announced and carried out an attack on Iran's nuclear facilities, triggering a renewed wave of risk-off sentiment in the markets. At today’s open, gold surged to around 3394. Driven by geopolitical tensions, the bearish technical structure has temporarily been disrupted.
Whether the bullish momentum can sustain will depend on how the situation continues to unfold.
Key technical levels to watch today:
Resistance: 3389 / 3407 / 3423 / 3432
Support: 3372 / 3365 / 3356 / 3348
Trading strategy: Given the current news-driven market, a buy-on-dip approach is preferred, with short positions as a secondary option depending on price reaction near resistance zones.
Also, pay close attention to today’s daily close (1D chart). If the price closes below 3355, it could signal profit-taking from the bulls, potentially pulling gold back into a bearish technical trend.

Middle East war, gold breaks through 3400 early next week
Hello everyone:
Let's analyze the gold price next week (June 23, 2025 to June 27, 2025)
📌Gold information:
Gold prices held steady on Friday, hovering around $3,369, and are expected to fall nearly 1.90% this week as the market digests U.S. President Donald Trump's decision to abandon immediate military action against Iran and turn to diplomacy. As of writing, XAU/USD fell 0.11%.
While easing geopolitical tensions helped boost risk sentiment, concerns that the United States may restrict allies operating semiconductor factories in China put additional pressure on gold, according to Bloomberg. Trump's restraint on Iran encouraged risk appetite and suppressed the appeal of this safe-haven metal.
What has President Trump been busy with in the past 24 hours? (2025-06-22)
1. Announced the successful airstrike on Iran's three nuclear facilities - Trump issued a message saying that he had successfully launched attacks on Iran's three nuclear facilities, including Fordow, Natanz and Isfahan. The main target Fordow nuclear facility was bombed with a full load of bombs. All fighter jets are returning safely. Iran's Fordow (nuclear facility) no longer exists.
2. Was willing to go to Turkey to negotiate with Iran in person - According to the AXIOS website, sources said that when Trump attended the G7 summit last Monday, Erdogan called and proposed to hold talks between US and Iranian officials in Istanbul the next day to explore diplomatic solutions to the war. Trump agreed, and he was willing to send Vice President Vance and White House envoy Vitkov, and even if necessary, he was willing to go in person. But it was later cancelled because Khamenei could not be contacted.
3. Threatening to strike Iran again if the conflict does not stop - According to Reuters, US President Trump said in a telephone interview that tonight was a stunning success and Iran should immediately achieve peace and stop the war, otherwise they will be hit again.
4. Saying that Iran will either usher in peace or fall into tragedy - Trump said that the US goal is to destroy Iran's nuclear enrichment capabilities and stop Iran's nuclear threat. Iran's facilities have been completely destroyed. Iran will either usher in peace or fall into tragedy. Many goals have not yet been achieved. Tonight's strike is the "toughest target". If peace is not achieved in the future, other targets will be accurately struck.
5. Warning Iran not to retaliate - Trump posted on social media: "Any retaliatory action by Iran against the United States will lead to a military response 'far beyond what we saw tonight.'"
6. US Democratic lawmakers call for Trump's impeachment - On the evening of June 21, local time, according to NBC, New York Democratic Congresswoman Alexandria Ocasio-Cortez said that President Trump's decision to attack Iran without the authorization of Congress "absolutely and clearly constitutes grounds for impeachment." She said that the US President's disastrous decision to bomb Iran without authorization was a serious violation of the Constitution and Congress' war powers.
📣Personal analysis:
Tensions in the Middle East escalate, and gold prices will continue to rise above 3400 at the beginning of next week
🔥 Technical:
Based on the resistance and support levels of gold prices on the 4-hour chart, Labaron identified the important key areas as follows:
Resistance: $3395, $3448
Support: $3302, $3255
⭐️ Note: Labaron hopes that traders can properly manage their funds
- Choose the number of lots that matches your funds

XAUUSD:Go long before you go short
Yesterday's market is relatively fast, we pay attention to the stop profit point, today's Asian plate fell, technical point of view, this week after the big Yin, there is little strength of the rebound, often after the reverse draw will be recovered, the same down after the rapid counterattack, short-term overall performance for the shock downward trend, the center of gravity moving down.
The trading space is also gradually shrinking, within the day can be around 3340-3370 range to operate.
Trading Strategy:
BUY@3344-49
TP:3365-70
Consider going short at 3370-75
More detailed strategies and trading will be notified here ↗↗↗
Keep updated, come to "get" ↗↗↗

6/20 Gold Analysis and Trading SignalsGood evening, everyone!
After gold rallied to around 3388 yesterday, it began to retrace gradually, providing solid returns for our sell-side strategy.
As of now, gold has dipped to a session low near 3339. On the 30-minute chart, the MACD has formed a bullish crossover, and price has broken above the Bollinger mid-band, indicating short-term bullish momentum. The candle structure supports a potential rebound, but strong overhead resistance remains.
Key resistance comes from the 1H MA60 around 3371, and gold still trades within a broader bearish trend on the daily timeframe. While bulls may attempt a recovery, a complete trend reversal remains unlikely unless significant bullish catalysts emerge.
Hence, our strategy continues to favor selling near resistance levels, while cautiously considering long entries near well-defined supports.
📌 Trading Plan (VIP Focus):
✅ Sell Zone: 3370–3383
✅ Buy Zone: 3338–3321
✅ Flexible Trade Range: 3366-3349

Gold fluctuates in the short term, pay attention to 3344 and go 📌 Driving Events
After the Fed’s interest rate decision, as expected, the Fed kept the interest rate unchanged in terms of gold, which was in line with market expectations. The price of gold continued to fluctuate and fall in the short term, and the bullish momentum was not obvious. Even if regional conflicts triggered risk aversion, it is likely to show a trend of rising first and then falling. As the price of gold is under pressure at 3,400 points, the intraday rebound will still fall back briefly under the pressure of 3,400 points.
📊Comment Analysis
Short sellers continue to exert selling pressure on gold prices. Accumulate to below 3400
💰Strategy Package
🔥Sell Gold Zone: 3390-3400 SL 3410
TP1: $3385
TP2: $3375
TP3: $3365
🔥Buy Gold Zone: $3360-$3370 SL $3355
TP1: $3380
TP2: $3390
TP3: $3400
⭐️ Note: Labaron hopes that traders can properly manage their funds
- Choose the number of lots that matches your funds

Today, the Federal Reserve is the key to breaking the deadlock!
📌 Core driving events
Yesterday, as the market believed that the possibility of direct U.S. involvement in the conflict had increased, tensions intensified again, and the market was once worried about possible attacks during the Asian session. Although it did not happen in the end, it is said that the next 24 to 48 hours will be a critical period. This wave of tension triggered widespread "risk aversion" operations in the market, but interestingly, gold did not react strongly. The market remained cautious before the Fed's interest rate decision was released, and the slight increase in risk appetite in the stock market also put pressure on gold prices.
📊Comment analysis
At present, the technical side of gold has been showing a bearish trend, but as of now, the market has not fallen below yesterday's closing low of 3364, and the upper side has been under pressure from the resistance of 3405. Long and short positions are wandering in this range, and the breakthrough market will either break through at the end of the day, and the current trend uses sideways trading to exchange time and space, and has not fallen below the support below, so there is a high probability that it will go up.
In the current tense market, it is more necessary to open a position near the high and low points to make a better game. At the same time, from historical experience, the impact of the Middle East geopolitical crisis on gold has three stages and has entered the second stage. The uncertainty of the global economy, the intensification of trade frictions and the rise in inflation expectations may provide structural support for gold. Therefore, if it does not break near 3364 today, it will be bullish first!
💰Strategy Package
Gold: More near 3368-70, defend the 3364 line, and look up to the 3397-3405 line. If it breaks 3405 upward, it will further impact 3422 and even the previous high, but if it breaks below 3364, the long single position will be adjusted out and it will no longer be bullish for the time being!
⭐️ Note: Labaron hopes that traders can properly manage their funds
- Choose the number of lots that matches your funds

Gold may usher in new opportunities
Key fundamental drivers
- Middle East tensions and nuclear negotiations Despite the ongoing tensions, Iran's signal of restarting nuclear talks has reduced risk aversion, triggering an intraday sell-off in gold, and the market has digested the reduced possibility of escalation of the conflict. The turbulent situation in the Middle East remains a trigger for market volatility, and any downgrade/escalation signals may trigger sharp fluctuations in gold prices.
- Fed policy and rate cut bets The Fed kept interest rates unchanged this week, but Powell's "data-dependent" stance has raised market expectations for a September rate cut to 60%. A dovish meeting statement could push gold prices above $3,400, while a delayed rate cut signal could drag gold prices to $3,350.
Short-term outlook
In the short term, gold prices may fluctuate between $3,350 and $3,450, and a breakthrough depends on:
- Upside catalyst: Escalating tensions in the Middle East + weak retail sales data may push gold prices to $3,450.
- Downside risks: Fed hawkish signals + fading geopolitical risks could push prices to $3,300.
Key event risks
- June 19: Fed policy meeting (expected to be dovish)
- June 21: US CPI data (inflation indicator to measure the timing of rate cuts)
- Middle East situation: progress in nuclear negotiations and conflict dynamics
💰Strategy Package
Set gold price:
🔥Sell gold area: 3390-33396 SL 3400
TP1: 3380 US dollars
TP2: 3375 US dollars
🔥Buy gold area: $3374-$3366 SL $3360
TP1: 3390 US dollars
TP2: 3400 US dollars

Gold is under pressure! What is the key to breaking the deadlock
📌 Core driving events
The conflict between Iran and Israel has entered the fifth day. Air raid alerts in Tel Aviv are frequent. The fire on a cruise ship in the Strait of Hormuz has exacerbated the panic of energy transportation. Safe-haven buying supports gold prices;
Trump's contradictory statement of "peace talks + tough" (may send executives to meet but demand "unconditional surrender") has exacerbated the market's disagreement on the direction of the conflict, and risk aversion has fluctuated repeatedly.
The Federal Reserve will announce its interest rate decision today. The market expects it to remain unchanged at 4.25%-4.50%, but Powell's statement on rate cuts will affect the trend of the US dollar (Trump continues to pressure for a 1 percentage point rate cut).
📊Comment Analysis
1-hour chart: 3396 becomes the intraday strength and weakness watershed
The Asian morning session hit a high of 3396 US dollars and fell back. This point is the previous high pressure point. If the intraday rebound does not break through this position, the bearish thinking will be maintained;
💰Strategy Package
Set gold price:
🔥Sell gold area: 3390-33396 SL 3402
TP1: 3380 US dollars
TP2: 3375 US dollars
🔥Buy gold area: $3374-$3368 SL $3362
TP1: 3390 US dollars
TP2: 3400 US dollars
⭐️ Note: Labaron hopes that traders can properly manage their funds
- Choose the number of lots that matches your funds

6/18 Gold Analysis and Trading SignalsGood morning, everyone!
Gold traded within a narrow range yesterday, and the buy signal shared during the session yielded profits. From a technical perspective, the market remains in a rebound phase, with key resistance around 3403. If the price breaks and holds above this level, there’s a good chance we’ll see a move toward the 3418–3428 zone today.
During the Asian and European sessions, the trading bias should remain on the buy side, while in the U.S. session, it may be more favorable to shift toward short setups, mainly due to expectations surrounding the upcoming Fed interest rate decision—an outlook we discussed yesterday.
Key intraday ranges to watch:
Asian–European session: 3362–3413
If price reaches the 3425–3435 zone before the U.S. session, short opportunities may emerge
As always, manage your positions carefully and adapt to key levels as price unfolds.

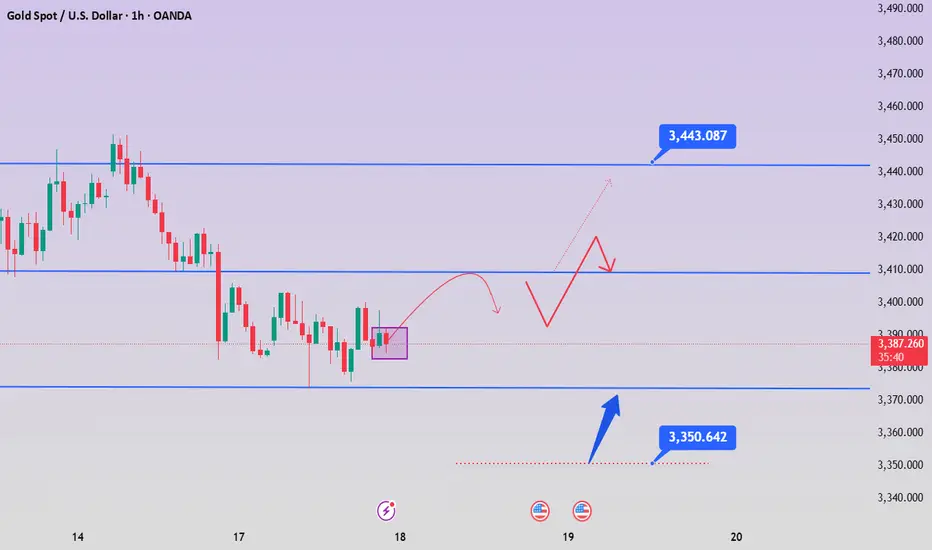
Continue the rally, get ready for gold to return to 3443
⭐️Gold News:
Gold prices (XAU/USD) fell for the second consecutive trading day on Tuesday, retreating from the gains in the early Asian trading hours, which had briefly pushed above $3,400. A slight rebound in the US dollar (USD) continued to put pressure on the precious metal, acting as a major resistance. However, the downside for gold seems limited due to escalating geopolitical tensions in the Middle East and growing market expectations that the Federal Reserve (Fed) will further cut interest rates in 2025.
Meanwhile, the ongoing air conflict between Israel and Iran has entered its fifth day, exacerbating concerns about further escalation in the region. This ongoing geopolitical uncertainty supports demand for safe-haven assets such as gold. Investors also remained cautious ahead of the Federal Open Market Committee (FOMC)'s two-day policy meeting, the outcome of which could affect the next move of non-yielding gold.
⭐️Technical analysis:
Gold price gets liquidity from the support level below: 3385, 3373 completed, short-term downward trend breaks, gold price will soon return to above 3400.
Set gold price:
🔥Sell gold area: 3443-3453 SL 3458
TP1: $3435
TP2: $3422
TP3: $3407
🔥Buy gold area: $3358-$3350 SL $3345
TP1: $3368
TP2: $3376
TP3: $3390
Geopolitics and Fed policies dominate the trend of gold prices
📌 Gold news
On Monday, boosted by the risk aversion of the Iran-Israel war, the gold price hit a high of 3452, but the continuity was not strong, and a series of other adjustments appeared; let's briefly sort it out:
1: Adjustment: Adjustment is normal. If the market rises, if the risk aversion does not continue to exert force, then the gold price can only return to technical adjustments. Therefore, Monday's adjustment trend and the decline trend are normal!
2: Risk aversion trend: The risk aversion trend will not be reversed for the time being! Once the war starts, it will not end easily; unless the interests of both sides are not damaged, the two sides agree to a ceasefire, but at present, the hope and probability are relatively small, so the risk aversion trend is the mainstream of the current global market;
3: The direction of the Iran-Israel war is nothing more than a few possibilities:
A: The war expands, the surrounding countries stand in line, and the US and Western imperialism join the battlefield; the war expands rapidly! At the same time, Iran is forced to block the Strait of Hormuz! This is a manifestation of escalating war;
B: Both sides, as well as the forces behind them, have calculated their interests, reached an agreement, and agreed to end the war conflict; this mainly depends on Iran's attitude; is it "powerful and unyielding", continuing to oppose the United States and imperialism; or is it pro-American, completely changing its identity, or changing its identity to submit to Israel and the United States;
To sum up: risk aversion eased slightly on Monday, but the overall global market is still risk-averse; technical adjustments are normal trends; but don't completely ignore the importance of risk aversion and risk aversion control because of technical adjustments; in addition, the subsequent results of the Middle East war are nothing more than the above two; what determines all this is the attitude of both sides;
📊Comment Analysis
Although the gold price fell below 3400 and the short-term trend changed, the general direction still remains bullish. In the future, it is still expected to hit the high point of 3500, but it is necessary to wait patiently for the bottom to stabilize before choosing the opportunity to buy the bottom. The current market is changing rapidly, and investors should adhere to the principle of following the trend and flexibly adjust their trading strategies.
💰Strategy Package
Short-term gold 3383-3393 long, stop loss 3372, target 3420-3440;
Short-term gold 3420-3430 short, stop loss 3435, target 3390-3370;
⭐️ Note: Labaron hopes that traders can properly manage their funds

Gold: Key Levels Amidst Bull-Bear ClashDaily Technical Analysis
Daily Chart
Gold trended sideways-up last week, repeatedly testing upper resistance without a decisive breakout, though bullish momentum remains robust 🚀💪. The Bollinger Bands are expanding upward with price near the upper band, moving averages in bullish alignment, and MACD forming a golden cross above the zero axis with an expanding red histogram—signaling a dominant long-term uptrend 🔥📈!
4-Hour Chart
After reaching an intraday high of 3451, price corrected lower, forming small bearish candles that indicate short-term bearish momentum 📉🔻. However, moving averages still maintain a bullish order, with initial support at the psychological level of 3400. If price stabilizes here, further upside may resume 📈🚀. MACD has formed a bearish cross at high levels with a nascent green histogram, suggesting near-term correction is needed ⚠️🔄!
1-Hour Chart
Price is in a correction channel after retreating from highs, suppressed by short-term moving averages 📉🔽. Note that 3382 acts as a key prior support—if price pulls back to this zone, it may trigger bullish rebounds 💪🔥! RSI hovers around 50, indicating balanced long-short forces with an unclear near-term direction 🤷♂️🔀.
Gold Trading Strategies
sell@ 3430-3450
tp:3410-3400
buy@3400-3403
tp:3420-3430 (3450 if 3430 breaks)🚀
Professional trading strategies are pushed daily 📊
Lock in precise signals amid market fluctuations 🚀
Confused about market trends? Stuck in strategy bottlenecks?
Real-time strategies serve as your "trading compass" 🌐
From trend analysis to entry/exit points, dissect market logic comprehensively
Refer now 📲
Help you move steadily forward in investments ✨
👇👇👇

Iran releases easing signals, gold is still bullish
📣Golden News
1. Iran sends a signal of easing. U.S. media reported that under the pressure of Israeli air strikes, Iran has used Arab intermediaries to send a peace signal to the United States and Israel - asking the United States not to carry out air strikes as a prerequisite for restarting nuclear negotiations, and emphasizing to Israel that controlling violence is in the common interest.
2. Israel's firm stance. Israeli warplanes fly freely over the Iranian capital, and Iran's counterattack is ineffective. Israel is still focused on dismantling Iran's nuclear facilities and weakening its theocratic regime, and there is no motivation to cease fire in the short term.
3. Gold's reaction and strategy. Iran's peace proposal caused the price of gold to plummet to as low as $3,382. However, since the situation in the Middle East has not eased significantly, it is recommended to buy on dips and pay attention to the support level of $3,400. ⭐️Set gold price:
🔥Sell gold area: 3465-3475 SL 3485
TP1: 3450 USD
TP2: 3440 USD
TP3: 3430 USD
🔥Buy gold area: 3390-3388 USD SL 3383 USD
TP1: 3400 USD
TP2: 3410 USD
TP3: 3422 USD

Gold, continued to rise after a pullback
📌 Driving events
Israel and Iran launched a new round of attacks on each other on Sunday (June 15), exacerbating market concerns that the escalation of the war could trigger a wider regional conflict, and gold continued to receive support from safe-haven buying. (The author believes that according to media reports, Iranian leaders have shown a tougher attitude, and Iran cannot be ruled out to give Israel a strong counterattack, so the geopolitical situation in the Middle East may escalate in the next few days, and gold as a safe-haven asset will shine even brighter.
Kremlin: (On Putin's possible mediation of the Israeli-Iranian conflict) Russia is ready to intervene at any time if necessary. (The author hopes that the two countries will be reconciled as soon as possible)
📊Comment Analysis
1-hour chart: The rising channel breaks down, and short-term shorting is at 3442.
💰Strategy Package
Today's US market plans to sell high and buy low in the 3408-3452 range. If the range breaks, follow the trend, strictly lighten the position and set a good stop loss.
⭐️ Note: I hope traders can properly manage their funds
- Choose the number of lots that matches your funds
I hope everyone will set rules, control emotions, and take a long-term view, and slowly get rid of the control of desire, be at ease in the trading market, find their own way to make money, and truly enjoy the fun and rewards brought by trading.

Analysis of gold trend on June 16!
📣Gold information:
Gold prices (XAU/USD) climbed to $3,445 in early Asian trading on Monday, the highest level in more than a month, as rising tensions in the Middle East and expectations of a rate cut by the Federal Reserve boosted demand for safe-haven assets.
Investors remain focused on geopolitical risks despite stronger-than-expected U.S. economic data on Friday. The University of Michigan's consumer confidence index jumped to 60.5 in June, well above market expectations of 53.5 and 52.2 in May. However, the market largely shrugged off the data. Instead, attention turned to the escalating conflict in the Middle East, with Israel's recent attack on Iran fueling concerns about instability in the wider region. In response, Iranian authorities warned that they would "respond firmly to any adventurism," which boosted gold's appeal amid global uncertainty.
⭐️Technical review and analysis: For the current short-term operation of gold, it is recommended to rebound high and go long, with the upward resistance level of 3450-3500 and the downward support level of 3385-3335.
⭐️Set gold price:
🔥Sell gold area: 3465-3475 SL 3485
TP1: $3450
TP2: $3430
🔥Buy gold area: $3390-$3388 SL $3383
TP1: $3400
TP2: $3422

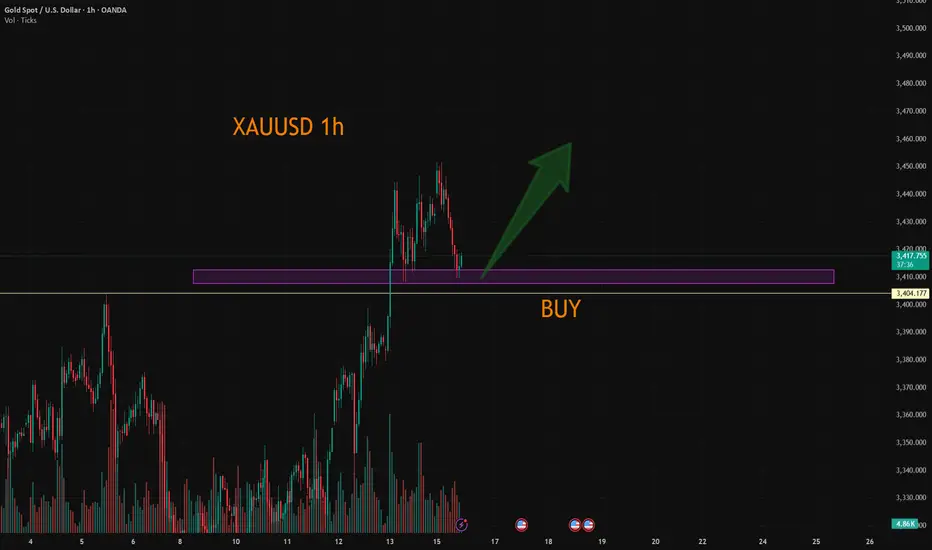
XAUUSD:Waiting to go long
For gold I am still bullish, do long, rather than blindly chase long.
Today's lowest reretreat to around 3408, from the short-term level or long willingness is stronger, the hourly level is a little pressure, trading can wait for the pullback before buying long, the important support below 3404. Short-term support looks at 3407-12
Trading Strategy:
BUY@3407-12
TP:3427-30
↓↓↓ More detailed strategies and trading will be notified here ↗↗↗
↓↓↓ Keep updated, come to "get" ↗↗↗