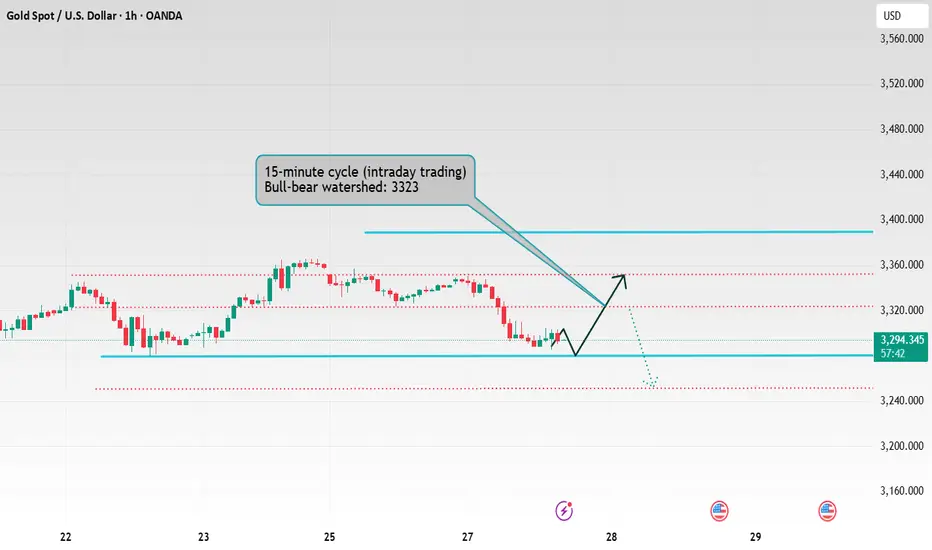
Gold is about to reach the shorting zone
The tariff policy against Europe and Apple was temporarily shelved last Friday due to the decline in the credibility of the Trump administration, which failed to push gold prices up this week. Instead, gold prices continue to fluctuate within the downward channel. Currently, the focus is on the resistance level of $3,325-3,335, and shorting can be attempted near this level.
Pay close attention to whether the support level of $3,280 and the resistance level of $3,365 are broken.
Xauusd1h

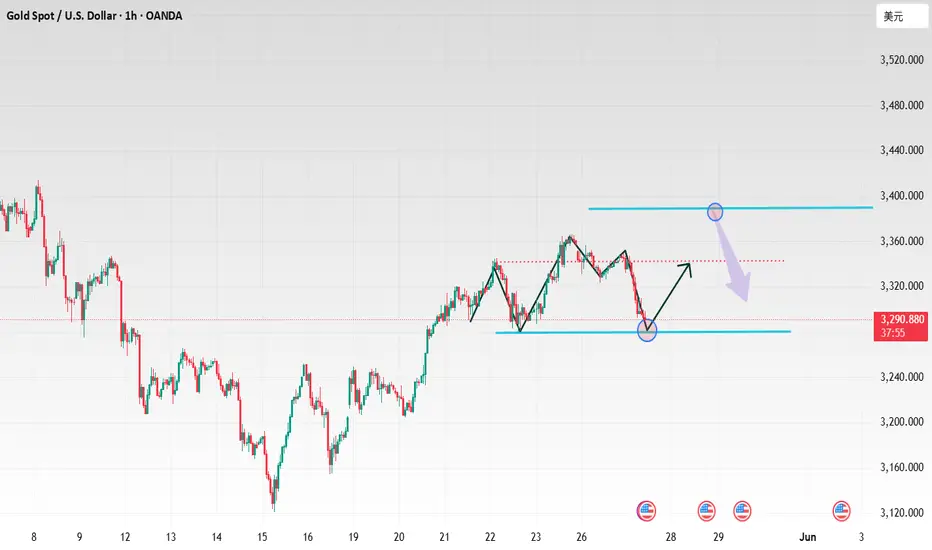
Gold closed with a big negative line, and may fall below 3285
📌 Driving events
On Monday, gold prices fell nearly 2%, falling below the $3,300 mark. Investor sentiment improved after U.S. President Donald Trump decided to postpone the imposition of tariffs on EU imports. The recovery in risk appetite, coupled with the dollar's small rebound from last week's decline, put pressure on the non-yielding precious metal.
Earlier, President Trump and European Commission President Ursula von der Leyen had a call over the weekend and finally decided to postpone the U.S. plan to impose a 50% tariff on EU goods to July 9. The move eased global trade concerns, prompted investors to shift away from safe-haven assets other than the dollar, and pushed global stocks higher.
📊Commentary Analysis
Gold showed a downward trend on Tuesday and has now broken below the 5-day moving average. This change has turned the market from a previous strong rise to a volatile trend. However, to determine whether the market has weakened, further observation is needed.
From the perspective of upper resistance, focus on the position near 3350. This position is not only yesterday's high point, but also the resistance position formed by the extension of the line connecting the high points of 3350 and 3438. Once the price breaks through this resistance level, it means that the market will return to a strong upward trend. In fact, it is near 3325 or the low point in the previous decline. It is necessary to pay attention to the top and bottom conversion here. The support level below is first yesterday's low of 3285 and the previous low of 3280.
💰Strategy Package
Operation strategy;
Short gold near 3325, defend 3335, target 3305-3285
Long gold near 3280, defend 3270, target 3300-3320
⭐️ Note: Labaron hopes that traders can properly manage their funds
- Choose the number of lots that matches your funds
- Profit is 4-7% of the fund account
- Stop loss is 1-3% of the fund account

Gold 3315 gains and losses are the key
📌 Driving events
From the news perspective, data released by the U.S. Department of Commerce on Tuesday showed that U.S. durable goods orders in April plunged 6.3% month-on-month, with an expected value of -7.8% and a previous value revised from 9.20% to 7.50%. Volatile commercial aircraft orders plunged 51.5% in April after rising in March. Boeing said it received only eight aircraft orders in April, the lowest since May 2024, far lower than the 192 orders in March, the highest since 2023. Affected by the sharp drop in commercial aircraft orders, U.S. durable goods orders fell more than expected in April, with core capital goods orders (excluding aircraft and military hardware) falling 1.3%, the biggest drop since October last year. Under the influence of uncertainty in tariffs and tax policies, corporate investment willingness is weakening.
Through the data, it is not difficult to find that American companies have shown obvious caution in assessing the demand outlook and have shifted their focus to cost reduction, which directly reflects the impact of uncertainty brought about by Trump's trade policy. At the same time, the tax legislation being debated in Congress has also put companies on the sidelines, further suppressing the impulse to invest.
📊Comment Analysis
After the pullback on Monday this week, the decline accelerated on Tuesday, and the continuous decline came back, changing the strong upward trend of last week
💰Strategy Package
In terms of operation, in the short term, long and short operations can be carried out in the range of 3315-3297 US dollars, and the support position of 3285/80 should be paid attention to below; medium and long-term investors can buy on dips and take advantage of geopolitical risks and the trend of weak US dollars to gradually establish long positions.
⭐️ Note: Labaron hopes that traders can properly manage their funds
- Choose the number of lots that matches your funds
- Profit is 4-7% of the fund account
- Stop loss is 1-3% of the fund account

Gold bottomed out and rebounded, US market ideas!
📊Comment analysis
During the European and American markets, the market rebounded to 3249. Before the rebound, it was mentioned that the first resistance today was around 3251, followed by the defense point of 3265. As expected, gold plunged slightly near the resistance level of 3251, and fell to 3227 at its lowest.
💰Strategy package
Short at the current price of 3239-40, add shorts near 3242 and 3245, stop loss 3253 target 3200-3165
⭐️ Note: Labaron hopes that traders can properly manage their funds
- Choose the number of lots that matches your funds
- Profit is 4-7% of the fund account
- Stop loss is 1-3% of the fund account

Gold Falls as Expected — Bearish Structure HoldsAfter today’s market open, gold entered the 3346–3358 resistance zone, but failed to maintain upward momentum.
As expected from yesterday’s analysis, the bearish pattern remained intact, and price turned lower.
🔔 Congrats to those who followed the plan — another profitable move locked in!
🔍 Current Market Outlook:
✅ Trend remains bearish, technicals do not currently support a bullish case;
✅ Key support zones:
First support: near 3306
Major zone: 3290–3280
Extended support: around 3260
📌 We’ll continue to focus on short setups as long as the bearish structure holds.
⚠️ Key Reminders:
The market won’t fall in a straight line — watch for temporary rebounds;
During rebounds, pay attention to support/resistance flips;
Be ready to adjust your strategy if the trend shifts!
📍 Important resistance levels:
3346–3338
3324–3318
(This has been highlighted multiple times — don’t ignore it.)
✅ Stick to the plan, adapt to the trend, and manage risk like a pro — that’s the key to consistent profits.

XAUUSD:Long trading ideas
On the whole, the easing of the trade end further reduces risk aversion, and the geopolitical situation supports the normalization. It is expected that gold will maintain a volatile pattern in the short term, and bullish in the medium and long term.
Below the strong support near 3288, back to step into the market can be more than a single rebound. (Those who hold long orders can add long positions at this position), the upper short target is 3320-25, then 3360.
So the trading strategy :BUY@3288-94 TP@3320-25
↓↓↓ More detailed strategies and trading will be notified here →→→
↓↓↓ Keep updated, come to "get" →→→

Spot gold fell below the 3330 mark
📌 Driving events
The trend of gold prices this week needs to focus on the following three major risk events:
First, the confrontation between Israel and the Houthis intensified this week. On May 25, the Houthis used hypersonic missiles to attack Israel's Ben-Gurion International Airport for the first time, resulting in the interruption of airport operations. Israel subsequently launched a retaliatory air strike. Iran has made it clear that it "will not give in on uranium enrichment activities" and warned that it will take hundreds of alternatives if it is sanctioned
Second, although the Trump administration's threat to impose a 50% tariff on the European Union has been postponed to July 9, the market is still concerned about it. If the trade war escalates, it may lead to increased global economic uncertainty, which will in turn boost the safe-haven demand for gold. However, the repetition of tariff policies may also trigger changes in market risk preferences and have a two-way impact on gold prices.
Third, record-breaking air strikes in the Russian-Ukrainian conflict Russia launched the largest air strike since the war on Ukraine on May 26, launching 355 drones and 9 cruise missiles, and many parts of Ukraine suffered heavy losses. The attack has heightened market concerns about geopolitical risks, pushing gold prices higher in the short term. However, due to expectations of a prolonged conflict, market demand for safe-haven assets may gradually weaken. Technically, gold has performed strongly at support levels near $3,330.
📊Commentary Analysis
This week, gold prices will remain highly volatile under the intertwined influence of multiple risk events. Investors need to remain vigilant and flexibly adjust strategies to respond to market changes. Analyze the market, make plans, and manage risk.
💰Strategy Package
In terms of operations, investors are advised to pay close attention to the situation in the Middle East and the progress of Trump's tariff policy. In the short term, short selling can be carried out in the range of $3,330-3,305, with a target of around $3,290-3,280. Profits can be taken in batches, and a light position can be taken long after breaking through $3,310, with a target of $3,360-3,380. Profits can be taken in batches, and medium- and long-term investors can make layouts on dips, taking advantage of geopolitical risks and the trend of a weak dollar, and gradually establish long positions.
⭐️ Note: Labaron hopes that traders can properly manage their funds
- Choose a lot size that matches your funds
- Profit is 4-7% of the capital account
- Stop loss is 1-3% of the capital account
Gold Bull vs. Bear Battle: Trading Guide Between Support at 3280Bullish on the 4-hour chart, support at 3280-3285, resistance at 3365 ⭐️.
Long Positions:
Go long on pullback to 3280-3290 📊🎯.
Stop loss: 3270
Targets: 3320 → 3330
Add positions if price holds above 3320 🌟.
Targets: 3355 → 3365
Short Positions:
Short on rally to 3350-3360 ⚠️📉
Stop loss: 3370
Targets: 3320 → 3330
Risk Control:
Always use stop loss and take profits in batches ✨.
Gold Trading Strategies
buy@3280-3290
tp:3320-3330
sell@3350-3360
tp:3320-3330
Professional trading strategies are pushed daily 📊
Lock in precise signals amid market fluctuations 🚀
Confused about market trends? Stuck in strategy bottlenecks?
Real-time strategies serve as your "trading compass" 🌐
From trend analysis to entry/exit points, dissect market logic comprehensively
Refer now 📲
Help you move steadily forward in investments ✨
👇👇👇

Gold hits around 3280, please go long in the short term
📌 Driving Events
Gold prices fell more than 0.50% on Monday as demand for safe-haven assets decreased after U.S. President Donald Trump announced a postponement of tariffs on the European Union. Trading activity remained subdued as the U.S. and UK markets were closed for public holidays. As of this writing, the gold/dollar exchange rate was around $3,294. Trump issued a statement on Sunday, postponing the date of the 50% tariff on EU goods to July 9, and market sentiment improved. As a result, gold prices came under pressure and fell after a sharp rise of 4.86% last week (the strongest weekly performance since early April)
📊Commentary Analysis
Focus on the support level of 3285/80. If this area is touched for the first time, go long
💰Strategy Package
🔥Selling area: 3345-3350 SL 3355
TP1: $3333
TP2: $3325
TP3: $3308
🔥Buying area: $3280-$3285 SL $3275
TP1: $3312
TP2: $3330
TP3: $3345
⭐️ Note: Labaron hopes that traders can properly manage their funds
- Choose a lot size that matches your funds
- Profit is 4-7% of the fund account
- Stop loss is 1-3% of the fund account
Gold price pullback. How to trade?Information summary:
On Monday, due to Trump's policy changes, high tariffs on the EU were suspended. The market's risk aversion sentiment has declined, and spot gold fell at the opening, but recovered some of its losses in the US market, maintaining a consolidation range of 3320-3355.
When the US market opens, there must be large fluctuations. Gold recovered all the gains on Friday due to the increase in tariffs on the EU on Monday. Then, when the US market opens, it is very likely to rise sharply, and also recover the losses on Friday.
And from the current gold 1-hour chart:
The current trend line of gold has fallen below, and the early trading has also completed the retracement. Therefore, gold may go down next. There is a high probability that it will test the bottom support position of 3310-3300.
From the daily chart:
You can see that the daily chart is currently an important support position near 3300. Once it falls below 3300, it can be officially confirmed that the correction trend is coming. And the trend after the US market opens is critical.
Operation strategy:
Short immediately, stop loss 3335, profit range 3310-3300.

Gold plunges. Downside meets?Spot gold fluctuates at high levels during the Asian session and is currently trading around $3,330.
I think spot gold is expected to fall below the immediate support level of $3,330 per ounce and fall towards $3,284.
Completion occurs near the key resistance level of $3,366, which is reinforced by similar resistance established by the descending trend line. Working together with these obstacles is another obstacle, namely $3,355, which is the retracement level of the downtrend from $3,501 to $3,120.
The bearish divergence of the hourly RSI confirms that the rally has been exhausted and a sharp correction is imminent.
Based on the changes in the Asian market today, an analysis was conducted. I hope my analysis can help you turn losses into profits in the trading market.
Operation strategy:
Short at $3,340, stop loss at $3,355, and profit range of $3,310-3,300.

Trump's tariff measures trigger market shocks
📌 Driving events
Last Friday, as Trump threatened to raise tariffs on the European Union to 50%, and also pointed the finger at smartphone manufacturers such as Apple and Samsung, the market's risk aversion sentiment suddenly heated up, and spot gold closed up nearly 2% on the day.
On Sunday local time, US President Trump announced after a call with European Commission President von der Leyen that he would extend the deadline for the European Union to face 50% tariffs to July 9. Trump told reporters on his way back to Washington on Sunday: "We had a very pleasant call, and I agree to postpone the deadline."
Bloomberg analysis said that there are signs that US President Trump may relax his radical stance on EU trade, which will affect gold's safe-haven status.
At the geopolitical level, the conflict between Israel and Iran is imminent. The Israeli army's shooting of a diplomatic delegation has triggered international condemnation. Netanyahu has maintained a tough stance in the Israeli-Kazakh conflict; Trump's mediation of a ceasefire between Russia and Ukraine has been frustrated. The Wall Street Journal revealed that when he spoke with the European side, he said that Putin believed that the Russian army was "winning", which contradicted his public statement. This week, the market focus shifted to the Fed's policy minutes, the Bank of Japan's rate hike expectations, European and American economic data, and OPEC+'s production increase plan. The interweaving of trade frictions, debt risks and geopolitical conflicts has kept the uncertainty of the global pattern high.
📊Comment Analysis
The first support level for gold prices may be in the range of $3290-3300/ounce. If it falls below the above support, the next support for gold prices will be $3250/ounce and $3200/ounce (50-day moving average). On the upside, the first resistance for gold prices is $3370/ounce. If this obstacle is overcome, the next resistance for gold prices will be $3430/ounce and $3500/ounce (historical high).
Labaron will digest a series of economic data to be released by the United States this week, such as durable goods and home sales, as well as the consumer confidence index. The U.S. stock market will be closed on Monday due to the Memorial Day holiday.
💰Strategy Package
⭐️SET UP GOLD PRICE:
🔥SELL GOLD zone : 3388- 3390 SL 3395
TP1: $3376
TP2: $3363
TP3: $3350
🔥BUY GOLD zone: $3301- $3299 SL $3294
TP1: $3312
TP2: $3325
TP3: $3338
⭐️ Note: Labaron hopes that traders can properly manage their funds
- Choose the number of lots that matches your funds
- Profit is 4-7% of the capital account
- Stop loss is 1-3% of the capital account

Tariffs are on the rise again, gold is jumping.Information summary:
The Trump administration has once again launched a tariff war, threatening to impose a 50% tariff on the EU from June 1, and said that the negotiations between the United States and the EU have made no progress. Because the timing of this threat is quite delicate. Just earlier this week, the EU just submitted a new framework proposal to the US to restart bilateral trade negotiations. This directly led to a jump in gold.
Faced with the tough stance of the United States, the EU is not without countermeasures. It is reported that the EU has formulated a contingency plan. If the negotiations fail, it will impose additional tariffs on US exports worth 95 billion euros in response to Trump's "reciprocal" taxation and 25% tariffs on automobiles and some parts, which will inevitably cause further impact on the market.
Market analysis:
Today, the European session was under pressure at 3335 and the correction method was adopted. This correction method can better show that the price is strong, and the bulls are not willing to give the bears too many opportunities. Therefore, the layout should be aggressive. The stronger the market, the less likely it will fall back. At the same time, the correction of the strong market will definitely not break the low for the second time.
Operation strategy:
Short near 3375, stop loss at 3380, and target 3350-3340.
The price fell back to around 3335, and we will adopt a long strategy based on the downward trend.

Gold can be shorted near 3365-3370 in the US market
📌 Driving Events
Gold prices fell about 0.48% on Thursday, retreating from a two-week high of $3,345 and falling below the key $3,300 level. Although U.S. Treasury yields retreated from intraday highs, the renewed strength of the U.S. dollar still pushed gold prices down. The pressure on gold intensified after the U.S. House of Representatives passed President Trump's budget proposal, which is now submitted to the Senate for final approval. At the time of writing, XAU/USD was trading at $3,289, down 0.83% on the day. Although the market sentiment has rebounded slightly, it remains fragile after Moody's recently downgraded the U.S. sovereign debt rating. The fiscal package approved by the House of Representatives is expected to increase the national debt ceiling by a staggering $4 trillion, which has exacerbated concerns about long-term fiscal sustainability.
📊Comment Analysis
Gold is now facing strong resistance and buying power is weakening.
💰Strategy Package
🔥Sell Gold Zone: 3365- 3370 SL 3375
TP1: $3350
TP2: $3335
TP3: $3320
⭐️ Note: Labaron hopes that traders can properly manage their funds
- Choose the number of lots that matches your funds
- Profit is 4-7% of the fund account
- Stop loss is 1-3% of the fund account

Gold starts to go down? Double opportunities.Analysis of Asian market trend:
To summarize the short-term trend, "continue to step back and continue to seek key support". Gold rose and then fell in the Asian market yesterday, and the final rebound stopped at 3350. The trend is in line with our short-term bearish expectations. As for the market falling and breaking, it is a normal market. This means that the adjustment needs to continue. Today, the main focus below is still the support level of 3280. The early decline has approached this point, but it has not been completely touched; if this position is not broken, the bullish rebound is still there and it will rise at any time.
Operation adjustment, mainly low and high, supplemented by high and low, look at the shock sideways, wait for the market to break through the range and gradually look down; then the two main points of short-term focus, if the downward trend does not break 3280, then the rebound will first look at the high point of 3320. Strong breakthrough and stabilization at this position, if it does not break through yesterday's high point, it will continue to be mainly shocking; at the same time, unlike the previous consecutive rises in the past few weeks, this week's trend is slightly weak, and it is almost the weekend, so let's look at the amplitude of the range trend first.
Operation strategy:
Short around 3320, stop loss at 3328, target at 3290;
Long around 3280, stop loss at 3270, target at 3315.
Short-term trading is temporarily operated in this range, and a new layout will be made if it breaks.

Gold bulls push prices to around 3355
📌 Driving events
Gold prices rose more than 0.50% and held above the $3,300 mark, driven by renewed safe-haven demand and rising geopolitical tensions in the Middle East. As of writing, gold/USD is trading around $3,317, rebounding from an intraday low of $3,285.
Market sentiment remains fragile, with US stocks falling into negative territory and US Treasury yields slightly higher. All eyes are on the upcoming vote on President Trump's tax reform plan. According to estimates by the Congressional Budget Office (CBO), the plan could lead to an approximately $3.8 trillion expansion of the US national debt. Uncertainty about the fiscal outlook continues to stimulate demand for gold as a defensive asset.
📊Comment Analysis
Gold price recovery is good, pay attention to the 3358 price area, adjust downward, and continue to accumulate funds around 3300
💰Strategy Package
🔥Sell gold area: 3358-3360 SL 3365
TP1: $3350
TP2: $3337
TP3: $3322
🔥Buy gold area: $3284-$3276 SL $3270
TP1: $3300
TP2: $3320
TP3: $3340
⭐️ Note: Labaron hopes that traders can properly manage their funds
- Choose the number of lots that matches your funds
- Profit is 4-7% of the fund account
- Stop loss is 1-3% of the fund account

5/22 Gold Trading SignalsGood afternoon everyone!
Yesterday's trading session was a bit bumpy, but in the end, we achieved considerable profits.
Today, gold rose to around 3346 and then began to pull back. It is now approaching the 3300 support level.
🔍 From a technical perspective, the candlestick structure and several indicators suggest that bears may still attempt further downside:
Primary support area: 3288–3276 — if this holds, a rebound is expected, with resistance around 3309–3316.
Secondary support area: 3263–3248 — if it breaks lower, watch for a short-term bounce around 3276-3282.
📰 On the news front, Initial Jobless Claims and PMI data will be released today. These could trigger short-term volatility.
📌 Trading strategy for today includes two key scenarios:
If the data is bearish for the dollar and gold drops to 3253, look for buy opportunities.
If the data is bullish and gold rises to 3358, it's a good spot to sell into strength.
📈 Today’s Trading Recommendations:
📉 Sell near 3358–3372 (Resistance zone)
📈 Buy near 3263–3248 (Support zone)
🔁 Flexible intraday levels: 3253 / 3268 / 3277 / 3286 / 3298 / 3309 / 3316 / 3328 / 3348
Wishing everyone a smooth trading day. Feel free to leave a comment if you have any questions—I’ll get back to you as soon as possible.

Is the gold price far from 3,400?Information summary:
The trade war is a continuous war, and it has just begun. During Trump's four years in office, trade conflicts will continue to occur. Trade conflicts are means, not ends. The goal of the United States is to transfuse blood to its own economy through trade negotiations.
In addition, US inflation fell to a historic low of 2.3% in April. The Federal Reserve has not cut interest rates on the grounds that inflation will rebound. The Federal Reserve can't hold on for long. Cutting interest rates is the only antidote to boost the economy, and it is also a special medicine.
Next, once the Federal Reserve releases the wind of interest rate cuts, the market's risk aversion will be ignited again. In June, 6 trillion US bonds will mature. Regardless of the result this time, market sentiment will be worried, which is the key to driving price fluctuations.
Market analysis:
The 1-hour gold price broke through yesterday's high of $3,320. The previous pressure formed a new top-bottom conversion position, and the strong market was only a small correction in the middle. There is no need to worry about whether it will peak, but there must be a standard for judging the peak; this standard is: breaking the support position before the last decline, and the second rebound does not set a new high.
Operation strategy:
Go long when the price falls back to around $3,330, stop loss at $3,320, and profit range at $3,365-3,380.

Gold breaks upward, space opens up
📌 Driving events
Internationally, US media reported that US intelligence agencies found that Israel was preparing to attack Iran's nuclear facilities, and gold and crude oil both soared in the short term.
Recently, the Iran nuclear talks and the Russia-Ukraine talks were carried out simultaneously, and the market risk aversion sentiment fluctuated greatly
📊Comment analysis
While the medium and long-term outlook continues to be bullish on gold's performance this year, short-term operations are mainly based on news. Pay attention to light positions and maintain flexibility in short-term operations.
💰Strategy Package
🔥Buy Gold Zone: 3310-3315 SL 3307 Scalping
TP1: $3318
TP2: $3325
TP3: $3330
🔥Sell Gold Zone: 3354-3356 SL 3361
TP1: $3345
TP2: $3332
TP3: $3320
🔥Buy Gold Zone: $3252 - $3250 SL $3245
TP1: $3260
TP2: $3270
TP3: $3280
⭐️ Note: Labaron hopes that traders can properly manage their funds
- Choose the number of lots that matches your funds
- Profit is 4-7% of the fund account
- Stop loss is 1-3% of the fund account

Gold breaks through 3300, where is the next stop
📌 Driving events
Beth Hammack, president of the Federal Reserve Bank of Cleveland, stressed that the current US government's policies make it increasingly challenging for the Federal Reserve to effectively guide the economy and fulfill its dual mission of maintaining price stability and full employment. She also warned that the risk of a stagflationary environment (characterized by stagnant growth and persistent inflation) is rising. In contrast, Alberto Musalem, president of the Federal Reserve Bank of St. Louis, recently said that the current monetary policy stance is still appropriately adjusted.
Despite rising US Treasury yields, gold has struggled to gain support, indicating that higher yields alone are not enough to drive safe-haven demand under the current circumstances.
However, global monetary easing policies may provide support for this precious metal. In the latest moves during the Asian trading session, the People's Bank of China (PBoC) cut its benchmark interest rate, followed by the Reserve Bank of Australia (RBA) unexpectedly cutting the cash rate from 4.10% to 3.85% - moves that usually support non-yielding assets such as gold.
📊Comment Analysis
Spot gold prices have extended gains in recent intraday trading, taking advantage of its stability above EMA50 and trading along a bullish trend line on a short-term basis, strengthening its ability to reach the main resistance level of $3,300 and break it. Some weak signals have appeared on technical indicators. We noticed that a negative overlap signal has formed on the RSI, and after reaching overbought levels, this indicates that a temporary adjustment is needed on the upward action. Therefore, gold has reduced some of its early gains and waited for clearer signals to continue the bullish trend.
💰Strategy Package
🔥Sell Gold Zone: 3354-3356 SL 3361
TP1: $3345
TP2: $3332
TP3: $3320
🔥Buy Gold Zone: $3252 - $3250 SL $3245
TP1: $3260
TP2: $3270
TP3: $3280
⭐️ Note: Labaron hopes that traders can properly manage their funds
- Choose the number of lots that matches your funds
- Profit is 4-7% of the fund account
- Stop loss is 1-3% of the fund account

GOLD: Look To Buy After The RetracementPrice is showing bullish structure on M15/H1/H4. Price is tapping into a H4 bearish supply zone 3295-3310 so we may see a retracement to fill some imbalances or retest demand.
Possible Buy Limit Zones: 3275-3280 or 3251-3245
Set those alerts!

Gold fluctuates, and the profit range is in this area
📌 Driving events
After a phone call with Trump yesterday, Russian President Vladimir Putin said that efforts to end the war in Ukraine are on track and Moscow is ready to work with Ukraine on a memorandum of understanding for a future peace agreement. The United States has begun serious trade negotiations with the European Union, which has slightly improved investor sentiment. These negotiations broke the long-standing deadlock and brought some hope for more deals after Washington signed a framework agreement with the United Kingdom earlier this month. Trump had previously said that he could also reach an agreement with India, Japan and South Korea, but the negotiations with Japan seemed to be deadlocked over the issue of automobile tariffs.
📊Commentary Analysis
Gold prices fluctuated narrowly throughout the day, mainly due to the weakening of the US dollar and safe-haven demand after Moody's downgraded the US government's credit rating.
💰Strategy Package
For intraday short-term operations, pay attention to the 3200 area for long opportunities and defend 3193. Pay attention to the 3235 area for short opportunities and defend 3242.
⭐️ Note: Labaron hopes that traders can properly manage their funds
- Choose the number of lots that matches your funds
- Profit is 4-7% of the fund account
- Stop loss is 1-3% of the fund account

Putin's phone call changed the market?
📌 Driving Events
Putin's "peace smoke bomb", gold is under short-term pressure
Just when gold was soaring due to risk aversion, a piece of news on Monday cooled the market instantly - after Putin and Trump talked on the phone, both sides released the signal that "Russia and Ukraine will soon ceasefire negotiations." Trump even announced loudly: "Russia and Ukraine will start ceasefire negotiations immediately!"
US President Trump said, "We will do everything we can to stop the conflict in Ukraine."
This news caused the market's risk appetite to rise briefly, and the gold price fell slightly to around $3,220 in the Asian market on Tuesday. But senior observers soon discovered that Putin's words were full of diplomatic rhetoric - he only said that the peace efforts were "on the right track" but did not promise a specific ceasefire time. Former Swedish Prime Minister Bilt pointed out: "This is Putin's victory. He successfully delayed the ceasefire pressure while continuing military operations."
Market truth: Geopolitical risks have not really subsided, and the safe-haven demand for gold is only a short respite.
📊Comment analysis
For investors, the question now is not "whether to buy gold", but "when to buy and how much to buy". At the moment when the global economic order is being reconstructed, the light of gold may have just begun to shine.
💰Strategy Package
Bullish breakout scenario: If the price breaks through the high of last Friday's rebound at $3,252 and continues to rise, you can go long with a light position near $3,260, targeting the $3,280-$3,290 range.
Bearish breakout scenario: If the price breaks below the key support level of $3,200 and further declines, you can go short near $3,190, targeting the $3,170-$3,160 range.
⭐️ Note: Labaron hopes that traders can properly manage their funds
- Choose a lot size that matches your funds
- Profit is 4-7% of the capital account
- Stop loss is 1-3% of the capital account

Gold sees strong high resistance; shorting on rebounds prevailsToday, gold can be described as fluctuating within a wide range, but overall it tends to be more bearish. Although gold rose at the opening on Monday, it suddenly made a sharp turn at the 3250 level, leaving those who chased long positions confused. We have analyzed that the upper resistance is strong, and the upside space is relatively limited. On the contrary, the downside space is larger, so shorting on rebounds remains the current short-term trend! If you are currently unsatisfied with your gold trading, I hope Barry can help you avoid detours in your investments. Welcome to communicate and exchange ideas!
From the hourly chart analysis, the support levels below should continue to focus on the 3170-3175 area, with strong support at the 3150 level. The resistance above is near 3253-3260. The overall trading approach remains centered on cyclic participation in shorting highs and longing lows within this range, with a core principle of exercising caution at intermediate levels – avoid excessive trading and impulsive order chasing. Be patient and wait for entry at key price points.
Gold Trading Strategies
sell@3240-3250
tp:3220-3200
buy@3170-3175
tp:3220-3230
Professional trading strategies are pushed daily 📊
Lock in precise signals amid market fluctuations 🚀
Confused about market trends? Stuck in strategy bottlenecks?
Real-time strategies serve as your "trading compass" 🌐
From trend analysis to entry/exit points, dissect market logic comprehensively
Refer now 📲
Help you move steadily forward in investments ✨
👇👇👇
