Gold: Bearish, may fall below 3300📊 Yesterday, gold resumed its bullish move after a minor pullback, breaking through the 3400 level and reaching around 3440 during today’s early session, before starting to retrace.
📉 In the chart I shared yesterday, the black line represents the key bull-bear boundary. The current price has already broken below this level, and if it fails to reclaim it, the trend may shift toward bearish in the short term.
📌 Key support levels to watch:
First support: 3383
Next support: 3350
If selling intensifies, there’s a real chance price may break below 3300
Xauusd1h

Gold is now far away from the moving averageGold's 1-hour moving average continues to cross upward bullish divergence, and the gold bullish volume is still there. After breaking through 3400, gold has basically stabilized at 3400. Gold has also tested the support near 3405 several times in the US market. Gold continues to stabilize and rise. However, gold is now far away from the moving average, and we must always pay attention to the adjustment of the high position. Gold is watching the pressure around 3461

Gold: Profit on Open, Focus on Key Zones Congrats to everyone who followed my long positions before last Thursday’s market close!
Gold opened higher today, bringing us the first profit of the new week — a great start with accurate direction!
Currently, gold is facing selling pressure near the historical high around 3360. On the 1H chart, technical indicators look solid. Once the pressure is absorbed, there’s a good chance the price may reach new highs today.
However, be cautious: If the upward trend weakens or stalls, there’s a risk of a double top formation — a bearish sign for the bulls.
📌 Key zones to watch today (as marked in the chart):
Support: Around 3308
Resistance: Around 3369
With price at elevated levels, a breakout above resistance often leads to a pullback to retest previous support, so adjust strategies flexibly.
Trading Advice:
Focus on support/resistance flips
Prioritize sell high, buy low within the zone
Manage risk and avoid chasing price blindly

XAUUSD Gold Bearish Setup for upcoming week.XAUUSD Sell Setup – Short from Resistance at 3350
Gold (XAUUSD) has approached a key resistance level around 3350, where previous price action suggests potential for bearish reversal. With the current momentum showing signs of exhaustion, we’re looking for a short opportunity from this zone.
Trade Idea:
Sell Entry: 3350 (resistance level)
Target 1: 3310 – Minor support / first reaction zone
Target 2: 3290 – Key support area
Target 3: 3250 – Major support & potential full TP zone
Stop Loss: Above recent swing high (suggested: 3360–3370)
Analysis:
Price has formed a potential double top / rejection wicks near 3350, signaling possible downside. A break below 3310 will likely accelerate bearish momentum.
Risk Management:
Use proper lot sizing and move SL to breakeven after TP1 for a safe ride to lower targets.

Gold fluctuates and adjusts, will next week be the key?Gold fell all the way in the US market on Friday, with the lowest falling to the 3283 line. However, gold once again rose as a risk aversion. Will gold return to a large range of shocks, or will the adjustment end? The trend of gold after the opening next week will be critical. If gold continues to rise strongly at the opening next week, then gold may end its adjustment, and gold bulls may continue to exert their strength
If gold is still under pressure at 3332 after the opening next week, then gold may continue to fluctuate downward in the short term, thereby driving the moving average to turn. If it directly breaks through 3332 strongly after the opening, then gold will start to fluctuate in a large range.
The current market is very volatile due to the impact of news, and the next trend of gold will become clear on Monday. I will continue to bring analysis to my friends on Monday

Gold continues to wait for a new ATH of 3381
📌 Driving Events
On Thursday, gold prices (XAU/USD) entered a consolidation phase, fluctuating in a narrow range near the all-time highs set during the Asian session, as investors digested conflicting market signals. Stronger-than-expected US retail sales data and tough comments from Federal Reserve Chairman Jerome Powell supported the US dollar (USD), curbing some of the upward momentum of gold. At the same time, optimism in the stock market and slightly overbought technicals prompted traders to remain cautious, currently limiting a new round of buying interest in precious metals.
📊Comment Analysis
Gold now continues to maintain its high strength, and gold is still in a bullish trend. The short-term correction does not change the upward trend of gold. The decline of gold is an opportunity to go long. The current price of gold is 3320, which is directly long!
💰Strategy
Long position:
Gold is long around 3320-25, defend around 3310 area, and the target is above 3340
⭐️ Note: Labaron hopes that traders can properly manage their funds
- Choose the number of lots that matches your funds
- Profit is 4-7% of the fund account
- Stop loss is 1-3% of the fund account

Gold’s short-term correction does not change gold’s upward trendGold continues to remain strong at high levels, and gold is still in a bullish trend. The short-term correction will not change the upward trend of gold. The fall of gold will give the opportunity to go long.
The 1-hour moving average of gold is still a bullish arrangement with golden crosses diverging upwards. The strength of gold bulls is still there. Gold has found support near 3320 and is rising again. The current rhythm of gold is to fall back and continue to go long.
Trading idea: Go long near gold 3327, stop loss 3317, target 3350

Gold has an adjustment trend, shorting is the main trendGold has begun to fluctuate in a wide range. The gold high has been suppressed frequently in the past two days and will fall back. Don't chase too much after the gold high. Even if you are long, you must patiently wait for the opportunity to fall back and adjust.
The gold 1-hour moving average has begun to show signs of turning, so the volume of gold bulls has begun to weaken, and gold bulls may have adjustments. In the short term, the confidence in further rising gold is not very strong. The structure of the double top of gold 1 hour.
Trading ideas: short gold near 3221, stop loss 3231, target 3200

Gold: Directional Break ImminentYesterday’s market remained calm without any significant swings, unlike the strong movements we’ve seen previously. Today, however, appears to be a critical turning point as the market prepares for a directional breakout.
📊 Technical Overview:
Gold is showing signs of retesting the resistance around 3240, while short-term support lies at 3194–3188. If this resistance holds and the price fails to break above, a double-top pattern may form—potentially triggering a major drop between Wednesday and Thursday.
If the price breaks above 3240, there may be around $30 of additional upside, but this is likely to mark the formation of a short-term top, followed again by a decline.
🎯 Key Bearish Target Zones: 3137-3106
Whether it breaks upward or downward, a bearish opportunity is building. Stay patient, follow the price action, and avoid emotional decisions to catch the move at the right moment.

Gold: It may Fall below 3180 todayOver the weekend, Trump announced a pause on tariffs for popular consumer electronics, prompting gold to gap down to 3210 at today’s open;
✅ Our recommended short entries at 3230–3260 are already in profit;
New semiconductor tariff announcements are due during the U.S. session today — the key driver for gold’s next move;
Given the fragile U.S. political/economic backdrop, escalating tariff conflict is unlikely, increasing the chance of bearish impact on gold;
With gold already trading at a premium, any "tariff relief" narrative will likely trigger speculative sell-offs;
If you're holding short positions, consider being patient — avoid premature exits due to emotional reaction to minor pullbacks.
Maintain key short entry zone: 3230 – 3260;
Expect gold to test below 3180 if market sentiment shifts

4/14 Gold Trading StrategiesLast Friday, gold showed a strong unidirectional rally followed by tight-range consolidation at high levels. Our bearish-biased strategy yielded limited profits, and some traders may still be holding trapped positions due to delayed exits. However, structurally, gold’s current posture signals early signs of exhaustion, and a pullback remains likely.
🔥【Key Headlines to Watch】
🇺🇸 The U.S. has suspended tariffs on popular consumer electronics, causing gold to gap down by $30 at today’s open.
🛠️ Trump is expected to unveil details on semiconductor tariffs — a reduction or pause will likely pressure gold lower.
💬 Two Fed officials speak today:
Barkin: Speech on “Navigating Through Economic Fog”
Cook: Remarks on the Fed’s evolving role in the economy.
📊 The NY Fed 1-Year Inflation Expectations report will be released — market expectations are bearish for gold.
🔍【Technical Outlook】
Gold remains near historic highs, trading at an extended premium;
The recent rally has been largely driven by speculative inflows, not solid demand;
If sentiment flips or profit-taking begins, a sharp sell-off could follow;
Structurally, gold appears to be forming a top — favor short setups at elevated levels.
🎯【Trade Setup for Today】
🔻Sell Zone: 3230 – 3250
Look to short near resistance on failed breakouts
🔺Buy Zone: 3128 – 3104
Consider long entries only on healthy pullbacks to strong support
🔄Range Zones:
3220 – 3195
3158 – 3206
Tactical range trading — adapt to intraday momentum shifts

XAU/USD(20250411) Today's AnalysisMarket news:
The annual rate of the US CPI in March was 2.4%, a six-month low, lower than the market expectation of 2.6%. The market almost fully priced in the Fed's interest rate cut in June. Trump said inflation has fallen.
Technical analysis:
Today's buying and selling boundaries:
3141.00
Support and resistance levels:
3244
3206
3180
3101
3075
3037
Trading strategy:
If the price breaks through 3180, consider buying, the first target price is 3206
If the price breaks through 3141, consider selling, the first target price is 3101

Gold: Sell@3188-3200Gold has continued its strong rally, hitting a new all-time high, with bullish sentiment running extremely hot.
However, we must approach this rationally — every new high is usually followed by a technical pullback.
Currently, the 3200 level is a significant psychological resistance, as well as a key threshold for short-term bullish momentum.
From a technical perspective, the sharp recent rally has shown signs of momentum exhaustion, with clear overbought signals emerging.
📌 Strategy Suggestion:
Consider building short positions around the 3188–3200 zone
If 3137 is broken, further downside could extend to 3112–3090
⚠️ Risk Management Notes:
The larger the rally, the stronger the pullback potential
Avoid chasing long positions at these levels to prevent getting trapped at the top
Keep position sizes under control and set stop-losses to guard against sudden volatility
Wishing everyone smooth trades and solid profits!

4/10 Gold Trading StrategiesGold maintained a bullish tone yesterday, with prices recovering steadily toward the 3100 level, offering smooth trade opportunities and favorable returns.
However, today presents a significantly more complex trading environment due to several high-impact events:
🇺🇸 US CPI (MoM + Core CPI)
📝 Initial Jobless Claims
🗣️ Fed speakers including Barkin and Schmid
Technically, gold is now at a crucial inflection point , where market interpretation diverges:
If this is merely a corrective rebound in a broader downtrend , the move may be near completion.
If instead it's a healthy retracement in an ongoing uptrend, we could be in the middle phase of a continued climb.
Given the mix of technical ambiguity and fundamental uncertainty, a neutral and reactive trading stance is essential today.
🎯【Recommended Strategy & Positioning】
Trade Against Emotional Swings
Avoid chasing price during high-volatility news. Look to sell after sharp rallies and buy after sharp dips , minimizing exposure to emotional trades.
Key Zone Analysis – Watch the Trapped Orders
3128–3158: Zone where many long positions may be trapped — watch for selling pressure.
3016–2978: Former short-entry zone — potential area for long-side reactivation if retested.
📌【Today's Key Trade Zones】
🔻 Sell Zone: 3143 – 3168
🔺 Buy Zone: 3013 – 2979
🔄 Flexible Zone 1: 3109 – 3058
🔄 Flexible Zone 2: 3045 – 3013
❗ Above 3170, focus only on short positions — avoid chasing long trades at elevated levels.

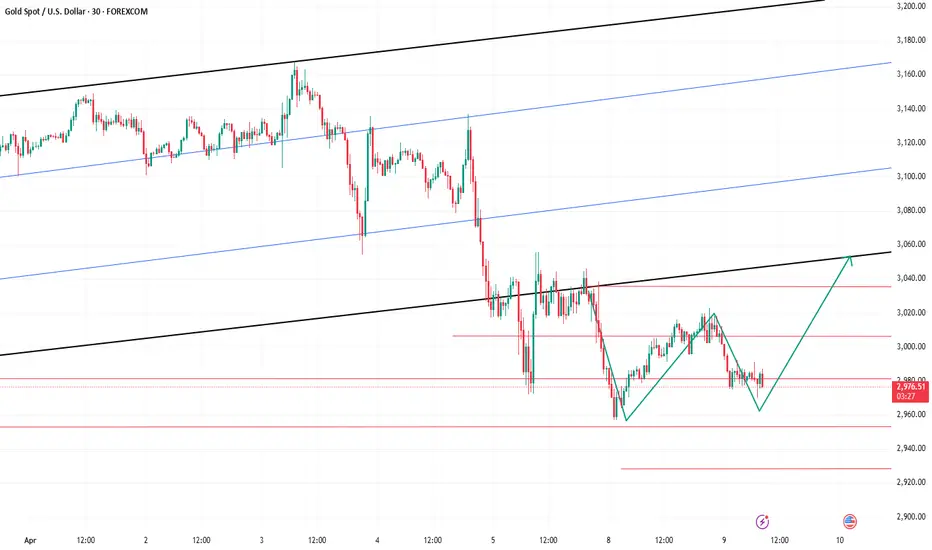
4/8 Gold Trading StrategyYesterday, gold dipped to the 2950 support zone, still under bearish pressure. However, the market did not enter into an extreme one-sided sell-off. Instead, an intraday rebound suggested that short-term buying interest is beginning to emerge.
Following last week's and yesterday’s sharp correction, the 1-hour technical structure has started to show early signs of a potential bottom. While a retest of the 2960–2950 area in the near term cannot be ruled out, the broader price action now supports the technical conditions for a medium- to short-term rebound.
Currently, gold is stabilizing around the 2980-2960 level. Even if additional bearish pressure emerges, the maximum downside support is expected in the 2919–2888 range. This suggests a likely transition into a low-level consolidation and base-building phase, rather than a continued steep decline.
From a technical perspective, the 3100 zone is a key corrective target for this pullback. The market may gradually move higher to complete a structure recovery, offering a limited-risk, clearly defined opportunity for the bulls.
📌 Key intraday resistance levels:
3018 → 3037 → 3058 → 3079
📌 Trading Strategy for Today:
🟢 Buy Zone: 2976 – 2948
🔴 Sell Zone: 3048 – 3062
🔁 Scalp/Range Zone: 3032 – 2998

Gold: Buy, Target 3004-3028On the 1H chart, the MACD is showing a bullish divergence, signaling a potential bottom. If gold can build a base around 2960-2980, bulls will have the upper hand from a technical standpoint.
While today's major macro news will hit during the U.S. session, technical analysis dominates the Asian and European sessions — which favors a buy-on-dip strategy.
The 3030 resistance, which wasn’t tested yesterday, may be reached today.
If the price drops unexpectedly, watch the 2946-2928-2916 zone for new buying opportunities — especially 2928-2916, which is a strong support zone.
Buy:2960 - 2980
TP:3004 - 3028
Gold has won two consecutive games, continue to short?Gold continued to be in a dead cross downward short position at 1 hour. The strength of gold short positions has not diminished. Gold fell near the resistance of 3017, and the gold moving average resistance has now moved down to near 3021. After gold rebounds, it is still mainly short selling.
Trading ideas: short gold near 3015, stop loss 3025, target 2990
The above is only a sharing of personal opinions and does not constitute investment advice. Investment is risky and you are responsible for your profits and losses.

Gold's decline is not over yet, go short on the rebound!The gold 1-hour moving average continues to cross the downward short arrangement, the momentum of gold shorts is still there, and gold rebounds and continues to short. Of course, gold has been falling sharply in the past few days, and the market may gradually begin to recover. You must wait patiently for opportunities to rebound, and do not chase short positions easily.
Trading ideas: short gold near 3017, stop loss 3027, target 2090
The above is purely a sharing of personal opinions and does not constitute trading advice. Investments are risky and you are responsible for your profits and losses.

Gold: Focus Remains on Buy-the-Dip Strategy
Gold witnessed another round of extreme volatility today, plunging below the 3000 level before quickly rebounding. Since then, the price has repeatedly tested support in the 3030–3018 range. So far, this support zone has held up well, suggesting buyers remain active at lower levels.
However, traders should keep a close eye on the 3047 resistance area, which may temporarily cap upward momentum. In the short term, the overall strategy remains focused on buying at lower levels, with the potential for prices to revisit the 3080 region in the coming days.
That said, due to the sharp price swings recently, caution is advised for those looking to chase the rally above 3040. Unless your account has sufficient margin and risk tolerance to withstand a potential pullback toward the 3000 level, it is not recommended to enter aggressively at higher prices.
Trading Strategy Summary:
Bias: Short-term bullish (buy-the-dip)
Support zone: 3030–3018
Resistance: 3047 (short-term), 3080 (medium-term target)
Risk warning: Avoid chasing above 3040 unless risk control is well in place
Stay agile, and adjust your positions according to intraday price action. I will continue to provide real-time updates as the situation evolves.

Geopolitical Tensions, Supporting Bullish Outlook for GoldOver the weekend, geopolitical tensions remained elevated:
A mortar attack targeted the vicinity of Aden Adde International Airport in Mogadishu, Somalia.
U.S. forces launched airstrikes on key targets in Saada, a city in northern Yemen.
Ukrainian forces conducted multiple strikes on Russian energy infrastructure.
Massive protests erupted across dozens of U.S. cities, marking the first large-scale demonstrations since former President Trump returned to office. Trump described the recent U.S. stock market plunge as “intentional” and urged Americans to “stay strong.”
In Europe, Germany is reportedly considering repatriating 1,200 tons of gold reserves currently stored in the United States—signaling potential mistrust in global financial stability.
Fundamental Outlook
Given the ongoing geopolitical uncertainty, investor demand for safe-haven assets like gold is expected to remain strong. As risk sentiment continues to deteriorate, buyers are likely to dominate the market, especially on price dips. We anticipate increased buying interest next week, which could support gold prices and potentially lead to a breakout from the current consolidation zone.
Additionally, macroeconomic data releases will play a crucial role. The U.S. CPI report, due Thursday, will be the most closely watched indicator. A higher-than-expected CPI could cause markets to reassess the timing and scale of potential Fed rate cuts, resulting in a temporary rebound in the U.S. dollar and Treasury yields. However, sustained higher borrowing costs would intensify recession risks, limiting any dollar strength. This dynamic continues to favor gold in the medium to long term.
We are entering a phase where the fundamental and technical landscapes are increasingly aligned in favor of the bulls. The recent pullback in prices presents a strategic opportunity for medium- to long-term buyers to accumulate positions.
Those already holding long positions—whether currently in profit or facing temporary drawdowns—are advised to remain patient and avoid emotional exits. The broader structure remains supportive of higher prices in the coming sessions.
I will continue to provide real-time updates, entry/exit suggestions, and risk control strategies during market hours. Be sure to stay connected and follow the guidance closely.

4/7 Gold Trading StrategiesGold opened with a massive gap down today due to growing market panic, plunging below the $3000 psychological level. Although it briefly rebounded to $3030+, selling pressure intensified again, dragging prices back below $3000 and continuing to test lower support levels.
This sharp sell-off wiped out almost two months of previous gains. While the panic is real, it’s important not to be ruled by fear. Lower prices offer entry opportunities for long-term bullish capital. In such moments, we need courage as much as caution.
Rather than following fear blindly, we suggest looking for buy opportunities at lower support zones, with a combination of scalping tactics for short-term trades.
📌 Trading Strategy:
🟢 Buy Zone: $2980 – $2950
🔴 Sell Zone: $3040 – $3060
🔁 Scalping Zone: $3021 – $2996

Gold continues to fall, what will happen next week?After the gold price fluctuated sharply at the high level in the past two days, gold finally broke down on Friday. In fact, the market was too active in the past two days, and the overall volatility was very large. In fact, it was still a little difficult to trade. Although the overall outlook is bearish, the rebound amplitude is actually not small each time. Now sometimes it rebounds more than 20 US dollars in a few minutes, so it may continue to fall after a loss. Now that the gold daily high is covered by dark clouds, how should we trade next week?
The gold 1-hour moving average has formed a death cross downward, so the gold shorts still have power, and the short-term gold can only rebound. After the rebound, the shorts will continue, and then the gold will enter a shock. After the high-level plunge of gold, the shorts will be more dominant in the short term. Unless there is a big positive news, it is difficult for gold to rise directly. The resistance for gold's rebound is 3076. If it is under pressure, then gold's rebound will mainly continue to be short on highs.

How will gold perform after the super rollercoaster market?Gold's 1-hour moving average still shows signs of turning downwards. Although gold bulls have made a strong counterattack, it is also because of the risk-aversion news that stimulated a retaliatory rebound. However, gold continued to fall after rising, and gold began to return to volatility. In the short term, gold is supported near 3100. If gold falls below the support near 3100 again, then gold shorts will still have an advantage in this war. Overall, the impact of today’s non-agricultural data is expected to be dim. What is more important is the stimulation of the news. However, it may be noted that if gold holds the 3100 mark for a long time, then gold is expected to fluctuate upward above 3100.
Trading idea: short gold near 3115, stop loss 3125, target 3100
The above is purely a sharing of personal views and does not constitute trading advice. Investments are risky and you are responsible for your profits and losses.
