The US dollar is strong. Be wary of gold.The US dollar index rose, now above 100, before retreating slightly and fluctuating slightly, reaching 100 for the first time in two months. After a sharp drop to around 3270 on Wednesday, gold rebounded sharply today. With the US dollar breaking through 100 and the USD/JPY pair breaking through 150, gold is now struggling to maintain its position.
Thus, Quaid believes it's not appropriate to be overly bullish on gold for now. A significant decline is likely.
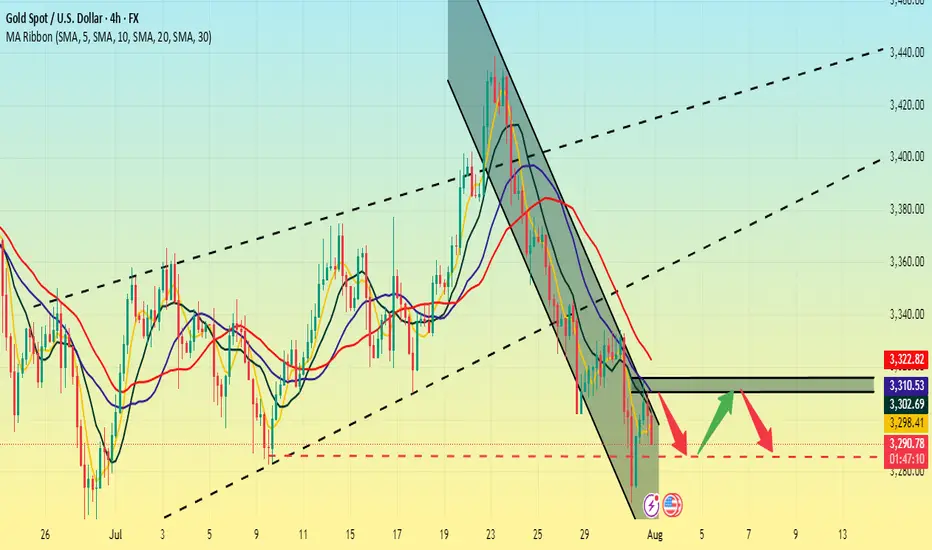
The 4-hour chart shows that the upper moving average resistance is currently around 3310-3315. If it breaks through 3315, it could potentially move towards 3325.
Conversely, if it fails to break through 3315 today, it could continue to consolidate in the 3315-3285 range. Waiting for new data to guide its trend.
Xauusd4h
Gold fluctuates. Is the decline halted?Information Summary:
Despite diminished market expectations for a September US rate cut, gold rebounded from a one-month low hit the previous session on Thursday, boosting its safe-haven appeal as newly announced US tariffs sparked new trade uncertainty.
So far, gold has risen 1.15%, hovering around $3,310, a gain of nearly $40 today. On Wednesday, gold prices hit their lowest point since June 30th: $3,267.79.
Market Analysis:
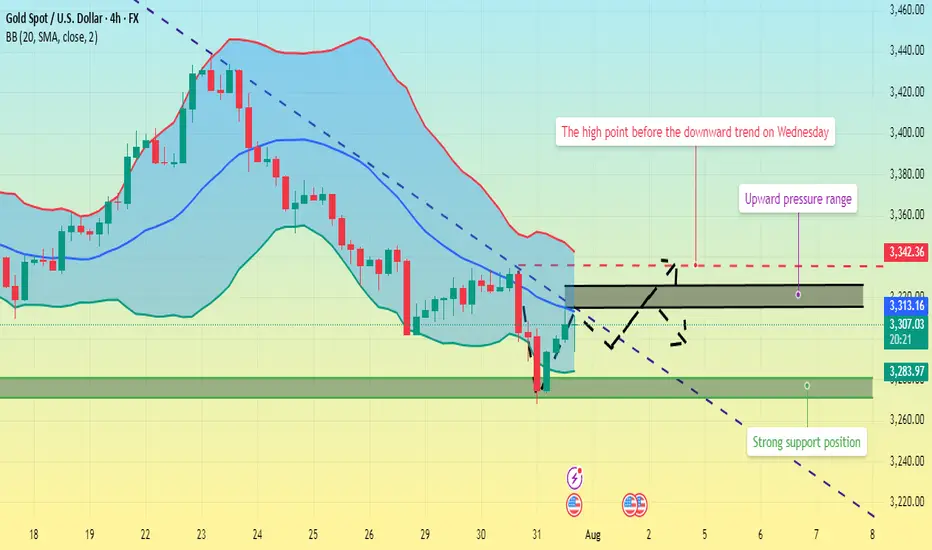
On the 4-hour chart, prices remain below the middle Bollinger Band, with a descending trendline defining the current bearish momentum. Prices rebounded after hitting this month's low on Wednesday. In the short term, watch for price rejection signals near the trendline. Upward pressure currently lies between $3,315 and $3,325, while support lies between $3,280 and $3,270.
Currently, prices are fluctuating upward. Quaid believes the bullish trend may continue. If the current resistance level is broken, it could reach the 3335 high before Wednesday's decline.
Trading strategy:
Go long near 3300, stop loss at 3290, profit range 3320-3330.
XAUUSD Thursday Chart Market Structure & Context
Timeframe: 15-Minute (M15)
Overall Trend: Bearish after a confirmed Break of Structure (BOS) to the downside
Current Price Action: In a retracement phase toward a premium supply zone
Bias: Expecting a liquidity sweep upward, followed by a strong sell-off
🧱 Key Structure Zones
NYL.H & NYL.L: High and Low of the previous New York session
ASIA.H & ASIA.L: High and Low of the Asia session
NYPM.H & NYPM.L: High and Low of the New York PM session
🔍 Critical Levels & POIs
Breaker Block (Dark Gray Box)
Formed after price swept buy-side liquidity and then broke structure upward
Expected to act as a support zone for a temporary buy or a reaction point
BSL POI (Buy-Side Liquidity - Point of Interest)
A manipulated breakout area targeted by smart money
Expected to entice FOMO buyers before a sharp reversal downward
Sell-Side Liquidity (SSL)
Located below the current breaker block
This is the final liquidity target for a continuation sell move
📈 Expected Price Behavior
Price is currently retracing upward
Projected Scenario:
Price moves up to tap into the BSL POI zone (around 3,303–3,305)
Price rejects the POI, forming a potential distribution range
Breakdown from the range initiates a sell-off
Targeting final support / liquidity sweep around 3,268.04
🎯 Trade Setup & Plan
Bias: Sell after a liquidity sweep above key highs
Entry Trigger: Upon clear rejection from the BSL POI zone
Stop Loss: Above BSL POI (~3,307–3,309)
Take Profit: 3,268.04, yielding a Risk-to-Reward Ratio ~4.67
⏰ Killzone Timing (SMC Timing Model)
NY AM Killzone (14:00–19:00 GMT+7)
→ Ideal for entries; likely where liquidity manipulation occurs
NY Lunch & PM
→ Potential for distribution phase completion and sell-off
📌 Additional Notes
Price action reveals a clean FVG (Fair Value Gap) and a completed BSL sweep
Final downside target aims for the NYPM Low, identified as a weak low
Rejection from the breaker block is crucial; confirmation via BOS/CHoCH on lower TF is preferred

The US and Europe reached an agreement. Gold rebounded.At the current node, the EU and the US reached a tariff cooperation, 15% tariff + 600 billion US dollars for investment in the United States. The additional tariffs are considered a big deal, and the US has become the winner again this time.
Of course, this is a small negative for the current gold market.
From a multi-period analysis, the monthly chart price is still in a reverse K state. For the current situation, we need to pay attention to the gains and losses of the monthly highs and lows. The weekly chart shows that the price has continued to fluctuate at a high level recently. As time goes by, the weekly watershed is temporarily at 3320. After last week's high and fall, there is currently a further downward performance.
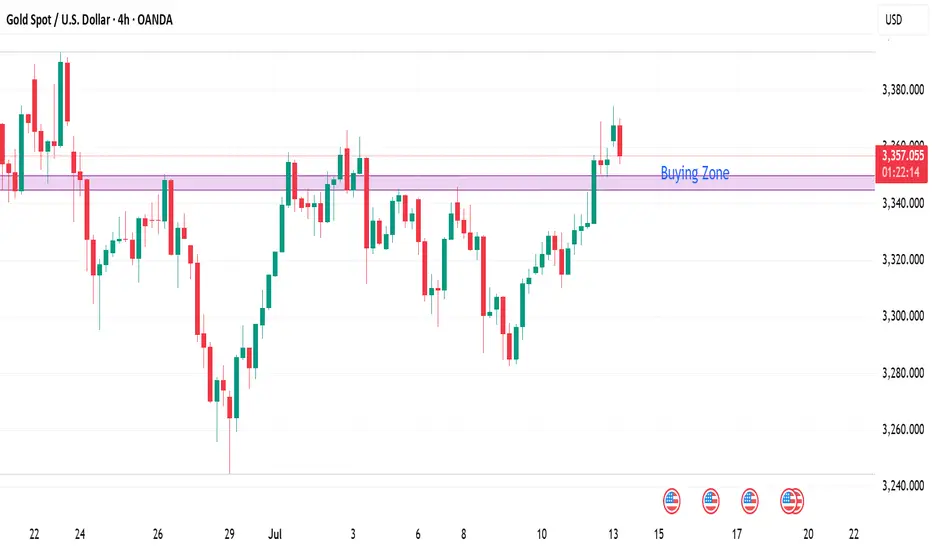
The four-hour chart shows that the price has continued to be suppressed after breaking through the four-hour support last Wednesday. The four-hour level resistance is currently around 3355, and the resistance level has moved up compared with the early Asian market. Therefore, we will pay attention to the pressure at this position in the future. If it fails to break through for a long time, it is likely to fall directly under pressure; pay attention to the support range of 3320-3310 below.
Gold Spot / U.S. Dollar (XAUUSD) - 4 Hour Chart (OANDA)4-hour chart from OANDA displays the price movement of Gold Spot (XAUUSD) from late July to early August 2025. The current price is $3,332.775, reflecting a decrease of $35.935 (-1.07%) as of 07:54 PM PKT on July 25, 2025. Key levels include a sell price of $3,332.480 and a buy price of $3,333.050. The chart shows recent volatility with a shaded support zone around $3,312.314 to $3,367.326, indicating potential price stabilization or reversal areas.

7/25: Key Levels to Watch Closely for Next Week's TradingGood evening, everyone!
Due to health reasons, I had to take a short break from updates — thank you all for your understanding and support.
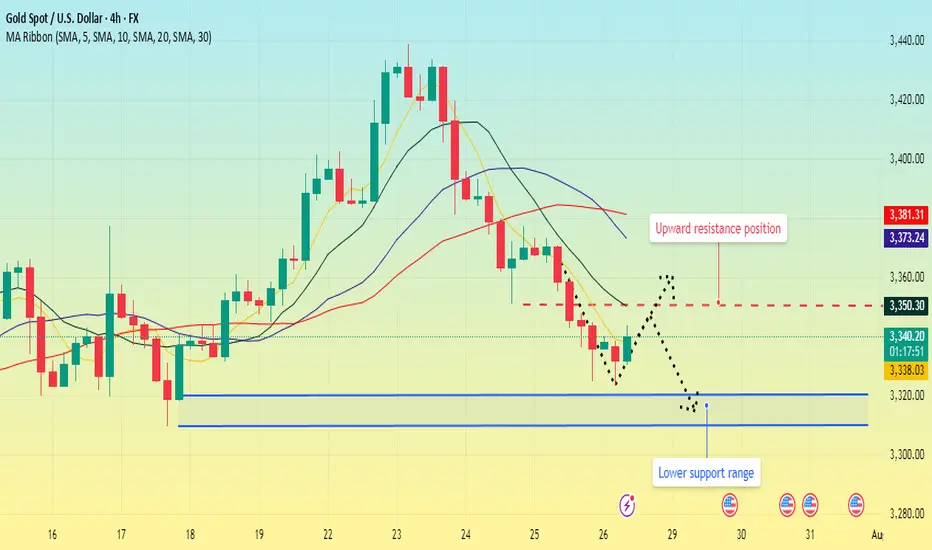
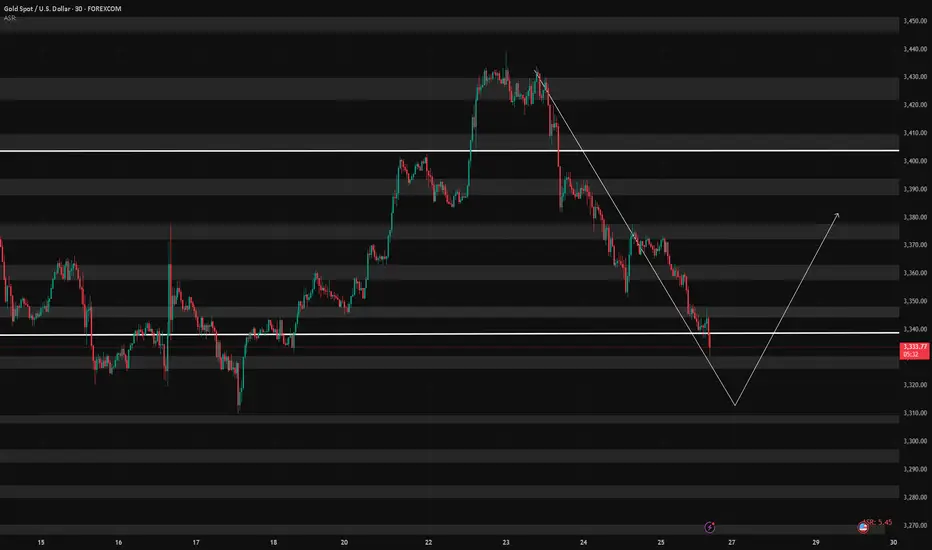
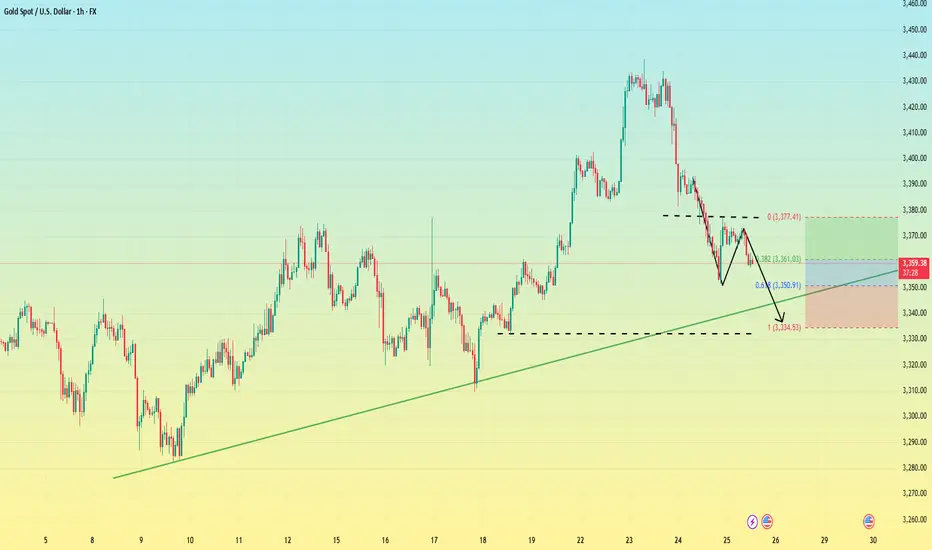
This week, gold rallied to the 3440 level, forming a double-top pattern, and has since entered a phase of consolidation with a downward bias, currently retracing back to the key 3337-332 support area.
While a short-term rebound is possible from the 30-minute chart perspective, the weekly structure is not favorable to the bulls. On the daily chart, price has once again reached the MA60 support, and is currently forming three consecutive bearish candles, which suggests that bearish momentum may continue.
Unless there is significant bullish news next week, the market may remain under pressure. Key levels to monitor:
Upside resistance zones: 3343, 3352, 3358, 3366, 3372, 3378, and 3386–3392
Downside support zones: 3337, 3332, 3323, 3312
If the weekly chart breaks down, watch for: 3300 psychological level and 3260 (weekly MA20)
Additionally, during this week's decline, a price gap has been left between 3395–3398. If the market starts to rebound on the 2-hour chart, there is a chance this gap will be filled. However, this area also serves as strong resistance, and any approach toward it could result in heavy selling pressure. Caution is advised in the event of a sharp rally.
I'm still recovering and unable to monitor the markets for extended periods. Once my health improves, I’ll resume regular updates. In the meantime, feel free to leave any questions, and I’ll do my best to respond. Thanks again for your continued support, and I wish everyone success and strong profits in the market!
Gold is weak. Beware of lows.On Thursday, the dollar index ended a four-day losing streak thanks to the progress of the fund between the United States and its trading partners.
As signs of easing global trade tensions curbed demand for safe-haven assets, gold fell for the second consecutive trading day, and yesterday it hit the 3350 bottom support level.
From the 4-hour chart
although it rebounded to the 3370-3380 range after hitting 3350. But it can be found that the current rebound is actually weak, and it is still maintained at 3360-70 for rectification. At present, the bottom of the 4-hour bottom is absolutely supported at 3340-3335. The rebound high is around 3375. As of now, gold has not rebounded above 3375, and gold is actually in a weak position.
Secondly, from the hourly chart, the weakness is even more obvious. The high point on Thursday was around 3395. Today's current high point is around 3375. It can be seen that if the bottom falls below the 618 position 3350 again, it will directly touch around 3335. It coincides with the target position of 3340-3335 in the previous 4-hour chart.
Therefore, it is not possible to buy the bottom and go long today. Be alert to the possibility of further touching 3340-3335.
Deep Pullback on XAUUSD Gold: What I'm Watching Now🚨 Gold Update & Trade Plan 🚨
Taking a look at Gold (XAUUSD) right now — it's been trending strongly in an uptrend 📈, showing impressive momentum over the past sessions. However, we've recently seen a deep pullback 🔻 that has tapped into a key liquidity pool 💧.
From this level, I'm anticipating a bullish reaction 🔁, and I’m eyeing a potential scalping or intraday opportunity. In the video, we break down:
🔹 Market structure
🔹 Price action analysis
🔹 Trend context
🔹 A complete trade plan
🎯 Entry, stop-loss, and targets are all discussed based on technicals — with precision and discipline.
This is my personal trading plan based on how I read the markets — not financial advice. Trade safe and stay sharp! ⚔️💹

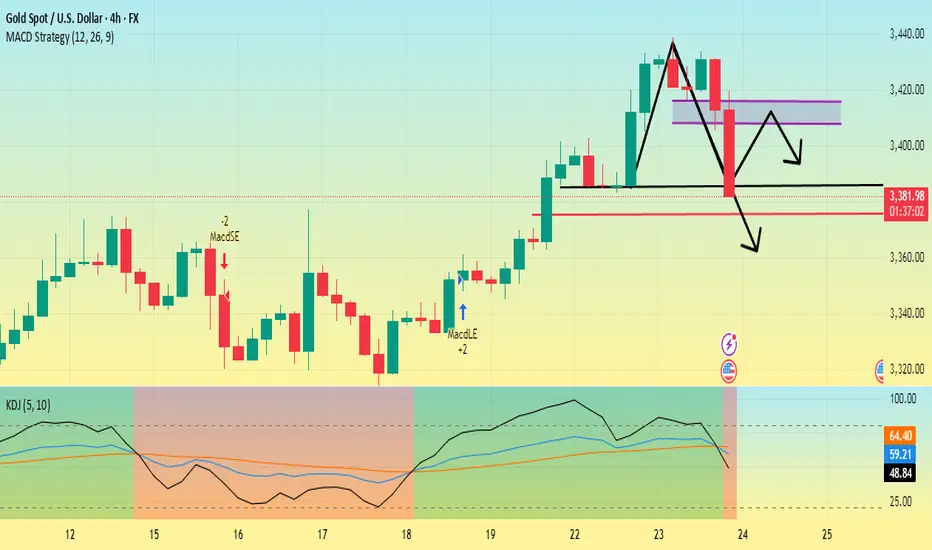
Gold is going down. Can it break through?First, we can look at the daily chart,Currently, the support below the gold daily chart is around 3385, which is also the low point on Tuesday. The current price drop has already touched the support near 3385.
Secondly, from the 4-hour chart, the low point of yesterday's US market retracement was around 3405, and the high point on Monday was 3400. So the first pressure point of this price correction is 3400-3410, followed by the suppression position near 3420.
The 4-hour chart shows that the gold price fluctuated in the 3410-3440 range in the early stage, the MACD red column shortened, and the KDJ dead cross began to appear, facing the pressure of correction in the short term.
At present, the main focus is on whether the 3385 support line can be broken. If it falls below this support level, it will most likely touch around 3375. Then gold will most likely start a downward trend and the rebound will be weak.
XAU/USD: Bearish Rejection at $3,432 – Short Setup in Play🔴 XAU/USD – Bearish Rejection at Key Resistance Zone ($3,432)
🔍 Technical Outlook
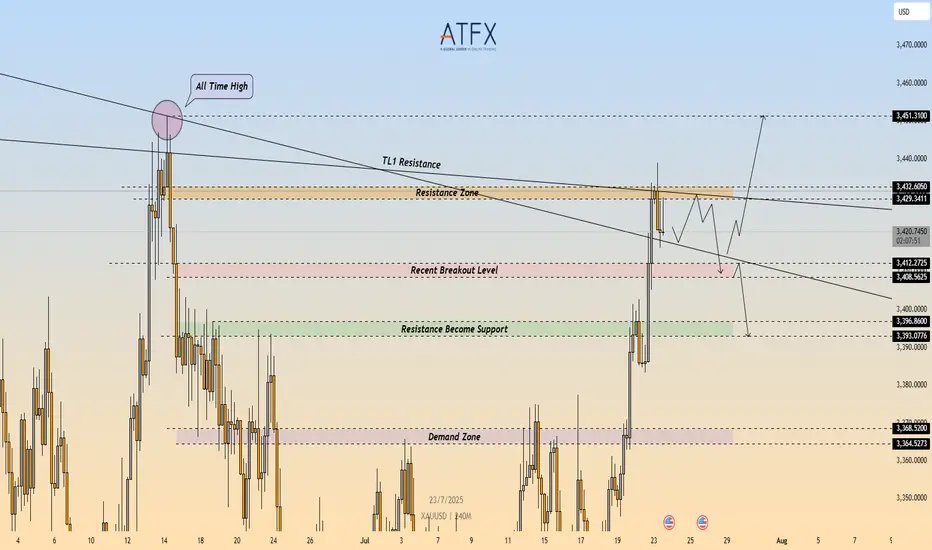
Gold (XAU/USD) failed to break through the $3,429–$3,432 resistance zone, which aligns with a descending trendline (TL1) and prior swing high. The rejection from this confluence zone is reinforcing bearish pressure, with price now carving out lower highs on the 4H timeframe.
A clean break below $3,412 would confirm bearish continuation and open the door toward the $3,400 area, followed by the demand zone at $3,368–$3,365.
🔻 Short Setup
Entry: 3,432
Stop Loss: 3,436
Take Profit 1: 3,412
Take Profit 2: 3,396
R\:R Ratio: ≈ 1 : 6.95
Invalidation: Close above 3,436
📌 Key Levels
Resistance: 3,429 – 3,432
Support 1: 3,412
Support 2: 3,368 – 3,365
Trendline: Long-term descending resistance acting as ceiling
📘 Summary
Gold remains capped beneath a critical resistance cluster. The rejection around $3,432 could trigger a deeper pullback toward $3,396, especially if sellers push price below $3,412. Bearish bias remains valid while price holds under the trendline.
📉 Bias: Bearish
📈 Confirmation Trigger: Break below $3,412
⚠️ Invalidation Level: Above $3,436
XAUUSD SEEMS TO ESTABLISH NEW BULLISH IMPULSEXAUUSD SEEMS TO ESTABLISH NEW BULLISH IMPULSE
The recovery of the gold market appears to have gained momentum in recent days. This has resulted in the precious metal surpassing what appears to be a triangular pattern.
What is a triangle pattern?
A triangle pattern is a chart pattern with converging trendlines, signaling consolidation before a breakout. Types: Ascending (bullish, flat top, rising bottom), Descending (bearish, flat bottom, declining top), Symmetrical (neutral, both trendlines converge). To trade: Identify the pattern (two touches per trendline), wait for a breakout with volume, enter after confirmation, set stop loss below (long) or above (short) breakout, and target the triangle’s height projected from the breakout.
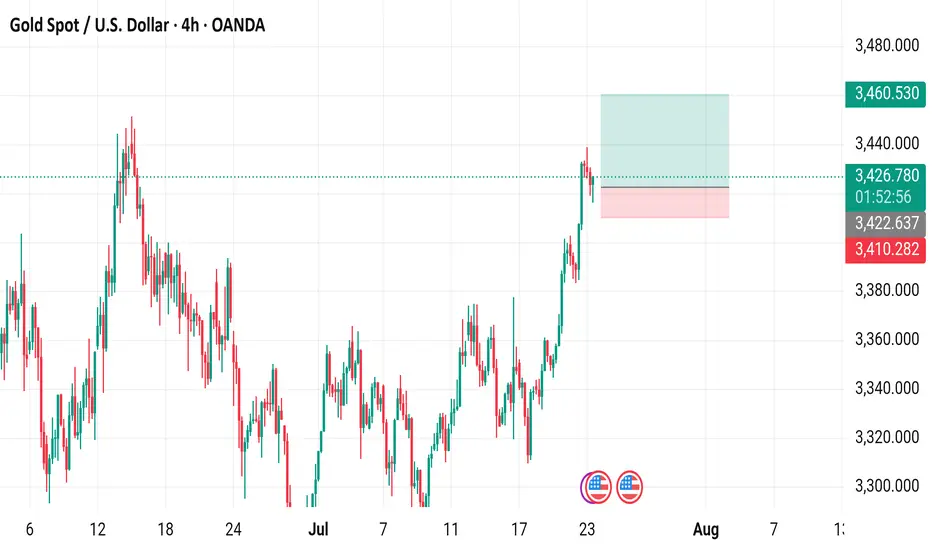
From here, a break above the June high of 3,450.00 would increase the probability of a further rise toward the record high near 3,500.00. But before that slight decline towards upper border of the symmetrical triangle with further rebound is expected.

Gold Spot / U.S. Dollar (XAUUSD) - 4 Hour Chart (OANDA)4-hour chart from OANDA displays the price movement of Gold Spot (XAUUSD) from late July to early August 2025. The current price is 3,426.260, with a recent decrease of 5.185 (-0.15%). The chart shows a buy price of 3,426.580 and a sell price of 3,425.950, with a resistance level around 3,460.530 and support near 3,410.282. The data reflects trading activity as of 01:54:22 on July 23, 2025.
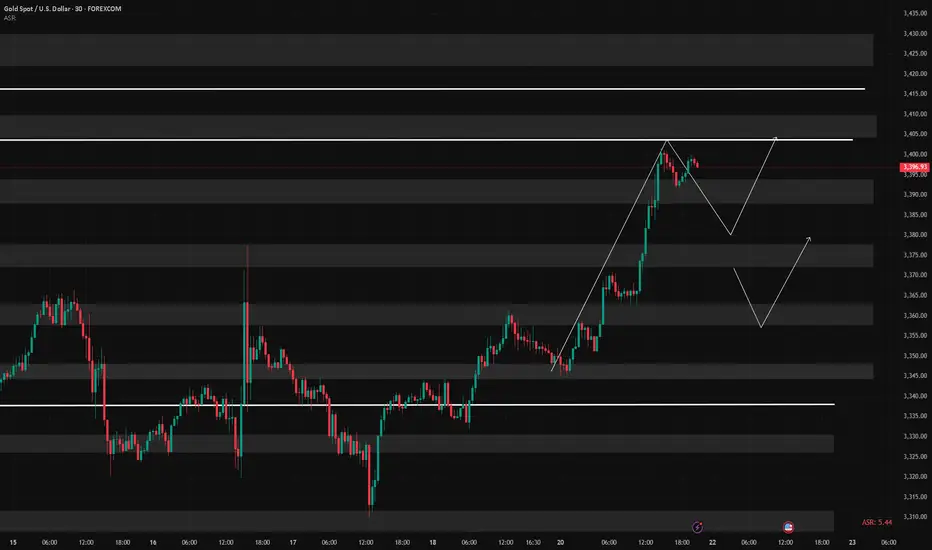
XAUUSD Breakout Structure | Smart Money Bullish Roadmap 🚨 XAUUSD 2H | Smart Money Concept Setup
Price perfectly tapped into demand zone and showed a strong bullish reaction — now forming a clear BOS (Break of Structure).
📍 Key Liquidity Zones:
• Price swept previous lows and is now targeting major liquidity levels marked as “Target Points.”
• Bullish momentum is expected to push price towards 3410 – 3425 range 📈
🔁 Expect possible consolidation before a continuation to upper targets.
💡 Strategy:
Wait for a minor pullback near the 3380–3390 level for confirmation, then ride the momentum to higher targets.
🎯 Target Levels:
1. 3398 ✅
2. 3410 🚀
3. 3425+ (Final Target)
📌 Like, Follow & Save if you caught this early 📊
#XAUUSD #SMC #LiquidityGrab #GoldSetup #TradingViewIdea #SmartMoney #Breakout

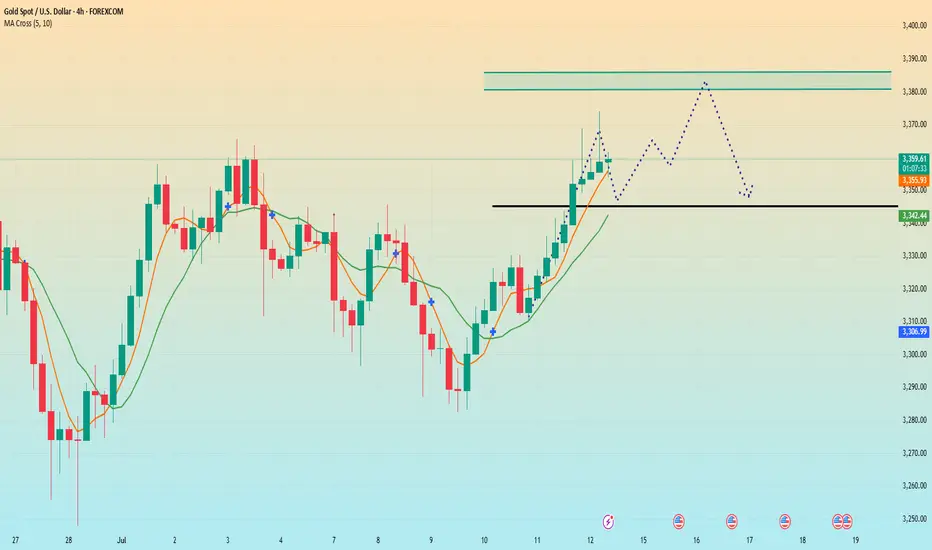
July 21: Key Resistance at 3358–3366, Breakout Targets 3378–3388Good morning, everyone!
Last Friday, gold tested the support around 3332 but did not break below it. The price then rebounded to the 3358 zone, where it encountered selling pressure and pulled back. At today's open, the price retraced to the 3343 level, where support held well, prompting another rally back toward 3358.
It’s important to note that since the 3358 resistance was already tested on Friday, some of the selling pressure has likely been absorbed. As a result, there is a higher probability of a breakout today. If a breakout occurs, the next key resistance lies at 3366/3372–3378. In the case of strong bullish momentum, the price may extend further toward the 3386–3392 resistance zone.
However, if the price continues to be capped below 3358–3366, we may see a consolidation or short-term pullback. In this case, watch support at 3348–3343. Should the price successfully break above 3378, then support on pullbacks will shift higher to 3363 and 3358–3352.
🔺 Key Warning: The 3358 resistance zone is technically crucial. If the price repeatedly fails to break through, watch out for a potential double-top pattern on the 30-minute chart, which could signal a near-term bearish reversal.
7/ 22: Focus on Selling at Highs, Key Support at 3378–3372Good morning, everyone!
I’ve unfortunately injured my lower back and will need to rest in bed for a while, so I’ll keep today’s market commentary brief.
Yesterday, gold rallied to test the 3400 level, a key psychological and technical resistance area that naturally triggered notable selling pressure. Given this, chasing long positions at current levels is not recommended.
On the downside, support is seen near 3378. If this level holds, the price may attempt another rebound. On the upside, key resistance levels to watch are:
3407 as the initial resistance
3416–3423 as the stronger resistance zone
For today’s trading strategy, consider focusing on selling into strength near resistance levels. Once the selling pressure is absorbed, there may be an opportunity to re-enter on the long side at lower levels, allowing for better risk management and entry conditions.
Gold (XAU/USD) Technical Outlook — 21 July 20251. Market Overview & Live Price Confirmation
Gold is currently trading around $3,354, with a daily range of approximately $3,345–$3,359. This places it firmly within its broader uptrend, showing resilience amid recent macro uncertainties and consolidating its position above key support zones.
2. Four-Hour Technical Breakdown
Trend & Structure
The 4-hour chart reveals a strong bullish structure, marked by consistent higher highs and lows. A recent Break of Structure occurred near $3,324, reinforcing the upward bias. A minor Change of Character around $3,360–$3,358 reflects a healthy retracement, but the bigger picture remains strong.
Key SMC & ICT Zones
Supply Zone: $3,360–$3,362 — recent peak area likely to attract sellers and sweep above liquidity.
Demand Zone: $3,340–$3,344 — aligns perfectly with the 38.2% Fib from the $3,308–$3,362 swing, forming a prime area to buy from.
Order Block / FVG Zone: $3,336–$3,342 — open imbalance suggesting price may revisit for efficient entry.
Liquidity Context: Order flow patterns indicate stop hunts around established zones — part of classic Smart Money Concepts.
Fibonacci Levels
38.2% retrace at $3,340, offering medium-term confluence support.
Upside projections via Fibonacci:
1.272 extension: $3,378
1.618 extension: $3,389
3. One-Hour Intraday Trading Setups
Aligned with the 4-hour bullish bias, these setups offer scalable, structured entry opportunities.
Strategy Entry Zone Stop-Loss Take-Profit Risk:Reward
Aggressive Long $3,344 $3,338 $3,358 → $3,362 ~2:1
Conservative Long $3,340 $3,330 $3,362 → $3,378 ~2.5:1
Short Opportunity Rejection @ $3,362 $3,368 $3,344 ~2:1
🌟 The Golden Setup
Buy within $3,340–$3,344 (4H demand + Fib zone + FVG)
Stop-Loss: $3,330
Take-Profit 1: $3,362 (range high)
Take-Profit 2: $3,378 (Fib 1.272)
Why It Works: A confluence of structural support, liquidity zones, and retracement levels gives this setup high predictive quality.
4. Analyst Consensus Snapshot
Market commentary from professional analysts shows alignment with dip-buy strategies. Most recognize the $3,340 region as key support and express caution entering $3,360–$3,375 resistance. Weekly forecasts describe tight trading with potential for breakouts or retracements depending on economic data and Fed commentary, but the medium-term trend remains bullish.
5. Summary & Trading Blueprint
Price Range: $3,345–$3,359 (daily); $3,338–$3,378 (targets)
4-Hour Bias: Bullish, with defined demand and supply zones
Golden Trade: Buy $3,340–3,344 → SL $3,330 → TP1 $3,362 / TP2 $3,378
Catalysts to Watch: Federal Reserve speech, tariff developments, USD movements.
6. Final Thoughts
Gold continues to demonstrate bullish resilience, supported by both technical structure and macro tailwinds. The $3,340–3,344 zone offers a clear, high-probability entry confluence, while stop placement and profit targets are well-defined. Profit management around $3,360 ensures disciplined scaling or early exits if risk factors emerge.
By blending price action, Smart Money frameworks, ICT concepts, and Fibonacci confluence—all structured into actionable trade setups—you have a professional-grade playbook ready for deployment.

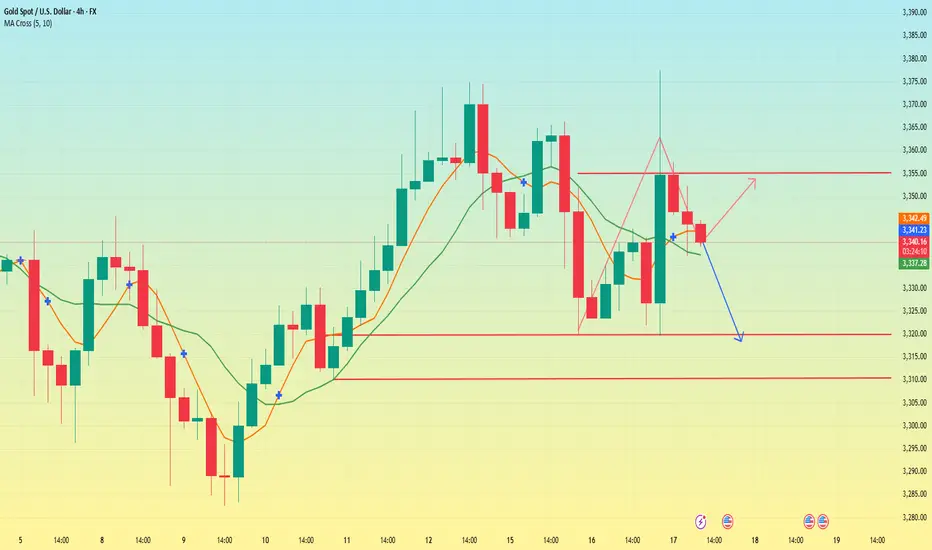
GOLD Intraday Chart Update For 17 July 2025Hello Traders, welcome to new Trading day
Today we have some high impact news of USD, Currently market is still in tight range and we still need breakout of 3300 Psychological for downside clearly
For upside market must need to close above 3380-90 zone for further upwards continuation
currently we are also keep an eyes on WAR Fundamental news
Disclaimer: Forex is Risky
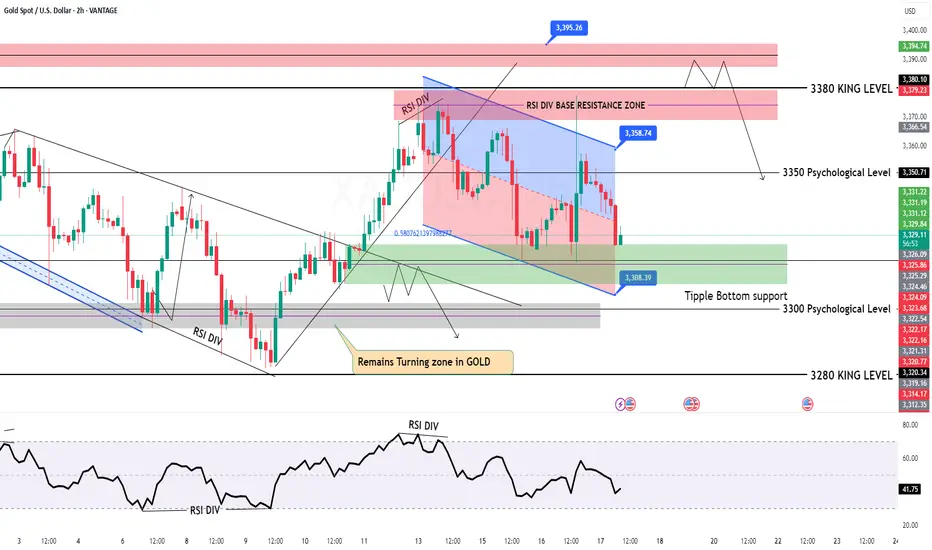
Gold (XAU/USD) Technical Outlook: July 17, 2025🔷 Market Context and Current Price
As of July 17, 2025, gold (XAU/USD) is trading near $3,341, slightly above the week’s midpoint. The metal remains range-bound but shows signs of bullish resilience as it tests key structural support zones. Today’s analysis integrates advanced technical methodologies — including Price Action, Fibonacci tools, ICT and Smart Money Concepts — to present a clear directional bias and actionable trade ideas.
📊 4‑Hour Chart Analysis
1️⃣ Price Structure & Trend
Gold has maintained a sideways-to-upward bias, consolidating between $3,320 (support base) and $3,377 (range resistance). Higher lows since early July reinforce the short-term bullish narrative, though price remains capped by supply in the upper 3,370s.
No decisive Break of Structure (BOS) has yet occurred, keeping price within this range. However, minor bullish BOS signals have appeared near $3,332–$3,334, with a confirmed Change of Character (CHOCH) around $3,320–$3,324, as buyers repeatedly defended this level.
2️⃣ Smart Money Concepts & ICT Insights
Demand Zone / Order Block (OB): $3,332–$3,334. This zone aligns with a recent fair value gap and bullish order block.
Supply Zone / OB: $3,355–$3,359, corresponding to prior inefficiencies and institutional selling.
Liquidity Levels: Sell-side liquidity was swept near $3,320 earlier this week, suggesting smart money accumulation below prior lows.
Fair Value Gap (Imbalance): Present at $3,332–$3,333, partially filled and offering a strong risk-reward for long setups.
3️⃣ Fibonacci Levels
Using the recent swing low ($3,320) and swing high ($3,377), Fibonacci retracements show:
38.2%: ~$3,342 — currently being tested.
50%: ~$3,348 — an interim bullish target.
Fibonacci extensions project potential upside toward $3,401 if momentum strengthens beyond the range top.
4️⃣ Key Levels Summary (4H)
Zone Level
Demand / Buy Zone $3,332–$3,334
Structural Support $3,320
Interim Pivot $3,340–$3,342
Supply / Sell Zone $3,355–$3,359
Range Ceiling $3,375–$3,377
🔷 Directional Bias and Strategy
The 4-hour structure remains neutral-to-bullish, favoring upside so long as the $3,332–$3,334 demand zone holds. A confirmed BOS above $3,342–$3,344 could accelerate bullish momentum toward $3,355–$3,360 and even $3,375. Conversely, a breakdown below $3,332 risks revisiting $3,320 and potentially $3,300.
⏳ 1‑Hour Chart – Intraday Trade Setups
The 1-hour timeframe reveals tactical opportunities aligned with the broader bias:
Setup Direction Entry Stop Loss Take Profit
Setup A – Smart Money Long Long $3,334 $3,329 $3,348 / $3,355
Setup B – Breakout Long Long $3,344 (after breakout) $3,340 $3,355 / $3,375
Setup C – Range Short Short $3,355–$3,359 $3,362 $3,340 / $3,332
🏆 The Golden Setup
Setup A – Smart Money Long offers the highest statistical edge:
Entry: $3,334 (at demand OB / FVG)
Stop Loss: $3,329 (below structure)
Take Profits:
TP1: $3,348 (pivot)
TP2: $3,355 (supply zone)
R:R Ratio: ~2.8:1
This setup benefits from multi-timeframe confluences: demand zone, fair value gap, bullish CHOCH, and proximity to BOS, making it a high‑conviction trade.
🔷 External Consensus Check
An alignment scan of professional analyst views shows strong consensus:
Buy interest remains concentrated around $3,332–$3,335.
Profit-taking and caution advised as price approaches $3,355–$3,377.
No notable divergence in professional outlook — most remain cautiously bullish above $3,332.
📜 Summary Report
✅ Bias: Neutral-to-bullish above $3,332; downside risk below.
✅ Key Levels: $3,332–$3,334 (buy zone), $3,355–$3,359 (sell zone), $3,375–$3,377 (range ceiling).
✅ Top Trade: Long from $3,334 with stops under $3,329 and targets at $3,348/$3,355.
✅ Alternate Trades: Breakout long above $3,344 or short from supply near $3,355.
✅ Confidence Zones: Buyers dominate above $3,332; sellers reappear above $3,355.
Conclusion
Gold remains in a well‑defined range, with smart money likely accumulating near the lower boundary at $3,332. With structural supports intact and demand zones respected, the path of least resistance favors cautious upside toward $3,355 and possibly $3,375. Intraday traders are advised to focus on precise execution within the outlined confidence zones, maintaining discipline around stops and targets.
The current market structure rewards patience and alignment with institutional footprints — positioning ahead of breakout confirmation, while respecting range extremes.

TACO trading reappears. Gold is down.The news that Trump intends to fire Powell caused a decline in US stocks and bonds, and gold prices soared in response. But then Trump denied the news, and the market subsequently fell back to stabilize.
On Wednesday, the Asian market began to fluctuate and rise in the early trading. It rose to a high of 3343 in the European market and then fell to 3319 in the US market. Then it rose sharply due to the news. It rose to a high of 3377 and then fell to 3336. It fluctuated around 3350 in the late trading. The daily line closed with a positive line with an upper shadow line.
The recent market trend fluctuated violently. Since last Wednesday, there have been three consecutive positive rises. This week, there have been two consecutive negative declines on Monday and Tuesday. On Wednesday, it closed positive after washing up and down. At present, the MA5 and 10-day moving averages have formed a golden cross, but the direction is unclear. The Asian market opened above the moving average on Thursday. The overall pattern needs to pay attention to the breakthrough of the key points of long and short positions.
Today, the focus below is on the support near the low point of 3320, followed by the support near 3315 and 3310. This position is the trend line support formed by the previous low point connection. If it breaks down, we need to pay attention to the position of 3280. The upper resistance level is mainly concerned with the resistance near 3355, which is the rebound high point after the US market hit 3377.
Today, the operation needs to adjust the strategy according to the breakthrough of key points. In the volatile market, we need to be vigilant about the sudden fluctuations caused by the news. After breaking the key support or resistance, the trend direction may be further clarified.
Gold Spot Price (USD) - 4-Hour Chart (OANDA)4-hour performance of the Gold Spot price against the U.S. Dollar (OANDA). The current price is $3,223.660, reflecting a 1.3% decrease. Key levels include a resistance zone around $3,360.405 and a support zone near $3,294.070, with recent price action showing a potential breakout or reversal within these ranges.

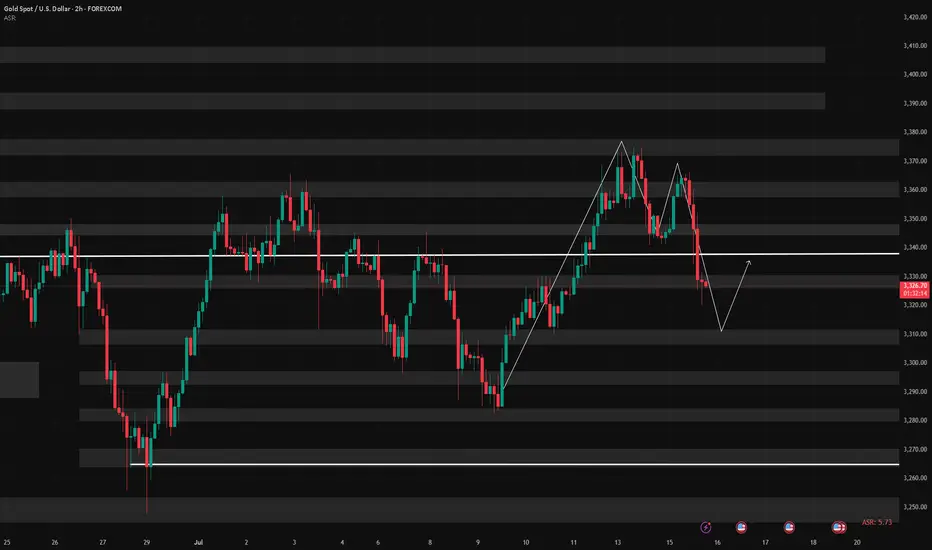
7/16: Will Gold Reclaim 3350 or Fall to 3250?During today’s session, gold briefly broke through the 3352–3358 resistance zone, but due to news-driven pressure during the pullback, bullish momentum weakened, and the price retreated to the MA60 support level on the daily chart.
Given the significant retracement, there is a possibility that a short-term bottom may form during the upcoming Asian session, potentially leading to a retest of the 3337-3343/3352-3358 resistance area:
If the price breaks above this zone and holds above it after a pullback, the bullish trend could resume;
However, if it fails to break through or is rejected again, caution is warranted, as this could signal a larger-scale downtrend on the weekly chart, possibly targeting the 3250 area.
Affected by tariffs, gold rose again.On Saturday, Trump announced that he would impose a 30% tariff on goods imported from the European Union and Mexico from August 1. This news triggered a rise in risk aversion in the market. As a traditional safe-haven asset, gold was once again sought after. The price continued the rise on Friday and continued to open high in the early Asian session. As of now, the highest price reached around 3373.
From the current market point of view, after breaking through the triangle pattern last Friday, there was a sharp rise. The price successfully stood on the short-term moving average, showing an overall bullish trend. However, it should be noted that the short-term moving average has not yet formed an upward cross, which means that there is a high possibility of a confirmation process in the future. Looking back at the trend in the past two months, gold rarely opens high and then continues to rise. Most of them open high and go low. Therefore, under the current situation, although it is bullish overall, it is not advisable to blindly chase more. It is more suitable to wait for a decline before arranging more orders. The key lies in grasping the decline position.
From the perspective of pressure level, 3380-3385 is the first pressure level, and the second pressure level is 3395-3400. The support level below is around 3345, which is also the pressure level that has been emphasized in the early stage, and the top and bottom conversion position. For today's operation, Quaid recommends low-to-long.
Operation strategy:
Short near 3380, stop loss 3390, profit range 3360-3345
Long near 3345, stop loss 3335, profit range 3360-3380
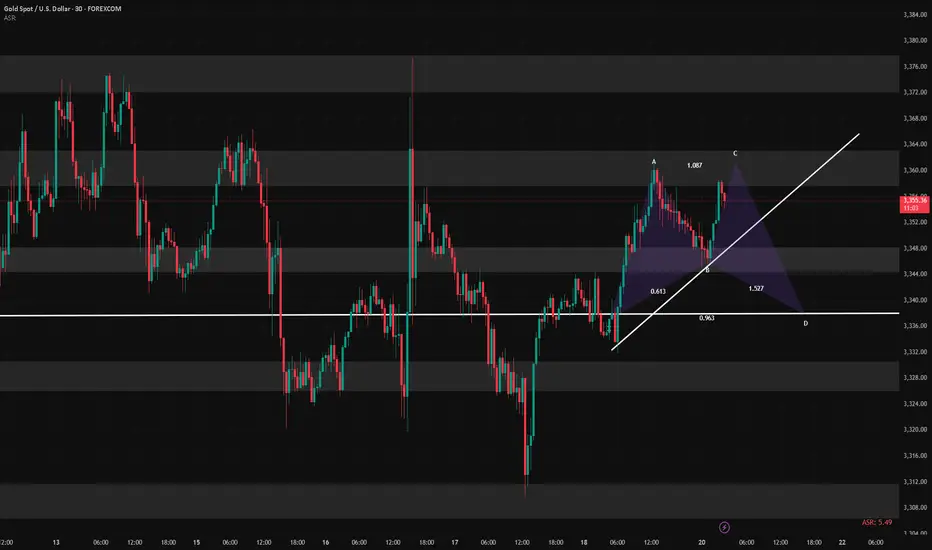
Market Structure & Technical Context 14 July 20241. Price Action & Market Structure
Gold has broken recent swing highs above ~$3,360, marking a bullish Break of Structure (BOS) and signaling upward momentum continuity
Recent pullback zones around $3,350–$3,340 formed a clear Higher Low (Change of Character) — textbook price action confirmation.
2. Fibonacci Retracement / Extension
Measuring from the last swing low near ~$3,326 to swing high ~3,374:
38.2% retracement at ~$3,352 coincides with the current bounce zone.
50% retracement at ~$3,350 aligns with key structure support.
Upside extension targets: 1.272 at ~$3,396, 1.618 at ~$3,425 — overlapping major resistance zones
3. ICT & Smart Money Concepts (SMC)
Order Blocks (OBs) identified near $3,340–$3,342 (prior resistance turned support) — ideal demand zone.
A recent Buy-side liquidity grab eclipsed above $3,360, sweeping stops and gathering liquidity before the breakout — classic ICT setup .
A Fair Value Gap (imbalance) lies around $3,345–$3,350 — zone to expect value-driven retracement.
Higher timeframe has clear SMC alignment: BOS above 3,360 with CHoCH already formed.
4. Major Supply / Demand & Support / Resistance Zones
Demand: $3,340–$3,352 (OB + Fib + BOS confluence).
Supply: $3,380–$3,385 (intraday swing high resistance), followed by zone at $3,396–$3,400.
Key resistance at $3,360–$3,362 — confirmed supply pocket that needs to be reclaimed
5. Moving Average Confirmation
The 4‑hour SMA/EMA 100–200 band is sloping up just below current price (~$3,340–$3,350), reinforcing the bullish context .
1‑Hour Intraday Setups (Aligned with HTF Bullish Bias)
Setup A: Pullback into 4‑Hour OB / Fair Value Gap
Entry: Limit buy at $3,345–$3,350.
Stop: Below $3,335 (below imbalance & BOS).
TP1: $3,362 (former resistance).
TP2: $3,380 (next supply block).
Setup B: Breakout Retest of 3,360
Entry: Buy on retest of broken resistance at $3,360.
Stop: Below $3,356.
TP1: $3,380.
TP2: $3,396 (Fib extension confluence).
Setup C: Momentum Continuation Fresh Breakout
Entry: Market buy on clear H1 BOS above $3,365.
Stop: Below breakout candle low (~$3,360).
TP: $3,396 (1.272 Fib) – extend to $3,425 if momentum strong.
The Golden Setup:
Setup A—buy from $3,345–$3,350—has strong confluences:
4‑hour demand OB + fair value gap,
38.2–50% Fib retracement,
SMC BOS/imbalance alignment,
ICT-style order block zone.
This offers high edge with confluence clusters.
✔ Summary Report: Direction & Key Zones
Directional Bias:
Medium-term (4H): Bullish, confirmed by BOS above 3,360, higher lows, OB and Fibonacci alignment.
🔹 Primary Buy Zones:
$3,345–$3,350 — 4H OB + fair value gap + Fib.
$3,360 on retention — breakout retest zone.
Momentum entry >$3,365.
🔹 Key Target Zones:
First resistance: $3,360–$3,362.
Next supply: $3,380–$3,385.
Extension target: $3,396 (1.272 Fib), then $3,425 (1.618 Fib).
🔻 Watchdownside Risk:
Daily invalidation if drop below $3,335 (4H OB break).
Next support at $3,326–$3,330.
📋 Consolidated Table: Setups at a Glance
Setup Entry Zone Stop Targets
Golden $3,345–$3,350 $3,335 TP1: $3,362 / TP2: $3,380
Breakout Pullback $3,360 retest $3,356 $3,380 → $3,396
Momentum BOS >$3,365 (H1 BOS) < $3,360 $3,396 → $3,425
Final Thoughts
On the 4‑hour chart, price is firmly in a bullish regime, supported by price structure, SMC, ICT concepts, and Fibonacci confluence. The $3,345–$3,350 zone is the highest‑probability entry for buyers, offering excellent risk/reward. The Golden Setup targets ~$3,380 and beyond, combining structure, gap fill, and liquidity strategy.