Gold prices remain strong as tariffs heat up again
Hey everyone, let's comment on the gold price next week from May 26, 2025 to May 30, 2025,
📌 Driving Events
Gold prices resumed their upward momentum on Friday, surging nearly 2% on the day and up more than 5% for the week as the dollar weakened amid renewed trade tensions. Gold prices rebounded from an intraday low of $3,287 to $3,359 as escalating rhetoric from Washington fueled investor demand for safe-haven assets.
U.S. President Donald Trump has intensified the trade standoff with the European Union, declaring that negotiations are "going nowhere" and threatening to impose a 50% tariff on EU imports from June 1. For months, Fed policymakers have made it clear that they want more clarity on the response from fiscal and trade policies and the economy before taking further action on interest rates. Over the past month, this cautious stance has prompted traders to withdraw their bets on a rate cut in the June meeting, and the market now expects the policy pause to continue until the July meeting. However, futures market positions show that the probability of a rate cut before the end of September is still slightly above 50%. This is essentially a bet that the situation will become clearer in the next four months: either slowing inflation paves the way for policy easing, or the economic deterioration forces the Fed to increase stimulus.
📊Comment Analysis
Tariff news has begun to heat up again, and the United States and the rest of the world have not yet reached a consensus on negotiations, and gold prices have benefited from this rise. The big time frame shows that the price is breaking out and continuing the upward trend
Technical:
Based on the resistance and support levels of gold on the 4-hour chart, Labaron has identified the following important key areas:
Resistance: $3412, $3436
Support: $3315, $3280, $3245
⭐️ Note: Labaron hopes that traders can properly manage their funds
- Choose a lot size that matches your funds
- Profit is 4-7% of the capital account
- Stop loss is 1-3% of the capital account
Xauusd4h

Tariff threat. Gold prices rose sharply?Information summary:
Gold prices climbed in the short term during trading after Trump threatened to impose new tariffs on the European Union, as this increased market uncertainty and increased demand for safe-haven assets. Trump said in a post on Truth Social that he suggested a 50% tariff on the European Union starting June 1, and complained that trade negotiations were stalled.
After the news came out, gold prices rose rapidly, breaking the $3,345 resistance level, but did not stabilize above the $3,365 resistance level I predicted in the morning; it reached a high of around $3,360 and then fell back slightly.
I think the short-term gains have been too large, and if there is a rapid adjustment, the amplitude will also be large.
Technical analysis:
From the 4-hour chart, gold prices continue to trade above all moving averages, and the 20-day moving average has broken through the 100-day and 200-day period moving averages. At present, indicators show that the upward momentum is not very strong.
If the price breaks through the 3365 resistance level strongly, it may hit the cycle high of around 3380.
Because of the weekend, if the resistance level fails to be broken strongly, the price may adjust in the range of 3360-3330 US dollars, and a new trend needs to be found.

Will gold continue to rise? Be alert on Friday.On Thursday, the US dollar rebounded after three consecutive days of decline and once returned to above the 100 mark, but failed to stand firm here. It is still maintaining at the 100 mark for consolidation. Due to the strengthening of the US dollar, gold began to retreat after hitting a high of 3345 yesterday, and once lost the 3300 US dollar mark, with the lowest reaching around 3280.
First of all, from the current 4-hour chart of gold:
In the Asian session, the lowest gold touched around 3290, and then rebounded. As of now, the highest reached around 3330. At present, 3310 should be a relatively important support position for gold. If it can be maintained above 3310, then gold may continue to rise. It can also be seen from the figure that once it continues to rise, 3345 is likely to be refreshed, and the highest should be around 3360.
From the 1-hour chart:
3280-3330 range, around 3310 is exactly the current 618 position. Therefore, if gold cannot pull back below 3310 again, it is highly likely that it will continue to reach a new high.
Secondly, as time goes by, the early low of 3290 can no longer be touched, and the current support is already near 3300. That is to say, it cannot fall below 3300 again. Once it falls below 3300, gold will refresh the low of 3280 and continue to fall.
Operation strategy:
If it can retreat to 3310 and stabilize, then we will go long at 3310.
On the contrary, if it falls below 3310, then we will focus on 3300. Once it falls below 3300, the trend will go down.
Then you can short at 3290-3300, and the profit range is around the early intensive trading area of 3260-3250.

How will the price of gold go? Prospect analysis is here.In the Asian session, spot gold rebounded modestly after a sharp drop in the previous trading day, and the price of gold is currently around $3,330.
Gold prices lost some upside momentum on Thursday, but downside remains limited. Gold prices suffered a correction on Thursday, ending the previous three consecutive trading days of gains, mainly due to the rebound of the US dollar and traders taking profits after the price of gold hit a two-week high. Spot gold closed down $20.14, or 0.61%, at $3,294.81 per ounce on Thursday.
We see gold encountering some profit-taking selling pressure after its recent gains, while a stronger U.S. dollar index is another bearish factor. However, affected by the turmoil in the global bond market, the gold market continues to be bullish and the decline is limited.
Short-term technical analysis:
Looking at the gold daily chart, the high point of gold prices on Thursday moved up from the previous trading day, while the low point moved down. Buyers continue to defend on the downside near the flat SMA 20-day, which provides support near $3,288.00. The 100-day and 200-day moving averages continue to move upwards at levels well below current gold prices, consistent with the dominant bullish trend. Finally, technical indicators have lost bullish power but are flat within positive levels, limiting the possibility of further declines.
Looking at the 4-hour chart, there is no sign that gold will fall further. Gold prices continue to trade above all its moving averages, with the 20-period SMA crossing above the directionless 100-period SMA and 200-period SMA. Meanwhile, technical indicators are moving lower, but with limited downside power, they remain above their midlines.
Short-term focus on important support and resistance levels:
Support: $3,290; $3,270; $3,250.
Resistance: $3,325; $3,345; $3,360.
I hope my analysis can help you make profits easily in the trading market.

XAUUSD Market OutlookMy current bias on XAUUSD remains bullish, as we are targeting the lower high (LH) around the 3,438 level. However, the market is currently in a pullback phase within the LH & LL. Price has entered an OTA level within a Daily Fair Value Gap (FVG), ranging between 3,370 and 3,333. This presents a potential opportunity for short setups as we move towards the 3,251 level.
On the 4-hour timeframe, there's a valid FVG Breaker near our Fibonacci-based OTA level, aligning closely with the 3,251 support zone. This is a key area to watch for bullish confirmations. Any long positions should ideally be considered from this zone.
Important Note:
When trading gold, patience and discipline are essential. Only act on clear, confirmed setups that align with your strategy. Quality over quantity always wins in the long run.

Gold is going down? Is the trend going to change?The previous rally continued in the early Asian session on Thursday, reaching a high of around 3345.
However, it then began to fall rapidly. So far, gold has fallen below the 3300 mark again, with the lowest point reaching around 3280.
From the daily chart:
Gold is currently at 3280, which is the moving average support position. If it falls below 3280, the market will test 3250-3260 below. This position is not only the current daily moving average support position, but also an important barrier position in the past. This is an important suppression position for the upward trend of gold this time.
Similarly, if it wants to fall, 3250-60 is also an important support position.
Secondly, let's look at the 4-hour chart:
If it really falls below the bottom of the range at 3280, then as I said above, it will test 3250-3260. However, if it fails to break the support near 3280, it is very likely to maintain consolidation in the 4-hour range.
And from the range point of view, the fluctuation range is very large. It is basically maintained in the range of 3320-3280, which is about 40 US dollars. I suggest that we should still pay attention to whether the support here at 3280 can stabilize. If it can stabilize at this position, and there is a bottom signal at 3280, then you can go long near 3280. Sell high and buy low according to the range of 3280-3320.
On the contrary, if it falls below the support of 3280, don’t go long. It is very likely to directly test the support position of 3250-60 later.

Gold breaks upward, space opens up
📌 Driving events
Internationally, US media reported that US intelligence agencies found that Israel was preparing to attack Iran's nuclear facilities, and gold and crude oil both soared in the short term.
Recently, the Iran nuclear talks and the Russia-Ukraine talks were carried out simultaneously, and the market risk aversion sentiment fluctuated greatly
📊Comment analysis
While the medium and long-term outlook continues to be bullish on gold's performance this year, short-term operations are mainly based on news. Pay attention to light positions and maintain flexibility in short-term operations.
💰Strategy Package
🔥Buy Gold Zone: 3310-3315 SL 3307 Scalping
TP1: $3318
TP2: $3325
TP3: $3330
🔥Sell Gold Zone: 3354-3356 SL 3361
TP1: $3345
TP2: $3332
TP3: $3320
🔥Buy Gold Zone: $3252 - $3250 SL $3245
TP1: $3260
TP2: $3270
TP3: $3280
⭐️ Note: Labaron hopes that traders can properly manage their funds
- Choose the number of lots that matches your funds
- Profit is 4-7% of the fund account
- Stop loss is 1-3% of the fund account

Will gold continue to rise to 3280-3330 today?Hello everyone. Let's discuss the trend of gold this week. Today, Moody's downgraded the US sovereign credit rating from AAA to Aa1 on the grounds of "debt surge and fiscal out of control", ending the US's last "top credit" title among the three major rating agencies.
Due to this influence, gold opened sharply higher today, Monday, and the highest so far is around 3250.
Here is the 1-hour chart:
If gold can continue to rush above 3250 in the short term, then we will see 3280-3300 later.
The high point of 3250 may be broken at any time.
For now, I think that as long as gold is above 3200 today, gold will continue to rise.
So, if you do it in the short term, you can buy in the 3200-3220 range, with 3200 below as defense, and as long as the upper target stands firm at 3250, you can continue to see the 3280-3300-3330 range.

5/20 Gold Trading SignalsGood afternoon, everyone!
Last Friday and yesterday, gold did not reach our primary buy or sell zones, instead moving within a narrow range. We captured two trades, gaining about $32 in total movement, resulting in moderate but stable profits.
After opening today, the price pulled back toward the 3200 area, which holds technical support. However, resistance remains dense above, especially between 3226 and 3243. For bulls to break through, stronger momentum and volume will be required.
On the news front, there are no major economic events or key speeches scheduled today, so technical trading will dominate.
Currently, gold continues to consolidate. If intraday volatility remains limited, traders can look to buy low and sell high within the 3243–3189 range. Watch for resistance around 3226 and support at 3198 as key technical levels.
📌 Trading Strategy for Today:
🟢 Buy Zone: 3189 – 3168 (Near support, suitable for bottom fishing)
🔴 Sell Zone: 3267 – 3288 (Close to resistance, good for shorting)
🔄 Scalping/Flexible Zones:
▫️3198-3218-3226-3238-3247-3255
📌 Note: Maintain proper position sizing, set clear take-profit/stop-loss levels, and stay flexible. If there's unexpected news or a breakout during the U.S. session, strategies will be adjusted accordingly.

Gold fell below 3,200 today?
📌 Driving Events
In early Asian trading on Tuesday, gold prices (XAU/USD) fell slightly to around $3,230, affected by a slight rebound in the US dollar (USD). However, continued concerns about the health of the US economy - especially after Moody's recent credit rating downgrade - may help limit further downside for precious metals. The rebound in the US dollar has curbed the upward momentum of dollar-denominated assets such as gold. Nevertheless, heightened economic uncertainty is still supporting safe-haven demand. Moody's downgraded the US sovereign rating from "Aaa" to "Aa1" on Friday, citing its rising debt levels and interest payments that have exceeded other similarly rated countries. These developments have kept risk sentiment fragile and provided potential support for gold prices.
📊Comment Analysis
Accumulating along the upper and lower trend lines, the gold price will break out and require more liquidity than the downward trend
💰Strategy Package
🔥Sell Gold Zone: 3224-3226 SL 3230 Scalping
TP1: $3215
TP2: $3208
TP3: $3200
🔥Sell Gold Zone: 3276-3278 SL 3283 Scalping
TP1: $3260
TP2: $3250
TP3: $3240
🔥Buy Gold Zone: $3152 - $3150 SL $3145
TP1: $3165
TP2: $3180
TP3: $3195
⭐️ Note: Labaron hopes that traders can properly manage their funds
- Choose the number of lots that matches your funds
- Profit is 4-7% of the capital account
- Stop loss is 1-3% of the capital account

Will gold fall to 3180-3158?Hello everyone. Let's discuss the trend of gold this week. If you have a different opinion, you can express your different opinions in the comment area. Yesterday, Monday, retail traders made a record bottom-fishing in US stocks, reversing the 1% drop in the S&P 500 index caused by Moody's downgrading the US credit rating last weekend.
Yesterday, Monday, gold opened at a high point near 3250, but after the US stock market opened, it basically maintained a downward trend.
From the current 1-hour chart, gold has been fluctuating above the 1-hour chart range yesterday, Monday, but there has been a change today. It has continuously fallen below the hourly chart range support position at the opening.
Therefore, from the current point of view, gold is likely to retreat downward today, and the 3200 mark is currently difficult to hold.
Therefore, we must be alert to the possibility of a retracement today. As for the operation, you can rely on the 3220-3225 range to sell, and look at the target to 3180-3158.

The market trend is highly consistent with the chart analysisGold opened with a gap up today, returning to the decline starting point near 3,252 last Friday before falling again. The short-term trend has entered a repeated oscillation, but the key level of 3,200 has not been broken.👉👉👉
On Monday, the international gold price rebounded by more than 1%, boosted by a weaker U.S. dollar and increased safe-haven demand. Gold first fell to the 3,206 level before recovering to the 3,250 level, reversing the early session decline. Gold has been under pressure in recent weeks as markets gradually digest stagflation expectations and reprice rate-cut expectations. The market now expects the Federal Reserve to cut rates by about 58 basis points by the end of the year, compared with the peak expectation of 120 basis points during the panic in April.
From the analysis of the 4-hour chart, the lower support continues to focus on the vicinity of 3170-75. The primary support level is the 3150 threshold, and the important resistance to pay attention to is 3270-3280. Overall, within this range, the main tone of participating in a cycle of selling at high levels and buying at low levels remains unchanged. At intermediate positions, it is advisable to observe more, act less, and be cautious about chasing orders. Be patient and wait for entry at key points.
XAUUSD trading strategy
buy @ 3215-3220
sl 3195
tp 3235-3240
If you think the analysis helpful, you can give a thumbs-up to show your support. If you have different opinions, you can leave your thoughts in the comments. Thank you for reading!👉👉👉

Gold fluctuates. Will it break through resistance and start to rWe analyzed the fundamentals and technical aspects comprehensively over the weekend, and the overall trend tends to be upward.
The Asian market opened, and the price rose to around $3,250 and fell back; in yesterday's analysis, I thought that the Asian market would rise rapidly after the opening due to the impact of the US sovereign credit rating. As I predicted, the opening in the morning quickly rose to the intraday high of $3,250, and then began to fall. Finally, it fell to $3,210 and strengthened again, and the trend was the same as my analysis.
From the current market, gold continues to fluctuate greatly. It is relatively strong at present, but it is suppressed by the $3,250-3,255 area. Therefore, it is expected that the price will continue to rise after adjustments below $3,250; if the price stabilizes above $3,210, there is still room for the price to rise. Below this, it will start a downtrend that could potentially hit last week’s cycle low of $3,150.
In the short term, we need to pay attention to the support level of $3225. If it breaks through the resistance level of $3250-55, it will open up room for growth. We will further pay attention to the high point of $3270-3290.
Until the price breaks through the upward resistance zone of $3250-3255 with a strong force, it is recommended not to adopt a long strategy.

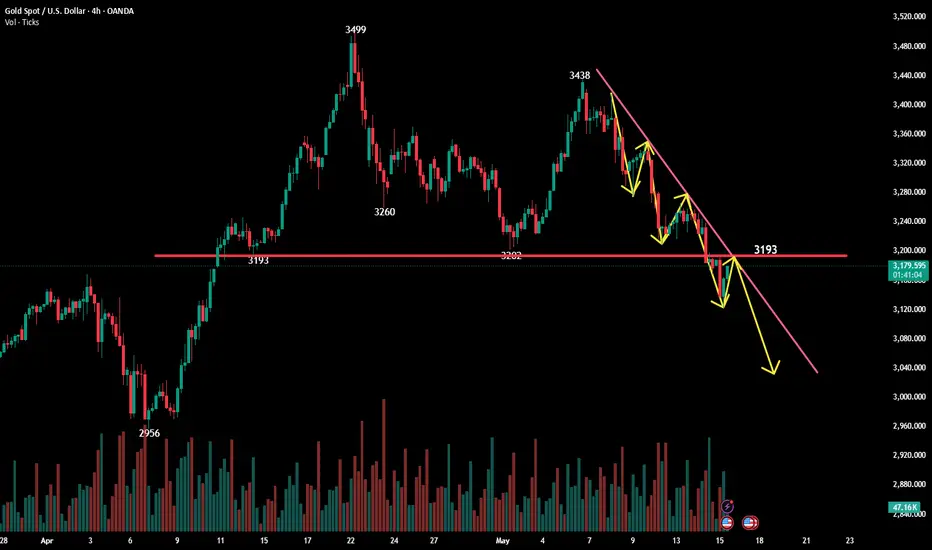
Gold fell sharply and rebounded to continue shorting!Technical analysis of gold: After stabilizing at 3222 yesterday, the rebound was weak and stopped at 3244. After the European session fluctuated, it fell below the 3200 integer mark and a diving market appeared. The lowest intraday price fell to 3168 US dollars. This means that the support of 3200 has failed, and the price of the disk has increased its retracement. The saturated and sinister closing of the daily line means that there is still room for continuation during the day! After gold fell below 3200 this week, the current trend is as shown in the figure. The end of this wave is tentatively set at around 2950. There may be a rebound during the period, but it is only a rebound. After the news fades, it is a rebound in the analysis after the 9th of this month. It emphasizes that the gold price of 3500 is a top to look at the retracement, and also gives a short-selling strategy and a staged support position below. Now that the support level has been broken one after another, we can continue to look at the target according to the trend.
Now let's make a brief analysis of the hourly chart. Gold prices must be repaired after a sharp drop. One is to adjust and repair by shocks, and the other is to rebound and repair. Under this extreme downward trend, gold does not have the conditions to rebound, so I think the rebound here at 3120 is just caused by some short orders choosing to sell at a profit, so the market will continue to fall. Now the upper side mainly focuses on two positions. The first is the previous low point of 3168 during the decline, and the other is the starting point of the early trading wave near 3192. If the rebound does not exceed these two positions, we can continue to see gold testing or even breaking the just low point of 3120. The lower ladder support focuses on 3088. On the whole, today's short-term operation strategy for gold is to short on rebounds and to buy on pullbacks. The upper short-term focus is on the 3170-3192 line of resistance, and the lower short-term focus is on the 3120-3100 line of support. Friends must keep up with the rhythm.
Short position strategy:
Strategy 1: Short 20% of the position in batches near 3168-3172 in the early trading of gold, stop loss 10 points, target near 3140-3120, and look at 3100 line if it breaks;
Long position strategy:
Strategy 2: Buy 20% of the position in batches near 3100-3105 when gold falls back, stop loss 10 points, target near 3130-3150, and look at 3170 line if it breaks;
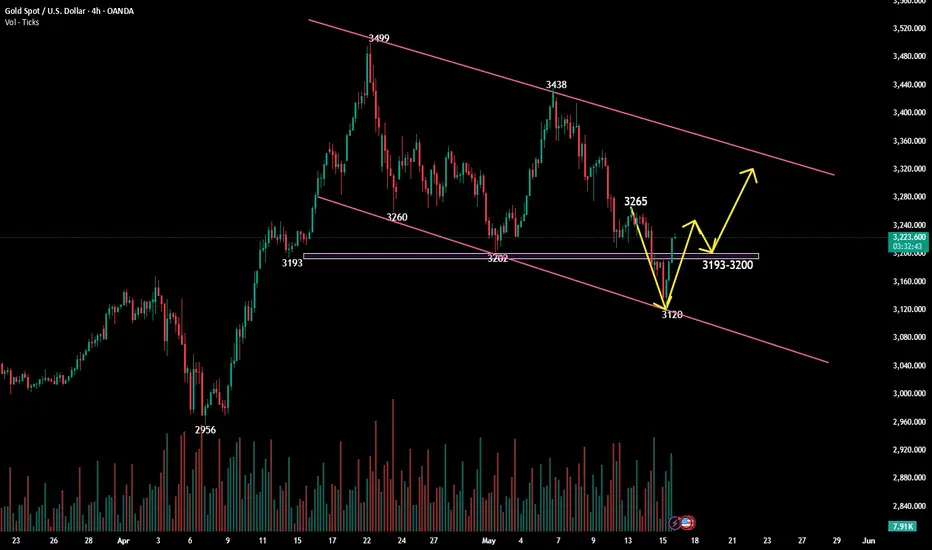
Gold's V-shaped reversal restarts its upward trend!Technical analysis of gold: Gold has a perfect V-shaped reversal today. It opened at 3177 and fell unilaterally in the Asian session. After touching 3120, it rose slowly. As of the time of writing, it has completely recovered its decline and is currently trading around 3220. I have analyzed the European session. After the gold price broke through the extreme drop of 3200, it needs to be repaired, but it has taken another rebound correction. The analysis also gave attention to 3198 to 3202 to continue to be bearish. With the slow rise and break, the bearish view is invalid. Now make a new analysis.
From a technical point of view, gold is now back above 3200, and the daily line is a big positive. It is undoubtedly absolutely strong. The key point is the gains and losses of 3200. If the retracement does not exceed 3200, then gold is extremely strong. On Friday, we will continue to see the daily line closing positive rise, but if the retracement is below 3200, the daily line cycle may close again, and there will be a continuous rebound to 3235 and 3260. Therefore, the key point today is to pay attention to the gains and losses of 3200.
The performance of the 4-hour cycle may now bottom out in the medium term. After the decline and rebound, the 4-hour mid-term Bollinger opening is temporarily strong, but if the US market rebounds continuously and stands firm at 3200, there will be a continuous positive pattern at the bottom, breaking the 5-day and 10-day moving averages, then there is a great possibility that it will go to 3235. Therefore, gold in the late trading should not be inertially bearish because of the decline on Wednesday. Even if it is bearish, it is necessary to observe the gains and losses of 3200. As for trading, first pay attention to 3200 below and try to buy, and see if 3230 breaks and 3250 breaks.
On the whole, today's short-term operation of gold suggests that callbacks should be the main focus, and rebound shorts should be supplemented. The top short-term focus is on the first-line resistance of 3250-365, and the bottom short-term focus is on the first-line support of 3193-3200. All friends must keep up with the rhythm.
Gold intraday trading strategyFrom the 4-hour line analysis, today's lower support continues to focus on around 3170-75, strong support is at the 3150 mark, and upper pressure is around 3253-60. Relying on this range as a whole, the main tone of high-altitude and low-multiple cycles remains unchanged. In the middle position, watch more and do less, be cautious in chasing orders, and wait patiently for key points to enter the market.
Gold operation strategy:
1. If gold falls back to 3170-75 and does not break, hold a light long position; if it falls back to 3150-55, add a long position; stop loss at 3144; target at 3226-3230; continue to hold if it breaks;
2. If gold rebounds to 3240-45 and does not break, hold a light short position; if it rebounds to 3253-60, add a short position; stop loss at 3266; target at 3275-80; continue to hold if it breaks;

Gold Market Analysis for Next WeekLast Friday's chart analysis was highly consistent with the market trend, and satisfactory results were achieved in trading.👉👉👉
Based on the 4-hour trend analysis, for the opening of gold on Monday, we will first focus on the short-term resistance at the 3,224-3,230 level, and the key resistance at the 3,253-3,260 level. Below, we will pay attention to the short-term support at the 3,170-3,175 level. The operational suggestion is to focus on shorting on rebounds.
XAUUSD trading strategy
sell @ 3230 - 3240
sl 3260
tp 3215 - 3220
If you think the analysis helpful, you can give a thumbs-up to show your support. If you have different opinions, you can leave your thoughts in the comments. Thank you for reading!👉👉👉

Gold Market Summary for Last WeekLast Friday's chart analysis was highly consistent with the market trend, and satisfactory results were achieved in trading.👉👉👉
On Friday, the international gold price fell, potentially recording its largest single-week decline in six months. This trend is mainly attributed to the strengthening of the U.S. dollar and the easing of concerns about the China-U.S. trade war, which together weakened gold's appeal as a safe-haven asset. Gold prices plummeted by more than 2% at one point on Friday, with a cumulative decline of nearly 4% this week—largely driven by increased risk appetite brought about by the trade agreement—marking the largest single-week drop since last November.
The mitigation of the trade war has led to a rebound in risk appetite across the market. This shift has prompted futures traders to take profits, particularly in the gold market, triggering a week-long wave of position liquidation. Gold has faced pressure in recent weeks as the market has ruled out stagflation expectations and repriced rate-cut expectations. Currently, the market expects the Federal Reserve to cut interest rates by approximately 58 basis points by the end of the year, compared to 120 basis points at the peak of panic in April. However, in the short term, the repricing of rate-cut expectations may exert pressure on gold.
XAUUSD trading strategy
sell @ 3230 - 3240
sl 3260
tp 3215 - 3220
If you think the analysis helpful, you can give a thumbs-up to show your support. If you have different opinions, you can leave your thoughts in the comments. Thank you for reading!👉👉👉

XAU/USD weekly outlook My analysis revolves around the continuation of the current short-term bearish trend. To capitalise on this move, I’ll be watching for price to mitigate either the 4-hour supply zone or the 3-hour supply zone. If price instead decides to respect a nearby demand zone, I’ll shift focus and wait for a potential reaction from a 1-hour demand zone.
From there, we could see signs of accumulation followed by a bullish reaction, leading price back up into a supply zone before continuing the sell-off in line with the prevailing trend. However, if price breaks below the 1-hour demand, that would further confirm a stronger bearish bias.
Confluences for GOLD sells are as follows:
- Price has broken structure to the downside, confirming the short-term bearish trend.
- Price is approaching both the 4-hour and 3-hour supply zones, which could act as strong sell areas.
- There is a lot of downside liquidity that remains untapped and could be targeted.
- On the higher timeframes, price appears overbought due to the recent corrective move.
P.S. If price fails to respect the nearby supply zones and breaks through them, I’ll then look for a reaction from a more premium supply level. Overall, my long-term bias remains bullish based on the higher timeframes.

XAUUSD[GOLD]; Is it the beginning of the major correction? XAUUSD dropped from 3265$ to 3127$, as predicted in our previous analysis. However, after touching 3127$, the price has retraced slightly and is currently trading at 3178$. In our opinion, the price can go up to $3220 maximum and reject at that level. We need to wait and see how prices behave. Another possible entry point is at 3178$, which is the current trading price. We believe this region is good for selling because the price has struggled to break through it. Please use a proper trading plan while trading gold.
As always, this analysis doesn’t guarantee that price will move as described in the chart. Please use your own knowledge and trading plan while trading gold. Good luck and trade safely.
Want to support us? Do the following ❤️
-LIKE THE IDEA
-COMMENT YOUR VIEW
-SHARE IF YOU AGREE
Much love ❤️
Team Setupsfx_

Gold is likely to trend upward Gold has made a perfect V - shaped reversal today. It opened at 3,177 and declined unilaterally in the Asian session, once dropping to around 3,120, reaching a new low since April 10. Then it gradually climbed all the way, and has now completely recovered the decline, with a rising trend.👉👉👉
On Friday, we continue to anticipate a bullish daily close for gold. However, if the pullback falls below 3,200, the daily cycle may narrow again, leading to a sustained rebound to 3,235 and 3,260. Therefore, the key point is to monitor whether the price holds above or breaks below 3,200.
For short-term trading of gold, the recommended strategy is to focus on going long during pullbacks and supplement with shorting during rebounds.
Short-term key resistance to watch above: 3250-3260 level
Short-term key support to focus on below: 3190-3200 level
XAUUSD trading strategy
buy @ 3210-3215
sl 3195
tp 3230-3240
If you think the analysis helpful, you can give a thumbs-up to show your support. If you have different opinions, you can leave your thoughts in the comments. Thank you for reading!👉👉👉

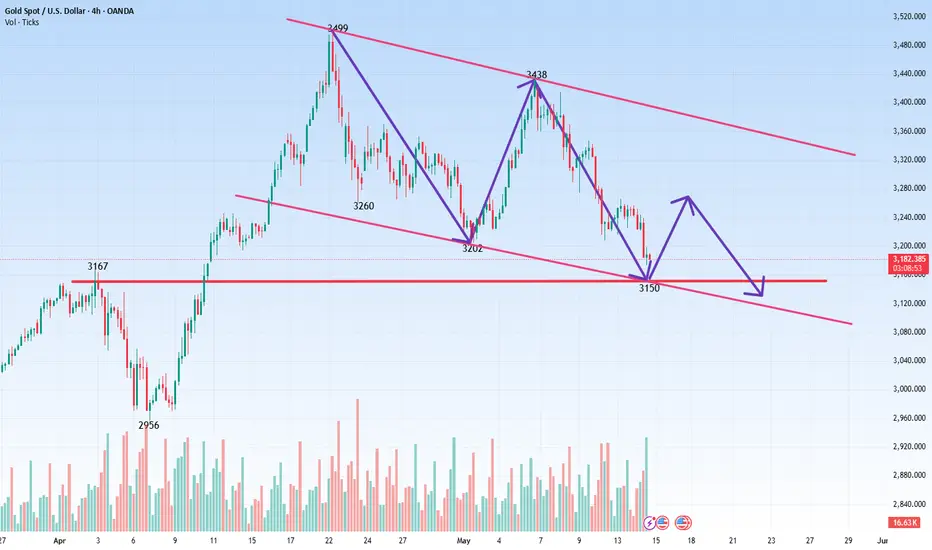
Will gold continue to rise after breaking down?Technical analysis of gold: the daily cycle is constructed based on the M-head pattern. 3202 is the bullish defense position. If it cannot go up at the close, there will be further declines. A major technical breakdown has occurred. Pay attention to the change in thinking. If the adjustment is large, it may even reach 2900/3000. It rises quickly and falls just as quickly, but the long-term logic of gold's rise remains unchanged. It is also an opportunity to deploy more when it goes down, but the position needs to be observed by the market. It is difficult to predict at present. In the short term, rely on 3198 to do short selling. After breaking 3200, pay attention to shorting even if it rebounds. If it rebounds upward, go short at the golden section resistance of 3265.
After gold fell below 3202 in the US market, it rebounded to 3198 at its highest. This rebound was just an oversold rebound, and then continued to fall back. Although it has not refreshed the low point for the time being, the pattern has weakened and it is difficult to rise again. Weak shorts can hardly get past 3198. The short-term support below is 3140/3150. Gold 1 hour still continues to cross downward short positions, and the short-term strength is still there. The rebound still continues to give shorts opportunities. There is no obvious sustained upward momentum in the short term, so such a market is just a rebound. Gold rebounds in the US market and continues to be short.
Overall, today's short-term operation strategy for gold is to short on rebounds and to go long on pullbacks. The short-term focus on the upper side is 3202-3205 resistance, and the short-term focus on the lower side is 3150-3155 support.
Short position strategy:
Strategy 1: Short 20% of the position in batches near 3198-3202 in the early trading of gold, stop loss 10 points, target near 3180-3170, and look at 3150 if it breaks;
Long position strategy:
Strategy 2: Buy 20% of the position in batches near 3150-3155 when gold falls back, stop loss 10 points, target near 3170-3190, and look at 3200 if it breaks;
Gold changes trend? Latest analysis.Information summary:
Due to the easing of trade tensions between the world's two largest economies; suppressing safe-haven demand, and investors waiting for US economic data for more clues on future interest rate trends. On Thursday, Asian time, gold prices fell to their lowest point in more than a month. At one point in the session, it hit the lowest level since April 10 at $3,120. The price has now rebounded to around $3,190.
Technical analysis:
Gold once again showed a trend of falling first and then rising, basically swallowing up all the declines in the Asian market. Is gold about to start a new round of rise? I don't think it is possible to judge that the upward trend is established now. Because from the weekly line, the price rushed up and fell back, and the more obvious signal is that it will fall again.
From the daily rhythm, today fell first and then rose, and the short-term rise was strong, swallowing up all the declines in the Asian session and there are signs of continued rise. But in terms of rhythm, the watershed of the Asian session's decline is the integer mark of 3,200. If it continues to be suppressed below the watershed, the market will still fall.
Operation strategy:
Short around $3205, stop loss at $3215, profit range at $3180-3175.
If the gold price breaks through the $3,200 resistance with strength and stays above this level, we need to change our strategy.
