The market trend is highly consistent with the chart analysisGold opened with a gap up today, returning to the decline starting point near 3,252 last Friday before falling again. The short-term trend has entered a repeated oscillation, but the key level of 3,200 has not been broken.👉👉👉
On Monday, the international gold price rebounded by more than 1%, boosted by a weaker U.S. dollar and increased safe-haven demand. Gold first fell to the 3,206 level before recovering to the 3,250 level, reversing the early session decline. Gold has been under pressure in recent weeks as markets gradually digest stagflation expectations and reprice rate-cut expectations. The market now expects the Federal Reserve to cut rates by about 58 basis points by the end of the year, compared with the peak expectation of 120 basis points during the panic in April.
From the analysis of the 4-hour chart, the lower support continues to focus on the vicinity of 3170-75. The primary support level is the 3150 threshold, and the important resistance to pay attention to is 3270-3280. Overall, within this range, the main tone of participating in a cycle of selling at high levels and buying at low levels remains unchanged. At intermediate positions, it is advisable to observe more, act less, and be cautious about chasing orders. Be patient and wait for entry at key points.
XAUUSD trading strategy
buy @ 3215-3220
sl 3195
tp 3235-3240
If you think the analysis helpful, you can give a thumbs-up to show your support. If you have different opinions, you can leave your thoughts in the comments. Thank you for reading!👉👉👉
Xauusd4h

Gold fluctuates. Will it break through resistance and start to rWe analyzed the fundamentals and technical aspects comprehensively over the weekend, and the overall trend tends to be upward.
The Asian market opened, and the price rose to around $3,250 and fell back; in yesterday's analysis, I thought that the Asian market would rise rapidly after the opening due to the impact of the US sovereign credit rating. As I predicted, the opening in the morning quickly rose to the intraday high of $3,250, and then began to fall. Finally, it fell to $3,210 and strengthened again, and the trend was the same as my analysis.
From the current market, gold continues to fluctuate greatly. It is relatively strong at present, but it is suppressed by the $3,250-3,255 area. Therefore, it is expected that the price will continue to rise after adjustments below $3,250; if the price stabilizes above $3,210, there is still room for the price to rise. Below this, it will start a downtrend that could potentially hit last week’s cycle low of $3,150.
In the short term, we need to pay attention to the support level of $3225. If it breaks through the resistance level of $3250-55, it will open up room for growth. We will further pay attention to the high point of $3270-3290.
Until the price breaks through the upward resistance zone of $3250-3255 with a strong force, it is recommended not to adopt a long strategy.

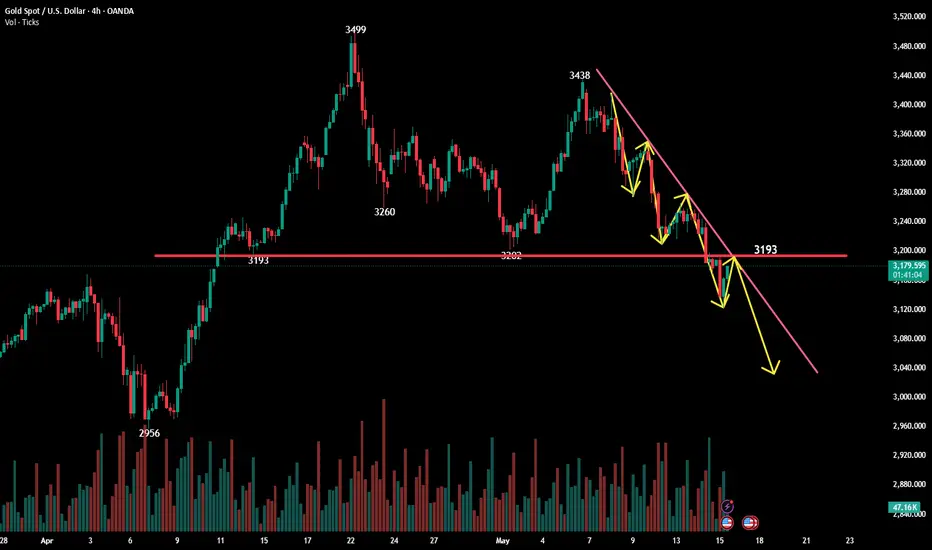
Gold fell sharply and rebounded to continue shorting!Technical analysis of gold: After stabilizing at 3222 yesterday, the rebound was weak and stopped at 3244. After the European session fluctuated, it fell below the 3200 integer mark and a diving market appeared. The lowest intraday price fell to 3168 US dollars. This means that the support of 3200 has failed, and the price of the disk has increased its retracement. The saturated and sinister closing of the daily line means that there is still room for continuation during the day! After gold fell below 3200 this week, the current trend is as shown in the figure. The end of this wave is tentatively set at around 2950. There may be a rebound during the period, but it is only a rebound. After the news fades, it is a rebound in the analysis after the 9th of this month. It emphasizes that the gold price of 3500 is a top to look at the retracement, and also gives a short-selling strategy and a staged support position below. Now that the support level has been broken one after another, we can continue to look at the target according to the trend.
Now let's make a brief analysis of the hourly chart. Gold prices must be repaired after a sharp drop. One is to adjust and repair by shocks, and the other is to rebound and repair. Under this extreme downward trend, gold does not have the conditions to rebound, so I think the rebound here at 3120 is just caused by some short orders choosing to sell at a profit, so the market will continue to fall. Now the upper side mainly focuses on two positions. The first is the previous low point of 3168 during the decline, and the other is the starting point of the early trading wave near 3192. If the rebound does not exceed these two positions, we can continue to see gold testing or even breaking the just low point of 3120. The lower ladder support focuses on 3088. On the whole, today's short-term operation strategy for gold is to short on rebounds and to buy on pullbacks. The upper short-term focus is on the 3170-3192 line of resistance, and the lower short-term focus is on the 3120-3100 line of support. Friends must keep up with the rhythm.
Short position strategy:
Strategy 1: Short 20% of the position in batches near 3168-3172 in the early trading of gold, stop loss 10 points, target near 3140-3120, and look at 3100 line if it breaks;
Long position strategy:
Strategy 2: Buy 20% of the position in batches near 3100-3105 when gold falls back, stop loss 10 points, target near 3130-3150, and look at 3170 line if it breaks;
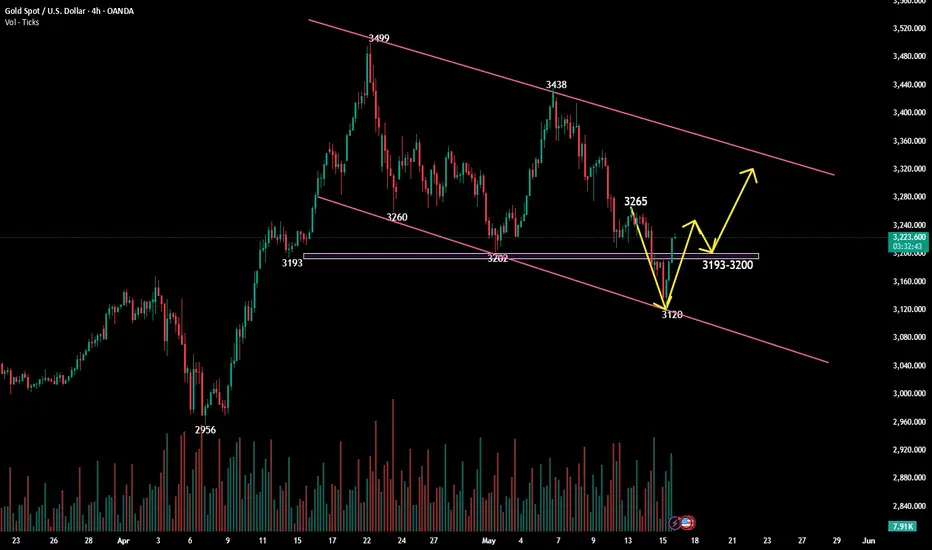
Gold's V-shaped reversal restarts its upward trend!Technical analysis of gold: Gold has a perfect V-shaped reversal today. It opened at 3177 and fell unilaterally in the Asian session. After touching 3120, it rose slowly. As of the time of writing, it has completely recovered its decline and is currently trading around 3220. I have analyzed the European session. After the gold price broke through the extreme drop of 3200, it needs to be repaired, but it has taken another rebound correction. The analysis also gave attention to 3198 to 3202 to continue to be bearish. With the slow rise and break, the bearish view is invalid. Now make a new analysis.
From a technical point of view, gold is now back above 3200, and the daily line is a big positive. It is undoubtedly absolutely strong. The key point is the gains and losses of 3200. If the retracement does not exceed 3200, then gold is extremely strong. On Friday, we will continue to see the daily line closing positive rise, but if the retracement is below 3200, the daily line cycle may close again, and there will be a continuous rebound to 3235 and 3260. Therefore, the key point today is to pay attention to the gains and losses of 3200.
The performance of the 4-hour cycle may now bottom out in the medium term. After the decline and rebound, the 4-hour mid-term Bollinger opening is temporarily strong, but if the US market rebounds continuously and stands firm at 3200, there will be a continuous positive pattern at the bottom, breaking the 5-day and 10-day moving averages, then there is a great possibility that it will go to 3235. Therefore, gold in the late trading should not be inertially bearish because of the decline on Wednesday. Even if it is bearish, it is necessary to observe the gains and losses of 3200. As for trading, first pay attention to 3200 below and try to buy, and see if 3230 breaks and 3250 breaks.
On the whole, today's short-term operation of gold suggests that callbacks should be the main focus, and rebound shorts should be supplemented. The top short-term focus is on the first-line resistance of 3250-365, and the bottom short-term focus is on the first-line support of 3193-3200. All friends must keep up with the rhythm.
Gold intraday trading strategyFrom the 4-hour line analysis, today's lower support continues to focus on around 3170-75, strong support is at the 3150 mark, and upper pressure is around 3253-60. Relying on this range as a whole, the main tone of high-altitude and low-multiple cycles remains unchanged. In the middle position, watch more and do less, be cautious in chasing orders, and wait patiently for key points to enter the market.
Gold operation strategy:
1. If gold falls back to 3170-75 and does not break, hold a light long position; if it falls back to 3150-55, add a long position; stop loss at 3144; target at 3226-3230; continue to hold if it breaks;
2. If gold rebounds to 3240-45 and does not break, hold a light short position; if it rebounds to 3253-60, add a short position; stop loss at 3266; target at 3275-80; continue to hold if it breaks;

Gold Market Analysis for Next WeekLast Friday's chart analysis was highly consistent with the market trend, and satisfactory results were achieved in trading.👉👉👉
Based on the 4-hour trend analysis, for the opening of gold on Monday, we will first focus on the short-term resistance at the 3,224-3,230 level, and the key resistance at the 3,253-3,260 level. Below, we will pay attention to the short-term support at the 3,170-3,175 level. The operational suggestion is to focus on shorting on rebounds.
XAUUSD trading strategy
sell @ 3230 - 3240
sl 3260
tp 3215 - 3220
If you think the analysis helpful, you can give a thumbs-up to show your support. If you have different opinions, you can leave your thoughts in the comments. Thank you for reading!👉👉👉

Gold Market Summary for Last WeekLast Friday's chart analysis was highly consistent with the market trend, and satisfactory results were achieved in trading.👉👉👉
On Friday, the international gold price fell, potentially recording its largest single-week decline in six months. This trend is mainly attributed to the strengthening of the U.S. dollar and the easing of concerns about the China-U.S. trade war, which together weakened gold's appeal as a safe-haven asset. Gold prices plummeted by more than 2% at one point on Friday, with a cumulative decline of nearly 4% this week—largely driven by increased risk appetite brought about by the trade agreement—marking the largest single-week drop since last November.
The mitigation of the trade war has led to a rebound in risk appetite across the market. This shift has prompted futures traders to take profits, particularly in the gold market, triggering a week-long wave of position liquidation. Gold has faced pressure in recent weeks as the market has ruled out stagflation expectations and repriced rate-cut expectations. Currently, the market expects the Federal Reserve to cut interest rates by approximately 58 basis points by the end of the year, compared to 120 basis points at the peak of panic in April. However, in the short term, the repricing of rate-cut expectations may exert pressure on gold.
XAUUSD trading strategy
sell @ 3230 - 3240
sl 3260
tp 3215 - 3220
If you think the analysis helpful, you can give a thumbs-up to show your support. If you have different opinions, you can leave your thoughts in the comments. Thank you for reading!👉👉👉

XAU/USD weekly outlook My analysis revolves around the continuation of the current short-term bearish trend. To capitalise on this move, I’ll be watching for price to mitigate either the 4-hour supply zone or the 3-hour supply zone. If price instead decides to respect a nearby demand zone, I’ll shift focus and wait for a potential reaction from a 1-hour demand zone.
From there, we could see signs of accumulation followed by a bullish reaction, leading price back up into a supply zone before continuing the sell-off in line with the prevailing trend. However, if price breaks below the 1-hour demand, that would further confirm a stronger bearish bias.
Confluences for GOLD sells are as follows:
- Price has broken structure to the downside, confirming the short-term bearish trend.
- Price is approaching both the 4-hour and 3-hour supply zones, which could act as strong sell areas.
- There is a lot of downside liquidity that remains untapped and could be targeted.
- On the higher timeframes, price appears overbought due to the recent corrective move.
P.S. If price fails to respect the nearby supply zones and breaks through them, I’ll then look for a reaction from a more premium supply level. Overall, my long-term bias remains bullish based on the higher timeframes.

XAUUSD[GOLD]; Is it the beginning of the major correction? XAUUSD dropped from 3265$ to 3127$, as predicted in our previous analysis. However, after touching 3127$, the price has retraced slightly and is currently trading at 3178$. In our opinion, the price can go up to $3220 maximum and reject at that level. We need to wait and see how prices behave. Another possible entry point is at 3178$, which is the current trading price. We believe this region is good for selling because the price has struggled to break through it. Please use a proper trading plan while trading gold.
As always, this analysis doesn’t guarantee that price will move as described in the chart. Please use your own knowledge and trading plan while trading gold. Good luck and trade safely.
Want to support us? Do the following ❤️
-LIKE THE IDEA
-COMMENT YOUR VIEW
-SHARE IF YOU AGREE
Much love ❤️
Team Setupsfx_

Gold is likely to trend upward Gold has made a perfect V - shaped reversal today. It opened at 3,177 and declined unilaterally in the Asian session, once dropping to around 3,120, reaching a new low since April 10. Then it gradually climbed all the way, and has now completely recovered the decline, with a rising trend.👉👉👉
On Friday, we continue to anticipate a bullish daily close for gold. However, if the pullback falls below 3,200, the daily cycle may narrow again, leading to a sustained rebound to 3,235 and 3,260. Therefore, the key point is to monitor whether the price holds above or breaks below 3,200.
For short-term trading of gold, the recommended strategy is to focus on going long during pullbacks and supplement with shorting during rebounds.
Short-term key resistance to watch above: 3250-3260 level
Short-term key support to focus on below: 3190-3200 level
XAUUSD trading strategy
buy @ 3210-3215
sl 3195
tp 3230-3240
If you think the analysis helpful, you can give a thumbs-up to show your support. If you have different opinions, you can leave your thoughts in the comments. Thank you for reading!👉👉👉

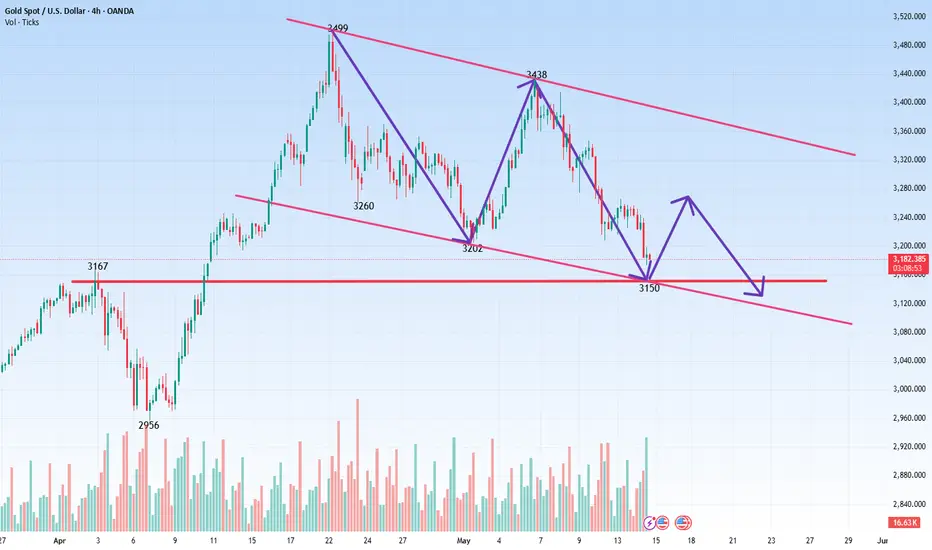
Will gold continue to rise after breaking down?Technical analysis of gold: the daily cycle is constructed based on the M-head pattern. 3202 is the bullish defense position. If it cannot go up at the close, there will be further declines. A major technical breakdown has occurred. Pay attention to the change in thinking. If the adjustment is large, it may even reach 2900/3000. It rises quickly and falls just as quickly, but the long-term logic of gold's rise remains unchanged. It is also an opportunity to deploy more when it goes down, but the position needs to be observed by the market. It is difficult to predict at present. In the short term, rely on 3198 to do short selling. After breaking 3200, pay attention to shorting even if it rebounds. If it rebounds upward, go short at the golden section resistance of 3265.
After gold fell below 3202 in the US market, it rebounded to 3198 at its highest. This rebound was just an oversold rebound, and then continued to fall back. Although it has not refreshed the low point for the time being, the pattern has weakened and it is difficult to rise again. Weak shorts can hardly get past 3198. The short-term support below is 3140/3150. Gold 1 hour still continues to cross downward short positions, and the short-term strength is still there. The rebound still continues to give shorts opportunities. There is no obvious sustained upward momentum in the short term, so such a market is just a rebound. Gold rebounds in the US market and continues to be short.
Overall, today's short-term operation strategy for gold is to short on rebounds and to go long on pullbacks. The short-term focus on the upper side is 3202-3205 resistance, and the short-term focus on the lower side is 3150-3155 support.
Short position strategy:
Strategy 1: Short 20% of the position in batches near 3198-3202 in the early trading of gold, stop loss 10 points, target near 3180-3170, and look at 3150 if it breaks;
Long position strategy:
Strategy 2: Buy 20% of the position in batches near 3150-3155 when gold falls back, stop loss 10 points, target near 3170-3190, and look at 3200 if it breaks;
Gold changes trend? Latest analysis.Information summary:
Due to the easing of trade tensions between the world's two largest economies; suppressing safe-haven demand, and investors waiting for US economic data for more clues on future interest rate trends. On Thursday, Asian time, gold prices fell to their lowest point in more than a month. At one point in the session, it hit the lowest level since April 10 at $3,120. The price has now rebounded to around $3,190.
Technical analysis:
Gold once again showed a trend of falling first and then rising, basically swallowing up all the declines in the Asian market. Is gold about to start a new round of rise? I don't think it is possible to judge that the upward trend is established now. Because from the weekly line, the price rushed up and fell back, and the more obvious signal is that it will fall again.
From the daily rhythm, today fell first and then rose, and the short-term rise was strong, swallowing up all the declines in the Asian session and there are signs of continued rise. But in terms of rhythm, the watershed of the Asian session's decline is the integer mark of 3,200. If it continues to be suppressed below the watershed, the market will still fall.
Operation strategy:
Short around $3205, stop loss at $3215, profit range at $3180-3175.
If the gold price breaks through the $3,200 resistance with strength and stays above this level, we need to change our strategy.

Will gold rise today?Hello everyone. Let's discuss the trend of gold this week. From the current 1-hour chart range, gold is at risk of falling again to 3200.
The current 1-hour chart range has been broken. After breaking the range support today, it has rebounded again, so the previous support has become a suppression position.
Therefore, if gold cannot stand above 3250, then we must be careful of the risk of gold testing 3200.
You can focus on 3240-3250. As long as it cannot stand above 3250, you can sell gold at 3240-3250. The target below is still around the bottom of the range 3200.

Gold price plunges suddenly. Technical analysis.Information summary:
During the Asian session, gold prices suddenly plunged, and the price of gold has now hit a low of $3,148, down more than $44 from the intraday high of $3,192.78 hit earlier.
Gold prices continued to fall after breaking the $3,200 support I predicted earlier, and gold prices fell to a one-month low, continuing the recent decline.
The sharp reduction in tariffs between the United States and China has brought relief to global markets and led to a rebound, which has caused gold to correct and break through multiple technical levels.
Technical analysis:
In the short term, according to the 4-hour chart, the outlook for gold is bearish. Gold prices are trading below all of their moving averages, and the 20-period SMA has fallen below the 200-period SMA, which is located at $3,232, which will constitute an important resistance if the gold price trend recovers. Finally, technical indicators lack directional strength, but remain at negative levels, reflecting a lack of buying interest.
I think traders need to pay attention to the latest important support and upward resistance levels:
Support: $3140.
Resistance: $3100; $3215; $3232.

Gold has broken below the key level of 3200Before the U.S. trading session on Wednesday, spot gold saw a sharp short-term decline, plummeting by $50 in just 3 hours and breaking below the $3,200 mark.👉👉👉
Recently, the global financial markets have shown significant fluctuations due to tariff - related news. Over the weekend, China and the United States reached an agreement in Geneva to suspend the imposition of tariffs for 90 days. This news has effectively alleviated market concerns about a global economic recession, and global stock markets have risen in response, with risk - appetite sentiment heating up.
For short-term gold trading ideas, it's recommended to focus on shorting on rebounds and supplement with longing on pullbacks. Key short-term resistance to watch above is the 3200-3205 level, while key short-term support to focus on below is the 3150-3155 level.
XAUUSD trading strategy
sell @ 3200-3195
sl 3220
tp 3170-3175
If you think the analysis helpful, you can give a thumbs-up to show your support. If you have different opinions, you can leave your thoughts in the comments. Thank you for reading!👉👉👉

Is it possible for the price of gold to rise further?Are you still confused now? Whether the market is soaring, plummeting, unilateral or fluctuating, are you always unable to grasp it? It is the so-called falling as soon as you buy, cutting as soon as it falls, rising as soon as you cut, chasing as soon as it rises, and then being trapped again, and cutting again. This is like a dead trap, the funds are constantly shrinking, and so on. If you are in such a cycle, please stop and think carefully, summarize your experience and lessons, and get ready to start again.
Gold trend analysis:
The latest situation of gold at the 4-hour level. The 4-hour chart is currently in a downward trend. In the chart, yesterday's high of 3265 is resistance. The MA5-MA10 moving average crosses and runs. The short-term trend is bearish. Yesterday, it was under pressure above 3260, but the market fell back. Recently, it has maintained a trend of continuously moving down lows. In the chart, 3208-3207 is support. Further support focuses on the 3200 mark. If it breaks 3200, it is expected to continue to fall back to 3160-3150. The operation is mainly rebound short.
US trading operation ideas:
Gold 3220 short, stop loss 3230, target 3200-3190;

Gold fell. How is the market?Gold fell sharply at the opening today, and the lowest point hit $3175.
From the weekly line, this has already touched the weekly MA10 moving average position.
Quaid believes that traders should not blindly carry out short strategies. If there is a price rebound, the rise will be very fast, and the market may not give you a chance to stop loss.
From the 4H chart, we can see that gold has started a downward trend from last Friday's high of $3345. $3345-3307 is wave a. $3307-3360 is wave B. Currently, it is wave C from around $3360.
However, this wave C has not ended yet. If we look at it by standard, it will be considered the end of this trend only when it goes down to around $3120.
However, around $3175 is a support position. So now before it falls below $3175, gold may maintain a shock adjustment of $3200-3175.
I think you need to pay attention to the short-term resistance level of $3200-3250. If it cannot be as strong as breaking, then we can still carry out a short strategy below 3200.

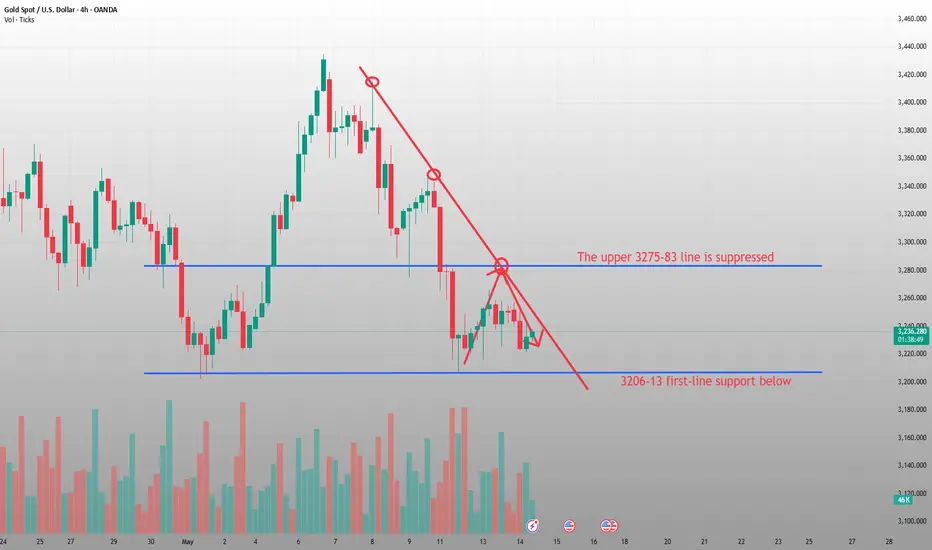
Gold price fluctuates and rebounds before shortingJudging from the 4-hour analysis, the top is currently focusing on the short-term suppression of the 3258-65 line, and the important first-line suppression of 3275-81. During the day, the counter-draw relies on this position to continue to go short first and then fall back. Before breaking through and standing at this position, the main counter-drawing rhythm will remain unchanged. The short-term support below is around 3206-13, focusing on the 3200 first-line mark support. Be cautious when doing longs. Focus on the support of the 3200 line. Be cautious when going long.
Gold operation strategy:
Short at the rebound of 3258-65, short at the rebound of 3275-83, stop loss at 3293, target 3206-3215, continue to hold if it breaks;
Can I buy the bottom when gold fluctuates at a low level?Foreword of capital exchange: If a person does not have a goal and belief, even if there are many people to guide you, it is futile. Ask yourself what is the purpose of this investment? Have you achieved it? How far is it still? What conditions are needed to achieve your goal as soon as possible. I am very happy that you can come to understand. I am willing to help those who believe in me. Trust is like throwing a child into the sky. She can still smile because she believes that you can catch it. Trust is also the origin of all cooperation. If you cooperate with a skeptical attitude, then such cooperation will not last long. Profit is definitely not a win or loss in one order, and making money is definitely not a one-time game. When you are willing to let go of the past thinking. Even if you close your eyes, I will never let you get lost!
At present, the gold price is in a state of technical and fundamental game. On the one hand, the Fed's expectations of rate cuts this year and the weakness of the US dollar provide support; on the other hand, trade optimism and rising market risk appetite suppress safe-haven demand.Looking ahead, gold prices are likely to resume their corrective decline as the U.S. dollar stabilizes after the previous sell-off.Technical analysis of gold: In recent trading days, gold has experienced a rapid decline in the early trading, and then stabilized and rebounded. The European trading session fluctuated, and the US trading session rebounded after a high rise. Today's early trading was under pressure, and the high point of yesterday's US trading in the 3258-60 area has already experienced a rapid decline. It depends on whether it can stabilize and rebound next. Overall, continue to pay attention to the medium-term support of the 3202-07 mark. Before breaking down, once the bulls stabilize, they will fill the gap of Monday's gap in the 3320-25 area; if it breaks down, it will open up the downward space, further 3160-3120, and then gradually fall to 3060 and the 3000 mark, the starting point of this round of bullish rise. The M top or W bottom we emphasized is still waiting for the market to choose!
Today's short-term gold operation ideas suggest that callbacks should be the main focus, and rebound shorts should be supplemented. The top short-term focus is on the first-line resistance of 3257-3265, and the bottom short-term focus is on the first-line support of 3215-3220. All friends must keep up with the rhythm.
Short position strategy:
Strategy 1: Short 20% of the gold position in batches near 3255-3260, stop loss 10 points, target near 3240-3230, break to see 3220 line;
Long position strategy:
Strategy 2: Buy 20% of the gold position in batches near 3220-3222, stop loss 10 points, target near 3240-3250, break to see 3270 line;
Gold fluctuates. When will a new trend start?China and the United States reached a 90-day ceasefire agreement, and the price of gold returned to 3,200 from 3,400 US dollars. All traders are staring at the support level of 3,200 US dollars, and are very worried about whether it can withstand pressure; it will fall to a larger level, resulting in no trading opportunities for gold positions.
I think your concerns are normal, and market fluctuations are also normal. There is no market that only rises and never falls; even in the bull market, there will be periodic adjustments.
Next, the focus is on the maturity of US Treasury bonds in June. The impact of trade conflicts will soon be forgotten by the market; US CPI inflation continued to decline in April, from 2.4% in the early stage to 2.3%, getting closer and closer to the Fed's ultimate goal of 2%, which means that the Fed will soon have to restart the interest rate cut plan.
Once the US Treasury bonds mature and default or trigger panic, or if Fed Chairman Powell reveals his intention to cut interest rates, gold will rise rapidly and may reach a high point within 1-2 days.
Okay, everyone; you need to understand the basic situation, but the most important thing is the operation strategy during the Asian trading session.
I think you can first test the long strategy around $3225, with a stop loss below 3215 and a profit in the rebound range of $3340-3360.
Man, excessive worrying will not help; if you can't accept short-term volatility trading, you can wait and see and stay calm.

Analysis and Suggestions on the Trend of GoldToday, the U.S. April CPI data was released, indicating that inflationary pressures have eased, sending a complex signal to the market. This mild data that fell short of expectations, combined with the uncertainty of recent tariff policies, may trigger market expectations of the Federal Reserve's early interest rate cuts, thus weakening the U.S. dollar and providing certain support for gold. As a result, the price of gold rose briefly in the short term. However, gold then turned down again. This may be because the overall risk appetite in the market has rebounded, with major global stock markets surging. More funds have flowed into risk assets such as the stock market, weakening the safe-haven appeal of gold and overshadowing the short-term positive impact of the CPI data on gold.
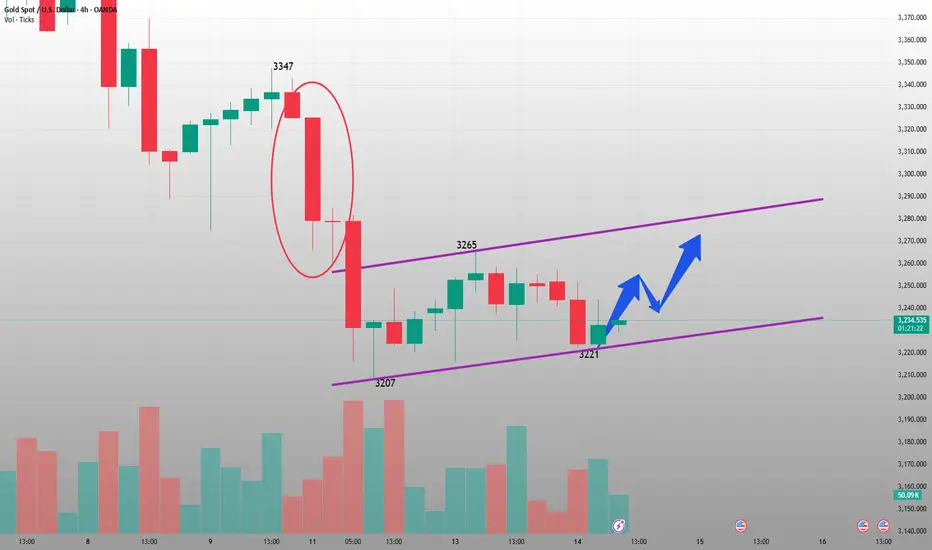
The overall trend is similar to my analysis yesterday, fluctuating repeatedly within the range. Judging from the current trend of gold, pay attention to the short-term suppression at the level of 3260-3265 above. The strong resistance is around the mark of 3275-3285. Below, pay attention to the support at the level of 3215-3220, and focus on the support at the level of 3200, which is also the dividing line between the strength of bulls and bears. The operation suggestion is mainly to go long on the pullback, and patiently wait to enter the market at the key position. 👉👉👉
XAUUSD trading strategy
buy @ 3220-3225
sl 3200
tp 3240-3250
If you think the analysis is helpful to you, you can give a thumbs-up to show your support. If you have different opinions, you can leave your thoughts in the comments. Thank you!👉👉👉

Can we continue to go long on gold now?Gold has an obvious double bottom structure at the bottom, and gold has an obvious bottom signal near 3210
Trading ideas: Buy gold near 3238, stop loss 3220, target 3270

Will gold continue to rise?Hello everyone. Let's discuss the trend of gold this week. If you have a different opinion, you can express your thoughts in the comment area. At present, the first important position of gold is around 3295, and the second is 3320-3330.
3295 is the 382 position of gold in this round. If the rebound does not pass here, then if it falls again next, it is very likely to break the support of 3200.
The second is 3320-3330, which is the gap on Monday. If it goes up, the possibility of filling the gap is also very high.
So, next pay attention to the two positions I mentioned above, 3295 and 3320-30. If you want to sell gold, it is best to wait for these three price positions.
