Gold bull market? 3300 is not far awayEvent summary:
Goldman Sachs releases another "gold bomb"! The Wall Street giant raised its gold price target for the third time, predicting that gold will soar to $3700 per ounce in 2025, and even warned that it may exceed $4500 in extreme cases! In just a few months, the expected price of gold has soared like a rocket, and the market is completely boiling-this is not an investment, but this time, it may be an unprecedented super market!
Level analysis:
The early fluctuations of gold were not large, and it has always shown a trend of oscillating sideways. However, the current surge has directly given everyone a big surprise. How should we view the upward trend?
The surge in gold directly broke through the oscillation area. The daily line continued to attack after a break. The trend is still in a strong form, so it is better to follow and do more in the short term!
Trading signal:
3240-50 long, stop loss 3230, take profit 3285.
I am Quaid. After seeing my analysis strategy, I hope you can achieve an investment breakthrough with my help and turn every tide in the gold market into our wealth wave.
Xauusd4h

Gold has an adjustment trend, shorting is the main trendGold has begun to fluctuate in a wide range. The gold high has been suppressed frequently in the past two days and will fall back. Don't chase too much after the gold high. Even if you are long, you must patiently wait for the opportunity to fall back and adjust.
The gold 1-hour moving average has begun to show signs of turning, so the volume of gold bulls has begun to weaken, and gold bulls may have adjustments. In the short term, the confidence in further rising gold is not very strong. The structure of the double top of gold 1 hour.
Trading ideas: short gold near 3221, stop loss 3231, target 3200

Gold is finishing at a high level to resist the fall! The bullis
📌 Driving events
U.S. President Trump said on Monday that he was exploring the possibility of temporarily exempting tariffs on imported cars and parts to give auto companies more time to establish production bases in the United States.
New York Fed: The unemployment rate is expected to rise to the highest level since April 2020 in March. In March, households were more pessimistic about employment and future income. The expected inflation rate for the next five years is 2.9%, down from 3% in February.
Geopolitical situation:
It was learned on the 14th local time that Israeli officials said that Israel and the Palestinian Islamic Resistance Movement (Hamas) still have great differences on the ceasefire in Gaza. The official said that compared with the previous negotiating position, Hamas seems willing to release more Israeli detainees, but if Hamas insists on requiring all parties to guarantee that Israel must stop waging war in the Gaza Strip after the ceasefire, it will still be difficult to promote an agreement. The official expects Hamas to respond to the new ceasefire proposal in the next few days.
📊Comment Analysis
The hourly level shows that the short-term gold price has fallen from a high level and gradually fell into a narrow range above the hourly 60-day moving average support level. The current hourly level indicators are narrowing, maintaining a short-term shock guide reference. The 5-day moving average and the 10-day moving average at the four-hour level are arranged in a downward cross, maintaining the four-hour level peak signal. The short-term decline gradually brings about the four-hour RSI mean reversion, forming a four-hour level adjustment trend. The gold price has risen and fallen to maintain a shock downward trend, which has not changed the medium- and long-term upward trend. Be cautious to maintain a bullish shock trading strategy during the day.
💰Strategy package
Long order:
Aggressive participation at 3185-3195, profit target above 3210
Steady participation at 3175-3185, profit target above 3195
Short order:
Aggressive participation at 3250, profit target below 3230
⭐️Note: Labaron hopes that traders can properly manage their capital
- Choose the number of lots that matches your capital
- Profit equals 4-7% of the capital account
- Stop loss equals 1-3% of the capital account

Strategic Analysis of Gold for the Next WeekOn Friday, the gold price continued its slow upward trend. Subsequently, it experienced a slight pullback, but still maintained an overall upward trend. This indicates that the current sentiment of the bulls is quite high, while the bears are unable to achieve decisive suppression in the short term. Due to the relatively obvious recent trend of fluctuating upward movement, there is still a great deal of uncertainty as to whether the price will continue to rapidly reach a peak. Therefore, for trend trading, one may need to patiently wait for the market to make its own choice.
Judging from the current situation, the gold market still has a strong bullish momentum. Whether it is the market's risk aversion sentiment, the impetus given by economic data to the market expectations of the Federal Reserve's interest rate cuts, or the bullish trend at the technical level, all of these factors provide support for the rise in the price of gold.
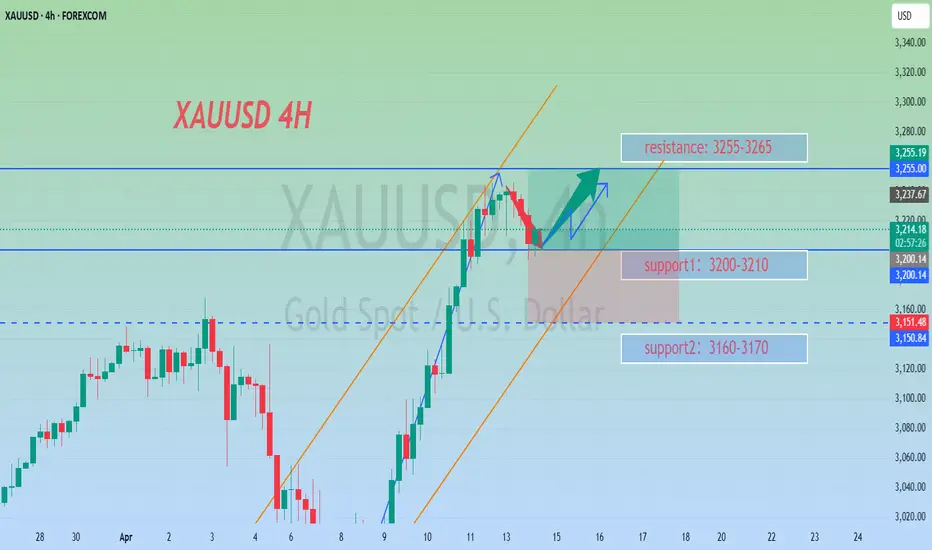
In terms of short-term trading ideas for gold, it is still recommended to mainly go long on pullbacks and go short on rebounds as a supplement. For next Monday, focus on the two support levels of 3200 and 3170. If the gold price remains above 3220, it is expected to continue to challenge higher prices. The upper resistance is roughly in the range of 3245 - 3255. If this resistance level can be effectively broken through, the gold price is expected to further reach the range of 3280 - 3300.
XAUUSD trading strategy
buy @ 3205-3215
sl 3195
tp 3230-3240
If you approve of my analysis, you can give it a thumbs-up as support. If you have different opinions, you can leave your thoughts in the comments.Thank you!

Strategic Analysis of GoldAlthough Trump has announced the exclusion of smartphones and computers from the list of reciprocal tariffs, which has alleviated some market concerns, due to the uncertainty of the overall tariff policy, the gold price still remains above $3,200 after falling from the intraday all - time high of $3,245 on Monday.
Judging from the current trend of gold, we should still pay attention to the resistance level in the range of 3240 - 3245. In the short term, focus on the support level in the range of 3185 - 3190. Currently, the trend has not reversed. It is likely that the bulls are pulling back to accumulate strength and move in a volatile pattern. In terms of trading operations, it is advisable to mainly go long during pullbacks.
XAUUSD trading strategy
buy @ 3195-3205
sl 3180
tp 3218-3223
If you approve of my analysis, you can give it a thumbs-up as support. If you have different opinions, you can leave your thoughts in the comments.Thank you!
Can we continue to go long on gold?The 1-hour moving average of gold is still in a bullish arrangement with a golden cross, and there is still no sign of a turnaround, so the gold bulls are still strong, and now gold is just falling back. The short-term support of gold is 3193, and the gold US market continues to be bullish.
Trading ideas:Gold long around 3208 sl:3193 tp:3225

Choose the right time to enter the market and wait for a reboundFrom the current trend of gold, we still focus on the short-term suppression of 3245-3250 today, and the short-term support of 3200-3206 below, with a focus on the support of 3188-90. Don't chase long at the current high position. The daily level reversal and negative closing may occur at any time.
Gold operation strategy:
If gold falls back to 3200-06 and does not break, you can buy more. If it falls back to 3188-90, you can buy more. Stop loss is 3178. The target is 3248-3250. If it breaks, continue to hold.

XAUUSD buy zone in 1h break of structureLast 3 days of past week XAUUSD had a strong uptrend with bullish momentum. From 1h perspective we have seen price had a bounce, and there is no significant break of structure on the lower timeframe, which means, as with the new market open, any break of structure is an opportunity to go long. Expecting to test the previous swing low is a zone where we can look for for potential entry to ride the trend.
Will wait for price action confirmation on market opening.

XAUUSD will it break through 3200?At present, the price of gold is just one step away from its all-time high. Will it break through to a new high?
3,168 is a strong resistance point. Once this level is broken through, gold may have a chance to surpass the 3,200 mark.
Leave your opinions in the comments, and let's discuss them together.

XAUUSD: Investors are more interested in Gold than ever! Gold reversed successfully after touching our entry point, moving to over 1400 pips. We previously advised closing the idea, but now we see a strong bullish market likely to create another record high. The ongoing tariff war between China and the US will likely create more fear in the global market.
Like, comment, and support us.
Team Setupsfx_

XAUUSD hit a new record high!calm downDue to the influence of various factors, the price of gold has reached a new high and has already set a new historical record. Will it make an attempt to break through the 3200 mark?
Perhaps we should step out of the madness of the gold price and observe the market calmly. I think it will fluctuate within a certain range in the short term, and we can make a profit by choosing to go long or short at the appropriate price points.
XAUUSD trading strategy
sell @ 3165-3170
sl 3180
tp 3155-3160
If you approve of my analysis, you can give it a thumbs-up as support. If you have different opinions, you can leave your thoughts in the comments.Thank you!

Gold is strong, wait for a pullback to go longThe 1-hour moving average of gold has formed a bullish arrangement with a golden cross upward, and gold is now supported near 3100. If gold can stand firm at 3100 after the data, then we can continue to go long on dips.
Trading ideas: Buy gold near 3100, stop loss 2990, target 3130

4/9 Gold Trading Strategies
Gold opened with a mild bullish tone yesterday but faced resistance near 3018 , pulling back briefly before attempting a second push toward 3023 . However, the rally failed to sustain, and price returned near the opening level. Compared to recent sessions, yesterday marked a clear contraction in volatility, suggesting either a bottoming formation or a setup for a directional breakout.
From both candlestick structure and indicator alignment, the market appears primed for a potential bullish push today. If momentum builds as expected, a test of the 3037–3043 resistance zone is highly probable.
On the downside, 2976 remains the key initial support , followed by 2952 , which was the previous local low.
On the fundamental side, no major data releases are scheduled today. However, updates related to tariff policies will likely be the main market driver, and could trigger intraday volatility.
🎯 【Trade Setup for Today】
🔻Sell Zone: 3047–3066
🔺Buy Zone: 2968–2942
🔄Flexible/Scalping Zone: 2978–3023

4/8 Gold Trading StrategyYesterday, gold dipped to the 2950 support zone, still under bearish pressure. However, the market did not enter into an extreme one-sided sell-off. Instead, an intraday rebound suggested that short-term buying interest is beginning to emerge.
Following last week's and yesterday’s sharp correction, the 1-hour technical structure has started to show early signs of a potential bottom. While a retest of the 2960–2950 area in the near term cannot be ruled out, the broader price action now supports the technical conditions for a medium- to short-term rebound.
Currently, gold is stabilizing around the 2980-2960 level. Even if additional bearish pressure emerges, the maximum downside support is expected in the 2919–2888 range. This suggests a likely transition into a low-level consolidation and base-building phase, rather than a continued steep decline.
From a technical perspective, the 3100 zone is a key corrective target for this pullback. The market may gradually move higher to complete a structure recovery, offering a limited-risk, clearly defined opportunity for the bulls.
📌 Key intraday resistance levels:
3018 → 3037 → 3058 → 3079
📌 Trading Strategy for Today:
🟢 Buy Zone: 2976 – 2948
🔴 Sell Zone: 3048 – 3062
🔁 Scalp/Range Zone: 3032 – 2998

Gold opens lower and moves lower, the rebound continues to be beThe gold 1-hour moving average crosses downwards and the short positions are arranged, and it continues to open downwards. So gold is now the home of the shorts. Gold rebounds or continues to be short. Gold is now in a short trend under the gap. Gold rebounds around 3050 and continues to be short.
Trading ideas: short gold near 3050, stop loss 3060, target 3030

4/7 Gold Trading StrategiesGold opened with a massive gap down today due to growing market panic, plunging below the $3000 psychological level. Although it briefly rebounded to $3030+, selling pressure intensified again, dragging prices back below $3000 and continuing to test lower support levels.
This sharp sell-off wiped out almost two months of previous gains. While the panic is real, it’s important not to be ruled by fear. Lower prices offer entry opportunities for long-term bullish capital. In such moments, we need courage as much as caution.
Rather than following fear blindly, we suggest looking for buy opportunities at lower support zones, with a combination of scalping tactics for short-term trades.
📌 Trading Strategy:
🟢 Buy Zone: $2980 – $2950
🔴 Sell Zone: $3040 – $3060
🔁 Scalping Zone: $3021 – $2996

Gold Rebound Looms: Don’t Miss the $50 OpportunityDuring his ongoing speech, Powell mentioned that tariffs may push inflation higher in the coming quarters. While inflation is currently close to the 2% target, it still remains above it. The market has already begun to anticipate a Fed rate cut, which is a potential bullish signal for gold.
From a technical perspective, the recent drop has partially corrected the previous bearish divergence. However, the divergence on the 1D chart still requires more time to be fully resolved.
At the current level, gold appears oversold. I do not recommend chasing short positions here. A short-term rebound is very likely, with a potential upside target between 3078-3096. If you manage the trade well, there’s an opportunity to capture at least $50 in profit.
If you’re currently holding long positions that are under pressure, stay strong. Don’t give up before the dawn — yesterday was a great example of why persistence matters.

How will gold perform after the super rollercoaster market?Gold's 1-hour moving average still shows signs of turning downwards. Although gold bulls have made a strong counterattack, it is also because of the risk-aversion news that stimulated a retaliatory rebound. However, gold continued to fall after rising, and gold began to return to volatility. In the short term, gold is supported near 3100. If gold falls below the support near 3100 again, then gold shorts will still have an advantage in this war. Overall, the impact of today’s non-agricultural data is expected to be dim. What is more important is the stimulation of the news. However, it may be noted that if gold holds the 3100 mark for a long time, then gold is expected to fluctuate upward above 3100.
Trading idea: short gold near 3115, stop loss 3125, target 3100
The above is purely a sharing of personal views and does not constitute trading advice. Investments are risky and you are responsible for your profits and losses.

XAUUSD Analysis: Why I’m Not Buying Gold at the Highs!Gold’s Rally: A Strategic Plan for the Next Buy Setup!
✨ Gold (XAUUSD) has experienced a strong rally recently, fueled by the stock market sell-off. However, I’m waiting for a better entry point rather than buying at the current highs, as price is trading at a premium. 📉 My focus is on a potential retracement on the daily and 4-hour timeframes, targeting a pullback into the swing low-to-high range. Specifically, I’m watching for price to return to the equilibrium zone around the 50% Fibonacci retracement level. 🔄 If price pulls back and we see a bullish break of market structure in this area, it could present a solid buying opportunity. Until then, patience is key! 🛠️
⚠️ This is not financial advice. Always trade responsibly and conduct your own analysis.

4/2 Gold Trading StrategiesAfter yesterday's upward movement, gold experienced a deeper pullback, testing the 3100 area before rebounding to around 3120. However, based on technical indicators, the bullish outlook remains uncertain.
The key resistance to watch is around 3125—if the price fails to break through, we shouldn't expect higher levels today. In that case, the main trading direction will be short positions, with a possible drop to 3086 before tomorrow’s data release.
However, if 3125 resistance is broken and sustained, bulls may attempt another rally towards 3138-3150. On the bearish side, support in the 3103-3096 region is crucial.
Trading Recommendations:
📌 Main Trades:
Buy in the 3098-3086 range
Sell in the 3138-3148 range
📌 Short-Term Scalping:
Sell in the 3124-3131 range
Buy in the 3109-3103 range

#XAUUSD: Smaller Time Frame With More Accurate Entry Areas! We currently have several active ideas in the Gold analysis section. However, we would like to share a comprehensive chart analysis that clearly demonstrates a market trend and potential entry points. The analysis identifies two entry types: “safe” and “risky.” A “safe” entry is only valid if the “risky” entry is invalidated. You may choose to take either entry if it aligns with your trading bias and chart analysis.
If you find this analysis valuable, please consider liking and commenting on it, as this feedback will help us post more detailed analyses in the future.
As always, we express our sincere gratitude for your unwavering support.
Team Setupsfx_

GOLD: What to do if you Hold a Short position?Gold is rebounding. Pay attention to the resistance above 3020. At present, we can see obvious selling pressure on the 2H chart. MACD has formed a divergence. 2H is a larger period. Its form is short, which means that tomorrow or the day after tomorrow, the market will fall sharply.
In addition, the divergence of MACD is sometimes repaired by shock market. This situation is not uncommon, so when trading, we need to focus on the support.
Judging from the current candlestick chart arrangement, there is support near 3100, followed by the 3096-3088 range. If a larger divergence pattern is to be formed, the price may reach the 3036-3048 range. At that time, there is no need to hesitate too much, just sell it.

The short-term short positions in gold are now yielding profits!Currently, the market continues to maintain a range - bound oscillation pattern. In the short term, there are no conditions for a significant unilateral upward or downward movement. In terms of short - term trading, the price is currently trading at $3032. From the perspective of intraday trading strategies, this price level can be regarded as an entry point for short positions. Today, special attention should be paid to the $3020 level, which serves as the daily demarcation line between bulls and bears. If the price drops from a high level as expected, effectively breaks below the $3020 level and closes below this price, the short - side is expected to witness a sharp acceleration in the bottom - seeking trend.
Since the week began, considering global economic trends and gold market volatility, we've steadily shorted gold. All signals, from our in - depth analyses, have proven accurate. I'll keep giving accurate signals, factoring in market changes.
XAUUSD
sell@3030-3035
tp:3025-3015
I will share trading signals every day. All the signals have been accurate for a whole month in a row. If you also need them, please click on the link below the article to obtain them.
