Gold 4 hour :gold will break high or down ? AC indicator on daily chart is green , if gold break high , will go to SMA200 1hour (green line) if gold can break RED trend line will flyup to 1940(selll possible onder fibo 61% but very very low size and SL=10.00 point )
let see daily chart exatly
AC indicator secret: : see AC reaction , normaly it is buy , but if low break=sell so break high,low is important on AC !!!!!!!!!!!!!?
GOLDEN BUY = if gold break low , we must buy after it touch 1830 area (pinbar comes on higher timeframe chart or in 15-60min chart last trend break to up) this buy is very high value buy , we must hold it 10-15 day to high (dont close it soon) gold will see 2000 even 2100 again
ALERT FOR ALWAYS = WHEN GOLD(all index like dow,dax,nassaq too) GOING UP , DONT OPEN REVERSE SELL OK? INSTEAD LOOKING FOR BUY IN DEEP ,THEY LOVE GOING UPER
wish you win , 100% use very very very low size and put SL in 4hour chart last high/low , each second breaking news can explode gold (in trade SL is important than TP)
big levrage , size + remove SL = 100% margincall
low levrage ,low size + eat SL = stable profit in long term
www.tradingview.com
Xauusd_analyse

Gold 4 hour : 1950 is gold frist target if news not come (low not break) technical say fibo 61%=1950 and (if red trend line break) 2nd target is fibo 161% 2070
for now put buystop on high possible (low size) ,,, buylimit near 1900 with SL =1871 or 10.00 point
if you have old sell , close all near 1900 or pick hedge buy (hedge buy size=1.5*total sell)
if you have buy , be patient until fibo 61% , dont close sooner
personaly i am looking for pick buy now ( AC daily is green , trendline break , pinbar comes on daily chart)
ALERT = AS PREDICT BEFOR GOLD CAN FLYUP TO 2070 OR 2100 , DONT PICK REVERSE SELL j ( gold can go up witout pullback , dont allow you close your sell) instead looking for buy in deep
www.tradingview.com

Gold : 3 golden place for next low 90% next low is above green arrow !!! exact price we must looking for buy is 1878 then 1859 then most powerful place near 1825 =fibo 161% there ,gold love fibo 161% (draw arrow on your platform too)
when price touch near these price , wait clear pinbar comes on 1hour or 4hour or daily chart ok? , then pick buy with SL in day low (pinbar low)
if you cant find pinbar on higher time frames???? ,,, draw last , upside trend line on 15 or 60 min chart, ok? , when price break to up , pick buy with SL= day low
wish you win , stand on very low size and after buy open , dont close it soon with little profit like new traders , hold it 15-20 day to high (2100 is gold upper target) very pro trader can wait 3 month even more
www.tradingview.com

Gold 4 hour : news push gold up + pinbar 2 bad news in U.S push Dow,nasdaq down , so gold cant reach 1933 ,,,it break gray trend line = up trend start ,,, now i am looking for buy in deep (15 min chart)
gold main 1st target is fibo 61%(green up move fibo) 2nd target is touch 2000 again , 3nd target is fibo 161% 2030
Technical say on gold : its target is fibo 161% 2030 (Gold love fibo 61% and 161% as target)
advice =gold start 2nd up wave , dont pick sell until fibo 61% understand?, use very low size , buy in deep with SL under last support,low (in coming hours gold can zigzag , so dont alow red candel force you close buy , wait avrage 3 day on gold )
wish you win

Gold 4hour : Are you ready for buy 1932 ?as say before gold love fibo 61% and 161% toooo much , for this i was in wait for fibo 61% 1932 then we must hold buy 7-8 day gold back to high (buy in deep,close on high)
wait PINBAR comes on 1hour or 4hour or dayli chart
or
in 15min chart last trendline (new trendline you must draw) break to up
good luck , dont forget monitor AC indicator in daily and 1hour on gold

Gold = we are waiting 1932 for buy exclent up move on DAX ,DOW push gold down
AC indicator on daily chart is red
so gold can little more go downer if big news not come !!!( news not in my hand , for this we must put SL)
like always after price touch near1932 and pinbar apear on higher timeframe chart ( or on 15 min chart , new, last trend line break to up) pick buy with SL in low ,,, dont close it sooner than 1960 area ( i want hold it more until 2000, can take 15 day)
if you have old buys ,dont fear , close it or hedge it (size sell hedge = 0.5 * total buy) then wait gold go downand (never close hedge sell in low ) wait it back to up (+ up trend come) frist close sell then buys in high
wish you win , be patient on gold

GOLD : today markets are closed some banks , servers are open today ,but europe ,asia , US are closed : easter monday
as predict yesterday gold break high and fly up to touch 2000
above green arrow we can pick buy but very very low size for hold to 2000 (dont close soon, on gold you must be patient avrage 3 day)
LIKE ALWAYS 90% LOOKING FOR BUY , DONT PICK SELL (in 2000 we can sell but very very low size with SL=10.00 minimum 3 day wait) if 2000 break gold can go to 2022
if you have old sells , you must close or hedge above 1980 (hedge size=1.5 * total sell)
www.tradingview.com
good luck

Gold 1 hour 3 angel : it willl break to 2000$ or 1950 ?gold all scenario = main trend on daily chart is + up , but AC indicator on daily chart going to red , this mean if high not break , gold must go down, can create downtrend (after trendline break we can pick very very low size sell ) (above green arrow we must buy, buylimit with SL under support or 10.00)
in other side , if gold break high, upper trend , we must buy (sl under last clear low) and wait 3-4 day until 2000 (selllimit under 2000 with sl=10.00)
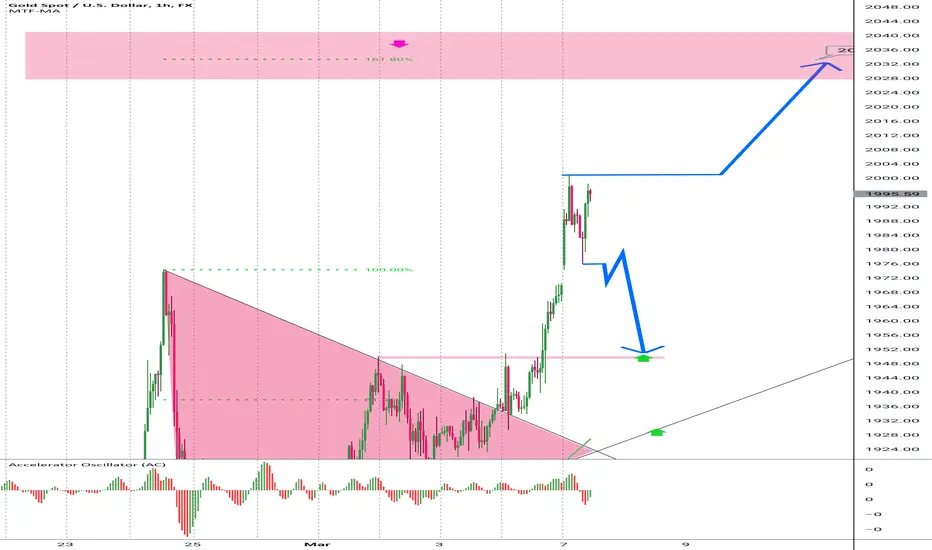
note= personaly i think gold after little up move on monday , will go down to 1950 first, then will go up to 2000
let wait and see breakout , be carefull from sell , sell on gold is very very dangrous , 70% of pro rader looking for buy , never sell
secret : on mornings (europe open time) gold watch DAX (symbol= GER40), when dax go up, gold going down !!!!!!

GOLD in next 9 Month :main trend will up to 2100 2 scenario can comes on gold
40% if gold break low 1927 , it can crash down to touch 1850 then will go up and big up trend can comes (weekly chart fibo 161% show 2400 as gold upper target 🎯)
60% from now , go up but with zigzag, mini crash (we can buy in deep, wait 3-4 day , close on high)
good luck 🎲, on gold , monitor accelator occilator AC indicator on daily and 1hour chart 6-8 month

GOLD 4 hour : gold upper target is 1962 (fibo 161)we are waiting gold break red trendline (buy signal) thenn. we must looking for buy in 25min chart deep
Dont forget in down gold can go to 1850 area so looking for buy ,but put SL under low
Wish you win , dont hurry up for close posation , wait too much on + posations , think yearly !!!

Gold update 2 : buystop on yesterday high possible we inter sell near 1935 (put sl on yesterday high 1938) , now gold touch fibo 61% and red trend line
2 way possible, break high and go to 2000 (40% possible) or go down to 1850 big trendline(60% possible)
for now = we must have low size sell , put SL on high and buystop on high (40-50 pip above yesterday high 1938) SL=1929
if buystop open , don't close it sooner than 3 day and 2000 area (gold can go to 2100 too)
wish you win , reduce your levrage to 1-10 , instead big size , increase wait time on + positions,,, levrage=loss

Gold 4 hour : 3angel near break ,we must sellstop in low yesterday night china new Corona luckdown (speak in Ukrain) ,crash oil and gold
now gold has powerfull sell , we must put sellstop (low size with SL in in 1950 area)
technical say if low and 3angel break ,gold will start downtrend ,even crash to 1850 area (1850 area is buylimit place for hold 20-30 day to high
if you have open buy (why you dont put SL in day low??? 1000 time ask you :eat SL is normal , sl is 90% of this game, if you remove,touch SL you must go to demo(levrage 1-10) and eat 1000 time SL ,)put hedge sellstop in low 1915 wait gold go down and back to 1915 ,then close sell , later on high,close buy (never never close hedge sell in low)
if you have sell,put SL above SMA200 1hour 1950 , wait 10 day until 1850 area (imove SL on 4hour chart last high,clear high)
good luck ,,,dont forget buy in 1850 area and hold it to high

gold next target 🎯 is 1960 AC indicator on daily chart is green ,,, if big news not come , technical say gold can start up trend , in way to fibo 61% (zigzag possible)
if you have sell , put SL or hedge buystop on today up , gold can fly up
advice = don't pick reverse sell on gold , instead looking for buy (SL in support) in deep (60 min chart 📊)for hold 3-7 day to new high

Gold daily say : all eye on fibo 61% 2000$on daily chart powerful pinbar still is active ,,, Accelator occilator AC turn green(mean up trend can start, if if if low not break) , so we must looking for buy with SL in low
if low (Penner) break we must wait for buy in 1850 area and hold it 20-30 day to high
if you have buy , put SL in low or hedge sellstop + buylimit in 1850
if you have open sell 100% put SL in 1940 (last clear high in 1hour chart 📊) each second gold can fly up and don't allow you close sell (sell on gold is very dangerous)
advice = on gold 90% looking for buy for hold 3-4 day to high
good luck

gold: daily chart powerful buy PIN 📌 bar comes as predict yesterday , gold go down touch fibo 61% , now it is in way to 2100$
see below , daily chart on gold futures GC1! , buyer on it inter buy on fibo 61% move gold up , but in gold spot it can't touch fibo 61% , go up sooner , led by gold futures!!!! for this analyse, trendlines on gold futures is important , gold spot chart comes from Gold futures!!! in fact futures traders move market not CFD or spot traders!!!!!!
SECRET= big banks(liquid provider) like Citibank deal, connect spot, cfd traders orders toghader base on futures market tickchart )
in coming days , we can enter buy (looking buy in deep)when new Penner comes in 60-240-daily chart or in 15min chart trendline (draw only clear important trendlines not all) breakup
if you have open sell, close it in coming low
ALERT= don't pick reverse sell on gold when it going up , gold is very trendy, can go up without pullback, don't allow you close sell,,, never reverse on gold !!!!!!?
wish you win

ALERT: technical say gold can go to 2400$ on weekly chart if you draw fibo 161%(gold love it) on V shape , you can find 2350 and 2450 as gold target
ADVICE in 2022 : 99% looking for buy in deep , dont pick sell signals , if you want pick sell 100% use very very low size and SL (on sel side never remove SL)
IF BIG NEWS NOT COME (we can't predict news ,for this we must put SL in last low) we must see 2100$ soon , then after pull back ,gold can start big trend to 2400$( gold is very very + trendy , it can go up wild without pullback true? so dont allow you close your sell, remive SL on sell=margin call)
wish you win
secret of win =
1- dont close your in profit buys soon , give them minimum 3 day !!!!?
2- DONT USE LEVRAGE ABOVE 1-10 (instead big size , use low size ,increase your TP) high levrage = loss all soon or late

for see GOLD daily analyse see this symbol FX:XAUUSDAC accelator occilator going to red,mean down trend can come !!! , if news not comes and today low break= gold little can go down to 1955 or 1900 (next lowest low place, we must buy and hold 10-15 day )
then gold upper target is 2100 (sellimit place but very very low size)
STRONGLY ADVICE ON GOLD DONT PICK SELL , 99% LOOKING FOR BUY IN DEEP WITH LOW SIZE AND SL UNDER LOW OR SUPPORT ,UNDERSTAND?
for my daily analyse , please before start trade , check gold spot FX:XAUUSD or my profile
good luck ,,,, big banks are buying net +260.000 lot gold futures now , see line,dot indicator
GOLD SECRET= GOLD LOVE TOUCH FIBO 61% AND FIBO 161% !!!!!
note= if you check my 6 days ago monthly chart analyse , gold in 2022 can go to 2300$ so on your sell never remove SL

Gold : 1950 area is very powerful buy place for hold to 2100 above green arrow we must pick low size buy with SL=10.00 point and hold them 10 day to 2100
ALERT = gold target is 2100 after little down move ,it can start + up trend (on gold + up trend mini crash is normal ,so red candel dont fear you close buy)
in 1950 we have red fibo 61% , we must pick buy and hold it 10 day to 2100 (dont close it soon , after 10.00 point move SL to open price,let it go up with zigzag)
wish you win

GOLD 4 hour all eye looking for pinbar on gold , it love pinbar pinbar on gold in 1hour , 4hour , daily chart is very important ,gold 90% reaction to higher time frame pinbar
as i say in morning ,gold will see wild zigzag , mini crash and fly up ,true?
advice for coming hour = wait , wait , wait until red,green arrows ok? (if you cant) 90% looking for buy in deep , if today high break ,door will open to fibo 161%=2033 (we can put buystop on high but very very low size and SL in last low) personaly i prefer wait to pick buy above green arrows for hold 7-8 day
if you have sell (against my advice) you must put hedge buystop on today high ,always in gold break high is buy signal for gold traders ,understand?
if you have buy , put tp under fibo 161% near 2033 (if you eat SL dont pick new buy , wait green arrow area = 1950 and 1920
sell butterfly pattern on weekly chart
prnt.sc
ALERT=gold can go to 2400$ see my 2 days ago , monthly chart analyse
www.tradingview.com

if you have buy . move SL to open price .dont inter new buy ok?as predict 2 days ago ,gold touch 2000$
i close all my buys near 2000$(if high break , gold can go to fibo 161% near 2033) , now we must wait and dont buy !!!!!!
under fibo 161% we can pick very very low size sell with sl=10.00 trailstop=10.00 tp=30.00
above green arrow we can buy again (with sl under support)
now gold can zigzag , range , go to fibo 161% or even mini crash to green arrow
if you have open sell , you must put sl or hedge buystop above today high (50-60 pip above today high)
advice= wait wait wait until arrows
who have net buy now on GOLD ? comment below gold 2 possible way : again brrak yesterday high and go upper or , personaly I see AC indicator daily is full green going to red so gold can little go down in next hours (trend is very powerfulll up , dont pick sell until 1900 and 1920)
like last 7-8 day still looking for buy in deep (15 min chart new low) with SL=8.00 hold until 1900 or 1920 (7-8 day wait)
if bad news comes , above green arrow we must put buylimit , under red arrow , put sellimit (but low size with sl under suport or day low ok?)
GOLD NOW MOVE Separately FROM DOLLAR INDEX AND US 10 YEAR YIELD and this can take 2-3 month (i predict this 1 year ago)
pinbar strategy only for gold = when you see CLEAR buy pinbar in 1 hour or 4 hour or daily chart ,,,,100% pick buy (very low size) with SL in pinbar low ok?
last request = please please reduce your levrage and size , dont use levrage above 1-10 even on little money like 500$ balance ,,,, instead big size ,use very low lot but looking for big TP and more wait!!!!!!!! , high levrage is toxic = high size = big loss with little price move
good luck , if you have old sell , or hedge order , need help , exit way , write problem in nelow vomment or pm me in telgram

Gold target is 1900$ as predict 10 days ago in low daily chart yesterday candel is very big , powerfull and price break big 1855 trendline so this wild + up trend will continiue
in gray arrow i pick buy and in green arrow i will buy again
gold frist target is fibo 161%= 1900 (put sellimit posdible ,but very very low size and SL=10.00,,,, trailstop=10.00
gold 2nd target is 2018 high ( weekly chart) 1920
gold (if russia attack ukrain ) can fly up to fibo 261% =1970 too
we must still looking for buy(never sell sooner than 1900) , put buystop above new high and buylimit near green arrow 1847
if you have open sell , you must put SL or hedge buystop on friday high (40 pip upper) , break yesterday high mean new buy signal and + up trend 2nd wave start , i 1000 time alert you about sell on gold and index , they can go up wild 300-400$ , see march 2020
wis you win , never use leverage above 1-10 and per 1000$ balance max 0.01lot (10$),,, above these you will margincall,loss soon or late

how gold will go up gold if big news not come , we must see this way to fibo 61% 1825 (sellimit place with sl=8.00 or support))but our main old target is 1860 , we will see 1860 soon or late (secret= when gold go up , it has mani zigzag and mini crash, dont fear from red candels)
if you cant pick buy in above green arrow (now daily PINBAR come ), you must looking for buy (when AC 1 hour turn down, full red, you can put buystop on 15 chart last new trendline on high)
Boys and Girls , good luck for coming week , dont forget use very very low size with sl (per 1000$ max 0. , dont forget use very very low size with sl (per 1000$ max 0.01)
i pick my buy , put sl in low , shot down mu pc , gooing to sleep 8 hour !!! lolol, stand on chart not good
