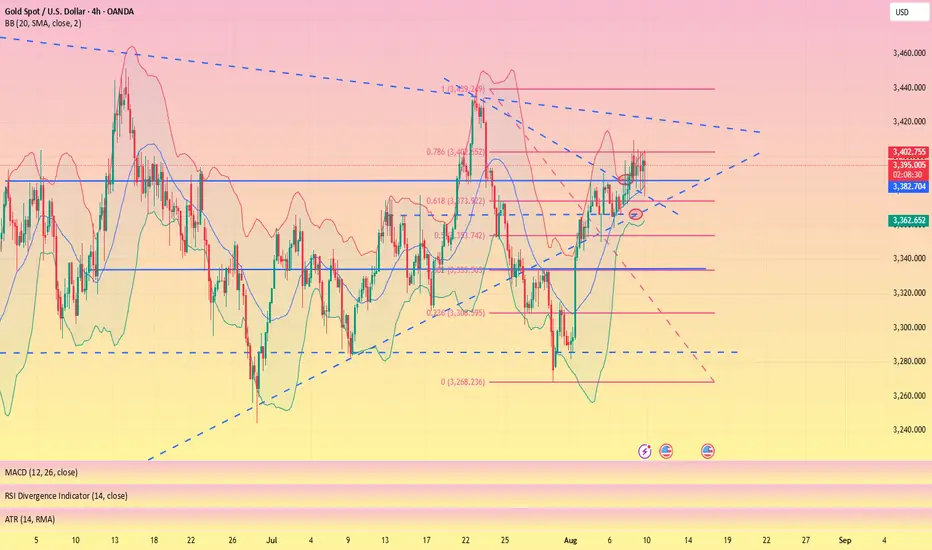
Ready to BUY Gold to target 3445✏️ OANDA:XAUUSD confirms a continued uptrend as it breaks out of the triangle. The price is heading towards 3430 today and even higher at 3445. Today is Friday, the weekly candle close, and according to the range of the candle, it is possible to reach those highs. The BUY strategy can be activated at the moment and hold the position until the US session with the continuous US session buying pressure in recent days.
📉 Key Levels
Support: 3385-3365-3333
Resistance: 3419-3431-3445
Buy trigger: Confirmation of the h4 candle buying pressure above 3385
Buy trigger: Rejection of the support zone at 3365
Target 3445
Leave your comments on the idea. I am happy to read your views.
Xauusdanalysis

Gold Price Action Update: Neutral to Bearish BiasThis week, apart from my short trade on Tuesday, I’ve maintained a bullish outlook on Gold, suggesting buying the dips with the expectation of a breakout above the 3380-85 zone. I was targeting an acceleration above 3400 and eventually 3440. I followed through with this idea and bought in anticipation of the move.
However, something about Gold's recent price action raised a red flag for me, prompting me to close my buy positions. Let’s break it down:
Starting yesterday morning, the price action became erratic. Initially, we saw the expected breakout, but it was quickly reversed, and the price action turned choppy. Then came a series of quick pumps, followed by quick reversals—each time the market would move up, only to fall back again. As of writing, we’re sitting at 3388.
This kind of erratic movement usually suggests that we’re nearing a top, and even if Gold spikes again above 3400, I don’t want to hold positions in a market that’s so volatile and unsustainable in either direction.
So, I’m out for now, adopting a neutral to bearish stance.
If the price drops below 3370, it would indicate a likely top formation, and at that point, I’ll be looking to sell rallies; till then, wait and see.
Disclosure: I am part of TradeNation's Influencer program and receive a monthly fee for using their TradingView charts in my analyses and educational articles.

Candle patterns that help you always WinHello everyone, if you are struggling to identify price zones, entry points, or simply want to predict the trend of any currency pair, then this article is for you.
I will divide it into several parts, and today we will cover some common patterns — so grab a pen and paper to take notes!
First pattern: ASCENDING TRIANGLE
The ascending triangle is considered a bullish continuation pattern. In order to locate it, we will observe more than one ascending peak. To draw this pattern, a horizontal line (the resistance line) must be placed above the resistance points, and an ascending line (the uptrend line) must be drawn along the support points.
Second pattern: FLAG
The flag pattern is used to identify the possible continuation of a previous trend from a point where the price has drifted against that same trend. If the trend resumes, the price rise could be rapid, making the timing of a trade advantageous when noting the flag pattern.
If you think you have seen a flag to trade, the most important thing is the fast and steep price trend. If the price slowly rises and falls below the flag, you'd better not trade at that time.
3. CUP AND HANDLE
The cup and handle pattern on the price chart resembles a cup with a handle, where the cup is u-shaped and the handle has a slight downward slope.
The cup forms after an upward move and looks like a bowl or rounded bottom. As the cup is completed, a narrow price range develops on the right side and the handle is formed. A subsequent breakout of the trading range that forms the handle indicates a continuation of the previous upward move.
4. DOUBLE BOTTOM
The trajectory of the asset price within the formation of the model resembles the letter "W". The last two price lows, located at approximately the same level, is an area of strong support, in which twice performs an upward price reversal.
When the market price breaks the resistance level of the pattern, the formation of the pattern is complete. The sell signal appears and a change in the trend direction is expected.
5. INVERSE HEAD AND SHOULDERS
This pattern is identified when the price action of a security meets the following characteristics: the price falls to a low and then rises; the price falls below the previous low and then rises again; finally, the price falls again, but not as much as the second low. Once the final low is reached, the price heads upward toward resistance near the top of the previous apexes.
6. ROUNDING BOTTOM
The rounding bottom pattern looks similar to the cup and handle pattern, but does not experience the temporary downward trend of the "handle" portion.
The initial downward slope of a rounding bottom indicates oversupply, which forces the stock price down.
The move to an uptrend occurs when buyers enter the market at a low price, which increases demand for the stock. Once the rounded bottom is completed, the stock breaks out and will continue in its new uptrend.
7. TRIPLE BOTTOM
The Triple Bottom pattern is similar in appearance to the Inverse Head and Shoulders pattern, in that it is represented by a series of three highs and lows.
The difference is that the three highs of the Triple Bottom will have approximately the same height, whereas in the Inverse Head and Shoulders pattern, the second low is lower than the first and third lows.
The appearance of the Triple Bottom indicates the existence of a downtrend, which is currently in the process of reversing into an uptrend.
And here are some classic bullish patterns. In the next parts, I will cover bearish patterns, how to read candlesticks, and technical indicators.
If you find this interesting and useful, please leave me a like and a comment to keep me motivated!
Now, are you ready to trade? Remember and practice these patterns — you’ll soon become a true professional.
Good luck!
Kevinn_Nguyen.
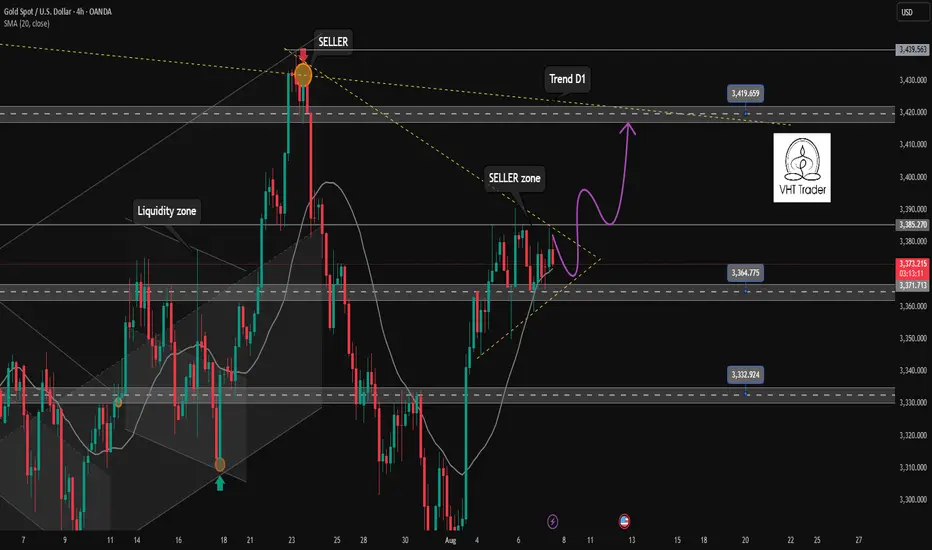
Ascending triangle pattern is formed✏️Gold is consolidating in a triangle pattern. This is likely an ascending triangle pattern. We can wait for strong enough buying pressure to break the upper boundary to trigger the BUY strategy. Or wait for a reaction at the lower boundary of the triangle pattern to trigger the BUY. 3365 is broken to confirm a corrective downtrend towards 3333.
📉 Key Levels
Buy trigger: Breakout of the upper triangle pattern 3385
Buy trigger: Reaction of the buying candle at 3365
Target 3419
SELL Trigger Break and Retest bellow 3365
Leave your comments on the idea. I am happy to read your views.
GOLD Breakout Done , Long Setup Valid To Get 150 Pips !Here is My 15 Mins Gold Chart , and here is my opinion , we finally above 3384.00 and we have a 30 Mins Candle closure above it And Perfect Breakout , so we have a good confirmation now to can buy it and we can targeting 100 to 150 pips .
Reasons To Enter :
1- New Support Created .
2- Bullish Price Action .
3- Bigger T.F Giving Good Bullish P.A .
4- Clean Breakout .

Gold Futures Hit $3,534 – Spot Lags by $100. What Could Mean?I don’t usually track Gold Futures every single day, but today a fellow trader drew my attention to something — and it’s impossible to ignore.
Gold Futures just printed an all-time high at $3,534, while spot gold (XAUUSD) topped at $3,409 — a $120 spread at the peak, now narrowed to about $100 at the time of writing.
A spread like this is highly unusual and, more importantly, unsustainable. By the time the August 27th contract expires, futures and spot must converge to the same price.
That means one of two things is about to happen — and either way, the move would be explosive.
1. Bullish Scenario – Futures Are Right
If the futures market is telling the truth, spot gold will have to accelerate higher to close the $100 gap.
If XAUUSD stabilize above $3,400, the odds of a push toward its own ATH become significant — and the move could be fast and aggressive.
________________________________________
2. Bearish Scenario – Futures Are Overreaching
If futures are overshooting, they will have to correct — hard.
From a technical standpoint, if spot will drop below $3,370, the door to a continuation is open toward at least $3,330 support.
A 400-pip drop in spot could translate into at least a 1,000-pip drop in futures, bringing the spread back toward its more typical 20–30 range.
________________________________________
Why This Matters?
Regardless of direction, $100+ spreads do not last. In the next three weeks, one side will be proven wrong, and the prices will snap back together.
Looking back at this year’s price action, spot and futures have always mirrored each other with an average spread of 20-30usd, depending on conditions and expectation, and for example:
• The spot ATH at $3,500 matches $3,509 in futures.
• The May low was identical in both markets.
This current divergence is the outlier — and it’s screaming that a major move is coming.
________________________________________
Bottom line: If futures are right, spot gold is about to rip higher. If spot is right, futures are about to collapse.

XAUUSD Weekly Plan a Liquidity Clean-Up?XAUUSD Weekly Plan – The Final Bullish Push Before a Liquidity Clean-Up?
Are you ready for a high-volatility week?
Last week, Gold continued to move steadily inside its bullish channel, reaching the FVG High Zone and pushing towards the strong resistance cluster at 3426–3428 (OBS Sell Zone).
The bullish structure on H2–H4 remains intact, but as price enters the distribution zone, candles are tightening, and volume is fading — a clear sign that buying pressure is weakening.
Macro Backdrop – What’s on the Calendar?
This week is packed with high-impact USD data:
CPI (Aug 12) – Major inflation reading, key driver for USD & Gold.
PPI (Aug 14) – Producer inflation, often a leading indicator for CPI trends.
Unemployment Claims (Aug 14) – Short-term labour market indicator.
💡 Expectations:
CPI & PPI are forecast to improve compared to last month.
If confirmed, this could trigger a sharp Gold pullback as USD strengthens.
However, a weak CPI/PPI could give Gold one last bullish spike before reversal.
Technical Outlook
The H2 bullish channel is well-defined.
The top of the channel aligns with the FVG High Zone — a key area for big player sell limits and profit-taking.
Likely scenario:
Price extends to test 3426–3428 Sell Zone.
Bearish reaction → Channel breakdown.
Retest VPOC 3395–3400 → Drop towards liquidity pools below.
Key Trading Levels
SELL Zone: 3426 – 3428
SL: 3434
TP: 3420 → 3415 → 3410 → 3405 → 3400 → 3395 → 3390 → 3380 → 3370 → 3360
BUY Zone: 3330 – 3328
SL: 3322
TP: 3335 → 3340 → 3350 → 3360 → 3370 → 3380
Risk Management Notes
⚠️ This is a high-risk news week — false breaks are highly possible before & after CPI/PPI.
Avoid holding heavy positions during key data releases.
If price breaks above 3434 with strong volume, bearish scenarios are invalid → wait for a new structure.
📌 Summary:
Primary bias → Sell from 3426–3428, target downside liquidity pools.
Secondary play → Buy from 3330–3328 if liquidity sweep occurs.
Stay disciplined. Manage risk. Don’t get caught in the volatility trap.
— MMFlow Trading

XAUUSD – Is Gold Ready for Its Final Rally? 📈 Elliott Wave Analysis on XAUUSD – Is Gold Ready for Its Final Rally? 💥
On the daily chart of XAUUSD, we’re observing the completion of a wave 4 triangle correction (ABCDE), which seems to be setting the stage for the beginning of wave 5 in the larger bullish cycle.
✅ Wave 3 showed a strong impulsive structure, and now the wave 4 triangle suggests consolidation before an explosive breakout toward the $3900 zone.
📍Key Resistance: 3900
🌀 We're anticipating a breakout above the upper channel line, potentially launching a sharp move as wave 5 unfolds.
💬 Share your thoughts in the comments! Do you think gold is ready to break its all-time high?
🔥 Save this idea & follow for future updates!
------------------------------------------------------------------------------------------------------
🚀 Who am I?
I'm Mahdi, a prop firm trader with 7+ years of experience in technical analysis, mainly focusing on Smart Money Concepts and Elliott Wave theory.
I specialize in delivering high-quality trading signals, market insights, and educational content tailored for serious traders and investors.
📊 My Tools: SMC, Elliott Wave, Fibonacci, Liquidity Grabs, Order Blocks
💼 Prop Challenge Passed: Yes | Funded Account: In Progress
🔗 Follow for consistent updates and trading insights.

GOLD: Buy Dips Into DemandBuy the dip!
(H4) ✅ Bullish
Formed HL at 3355, strong displacement up from that zone
Current leg is targeting buy-side liquidity above 3432 and 3445
Unmitigated H4 demand: 3380–3388
(H1)
Series of HHs & HLs
Key Zone: 3380–3388
Next liquidity target / short-term resistance: 3432-3445
Wait for pullback into key zone or momentum break above 3405
(M15)
Micro bullish structure intact
Current short-term demand:3390–3395
Deeper demand: 3380–3388
Execution Triggers
Pullback Buy: Sweep 3380, M15 BOS above 3392, enter on retest
Breakout Buy: Break & close above 3405 with displacement, retest 3395–3400
❌ Invalidation
Break below 3355 = bullish structure compromised
Break below 3322 = trend shift to bearish

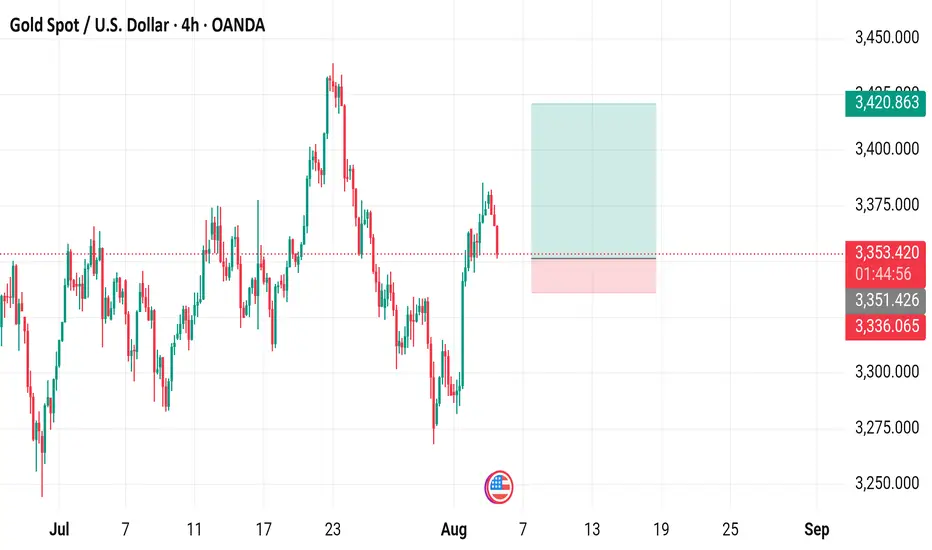
Gold Spot / U.S. Dollar (XAU/USD) - 4 Hour Chart (OANDA)4-hour chart from OANDA shows the recent price movement of Gold Spot (XAU/USD), currently at $3,353.240, down $20.395 (-0.60%). The chart highlights a sell price of $3,353.010 and a buy price of $3,353.450, with a shaded area indicating a support/resistance zone around $3,351.426 to $3,353.240. The data reflects trading activity from July to early September 2025.
Correction starts waiting for lower level to BUY✏️ CRYPTO:BTCUSD has broken the accumulation zone and established a corrective wave. With the main resistance zone being the lower boundary of the accumulation pattern 115600. In the larger timeframes, the BTC trend still has a strong bullish wave in the coming time. Therefore, these recovery waves are considered good opportunities to buy.
📉 Key Levels
BUY zone 110000
BUY Trigger Break and trading above 115600
Leave your comments on the idea. I am happy to read your views.

True or false? How to Decide Between Long and ShortInfluenced by the news related to tariffs, gold has just completed a fluctuation of nearly $20 in a very short period of time, breaking the silence of the gold market in one fell swoop. Separately, news indicates that the White House is planning to clarify the misinformation surrounding gold bar tariffs.
If there were traders who had rashly entered the market before, in the absence of strict trading system constraints and strict trading discipline, they would inevitably suffer certain losses regardless of whether they chose to go long or short.
This is also the reason why after giving my daily trading strategies, I will repeatedly emphasize the importance of strictly adhering to trading planning and discipline.
For ordinary traders, it's difficult to discern the authenticity of this news. After all, the Trump administration has a history of denying its own statements. Therefore, sometimes it's wise to remain on the sidelines.
This is also what I specifically reminded you to do when publishing my trading strategy this morning: be sure to trade with a small position today and be vigilant to potential unforeseen circumstances.
XAUUSD - The bullish backdrop remains strongOverall Market Sentiment
The bullish background remains strong: the dollar index is putting pressure on gold, while geopolitical tensions and expectations of a rate cut by the Fed are increasing demand for the safe-haven asset
Direction by indicators: on Investing.com — 9 “Buy” signals against 3 “Sell” signals on moving averages and a neutral overall state
Support and resistance levels
Key support levels: $3,320 and $3,368–$3,340. A rebound from this zone could serve as a starting point for growth
Resistance: it is important to break $3,400 — a psychological and technical barrier, above which a directional move to $3,450 and beyond will open
Short-term scenario (LiteFinance): gold is testing resistance in the $3,380–$3,391 zone; a drop from there could lead to $3,330 → $3,268, and a breakout to the upside would accelerate growth to $3,493–$3,515
Union traders are noting the movement after the breakout of $3,375: possible targets are $3,390, $3,402.56 and $3,416.39. A breakout below $3,374.91 could send gold to $3,358.25, $3,350.01 and $3,341.18
1H chart analysis: Gold confidently broke through the $3,350 level, opening a bullish scenario, confirmed by macro dynamics and expectations of monetary policy easing

Next Stop 3420? Gold Bulls Push the Limit!Gold has shown a step-by-step rise in the short term, and has stood above 3,400 many times, and the bullish force is relatively strong. However, correspondingly, after gold stood above 3400, it fell under pressure several times, so the shape was not particularly good, which increased the risk of pullback in the short term.
However, we do not need to worry. Gold is still running in an ascending wedge structure. Although it has been under pressure and fallen back several times during the attack on 3400, the bullish structure has not been effectively destroyed so far. Moreover, with the sharp increase in gold buying, the 3380-3370 area below has become an obvious intensive trading area, which has greatly limited the gold retracement space.
In addition, after gold broke through 3340, market sentiment tended to be optimistic. If gold experiences a short-term pullback, more funds will flow into the gold market, especially for those who have missed out on long trades before, who will rush into the gold market even more frantically. Under the resonance of the current technical structure and market optimism, gold still has the potential to hit 3400, and bulls are even expected to stand firm at 3400 and make further efforts.
So in terms of short-term trading, I still advocate that gold pullbacks are buying opportunities. And I cherish the opportunity to enter the market and go long in the 3385-3375 area, and am optimistic that gold will hit 3400 again, and may even continue the bull trend to the 3420-3430 area.
OANDA:XAUUSD FOREXCOM:XAUUSD TVC:GOLD FX:XAUUSD CAPITALCOM:GOLD

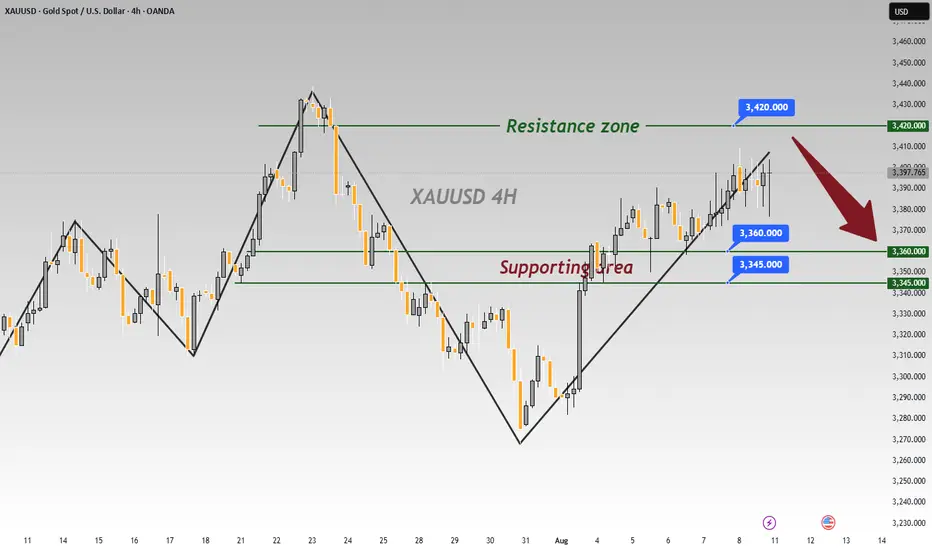
8/8: Continue to Focus on Selling, Watch Support at 3372–3366Good evening, everyone!
Today, after breaking above the 3400 level, gold experienced a pullback. The current structure shows dense support below, with previous resistance levels at 3378, 3372, and 3366 now turning into support.
On the daily chart (1D), price remains above the MA20, and the MA5 (~3382) serves as key short-term support. The candlestick formation still reflects a bullish structure for now.
However, the 4-hour chart (4H) reveals significant upward resistance, and unless the 4H structure is repaired, the market may favor a corrective or consolidation phase in the near term.
🔍 Trading Outlook:
For the remainder of today’s session and early next week, the strategy should primarily focus on selling into strength.
If the 4H chart corrects via a direct price retracement, gold could potentially test the 3348–3337 support zone.
Prior to that, closely monitor the 3372–3366 area as the primary short-term support and pivot zone.

XAUUSD Ascending Channel Run to Supply Trade IdeaGold (XAUUSD) remains in a bullish trend 📈, forming higher highs and higher lows within a well-defined ascending channel ↗️. Price is approaching a recent swing high near resistance 🧱, and I’m watching for a short-term pullback into channel support 🔄 before a potential continuation higher toward the supply zone above 🎯.
This structure aligns with Wyckoff’s markup phase ⚡, where pullbacks serve as tests (LPS) before further upside. As long as price holds above the channel’s lower boundary 🛡️, the bullish bias remains intact — a break below would invalidate the setup ⚠️. Not financial advice.

Gold is aiming at 3,440.00.Gold is aiming at 3,440.00.
Gold’s upward trend is poised to continue, driven by potential Federal Reserve rate cuts, ongoing central bank purchases, and increased ETF investments. Markets are betting on a 93% chance of a rate cut at the Fed’s next meeting. Central banks added 166 tons to global gold reserves in Q2, according to the World Gold Council, while gold-backed ETFs experienced robust inflows during the same period.
XAUUSD has been trading bullish during August 7 trading session. Уven the geopolitical relief did not prevent gold from continuing its upward path. On August 7 the price has successfully retested the 3,380.00 support and is currently heading towards the level of 3,440.00.

XAUUSD Potential buy and sell zone!XAUUSD Potentially coming for a dipper pullback as upon crossing the daily high we can see XAUUSD started reject from higher price and continue to drop to this daily and weekly support and may continue to drop.
It is possible for the market to potentially bounce off the weekly support as the market is moving up with a stronger momentum

The best ambush point for short positions below gold 3400.The daily structure of gold still maintains a bullish dominant pattern. The upper target is the upper Bollinger band of 3400. If it breaks through this position, the upside space will be further opened up. The 4-hour Bollinger band is gradually closing, and the price is fluctuating in the range of 3400-3360. In the short term, it is still treated with range thinking. Before an effective breakthrough, the operation can adopt a high-altitude and low-long strategy. Gold is currently at a critical node of change. If it rises and falls in the evening, it may release a temporary peak signal. The area below 3400 is expected to become an opportunity for the layout of medium-term short positions. The overall recommendation is to remain cautious, respond flexibly to changes in rhythm, and strictly control risks.
Gold operation suggestion: You can continue to try short selling in the 3390-3400 range, with the target at 3380-3370.

Gold - The diligent top formation!🏆Gold ( TVC:GOLD ) finished the bullrun:
🔎Analysis summary:
For the past 10 years, Gold has been trading in a very strong expected bullrun. Just like we witnessed it in 2011, a 10 year bullrun is followed by a shorter term bearmarket. Gold is starting to lose its strength, which is a clear sign of weakness and the beginning of a bearish reversal.
📝Levels to watch:
$2.800
SwingTraderPhil
SwingTrading.Simplified. | Investing.Simplified. | #LONGTERMVISION

Bullish Outlook Intact: Gold Targeting 3400-3410Gold encountered resistance and retreated several times on its way to 3400, but it remained above 3370 during the pullback, perfectly maintaining the integrity of its volatile upward trend. Therefore, even though gold's upward momentum has weakened, I still believe that due to structural support, gold still has the potential to reach the 3400-3410 area, and may even continue its bullish trend to the 3420-3430 area.
As gold prices rise, market sentiment tends to be more optimistic, and the price behavior reflected by the candlestick chart becomes clearer. The lows of gold continue to rise, and the highs always insist on setting new highs in the process of rising. The oscillating upward structure is particularly obvious. While greatly limiting the retracement space, it also greatly consolidates the support structure below and is conducive to further rises in gold. At present, gold has been confirmed to have stabilized above 3370, so gold may not give another chance to fall back to the 3360-3350 area.
Then in the next short-term trading, the gold pullback is a buying opportunity. We focus on the opportunity to participate in long gold after gold retreats to 3380-3370. The target will first look at the 3400-3410 area, and the higher target area is in the 3420-3430 area.

ACCORDING TO DXYAccording to dxy Gold maybe will move 500 to 700 pips on Monday. So if you want to sell 1st session if 1H close below 3395 than make sell and last tp 3378 and wait for buy signal.

Shorting at highs is steadier to avoid risksAlthough gold kept breaking through its daily highs last week, rising all the way to around 3410 before starting to pull back, and the daily lows were also gradually climbing – making it easy to profit whether going long or short – I still recommend prioritizing shorting at high levels. This way, we can avoid losses if gold drops sharply. 📉
Go short at highs during the Asian session 📉
Go long at lows during the European session 📈
Go short at highs again during the U.S. session 📉
⚡️⚡️⚡️ XAUUSD ⚡️⚡️⚡️
🚀 Sell@ 3410 - 3400
🚀 TP 3390 - 3380 - 3370
Daily updates bring you precise trading signals 📊 When you hit a snag in trading, these signals stand as your trustworthy compass 🧭 Don’t hesitate to take a look—sincerely hoping they’ll be a huge help to you 🌟 👇