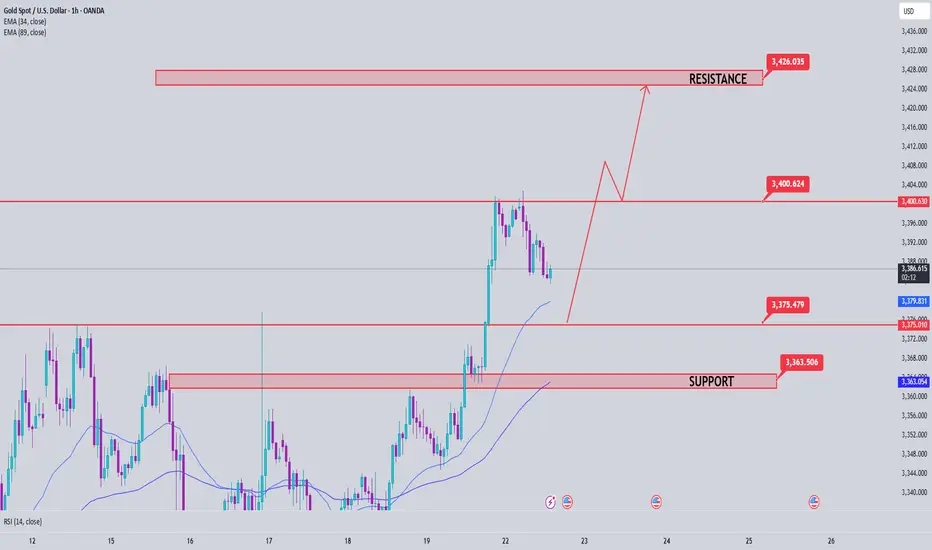
Gold Price Analysis July 22Gold continues to maintain its upward momentum as expected, and yesterday's session reached the target of 3400. This is a signal that the bullish wave structure is still holding. In today's European trading session, the price is likely to make a technical correction to important support zones before continuing the main trend in the US session.
The current trading strategy still prioritizes following the uptrend, focusing on observing price reactions at support zones to find safe entry points. Waiting for buyers to confirm participation is a key factor to avoid FOMO at the wrong time.
🔑 Key Levels
Support: 3375 – 3363
Resistance: 3400 – 3427
✅ Trading Strategy
Buy Trigger #1: Price reacts positively and rejects the support zone at 3375
Buy Trigger #2: Price rebounds strongly from the deeper support zone at 3363
Buy DCA (Moving Average): When price breaks and holds above 3400
🎯 Next Target: 3427
📌 Note: It is necessary to closely monitor price reaction at support zones to determine whether buying power is strong enough. If there is no clear confirmation signal, it is better to stay on the sidelines and observe instead of FOMOing to place orders.
Xauusdanalysis
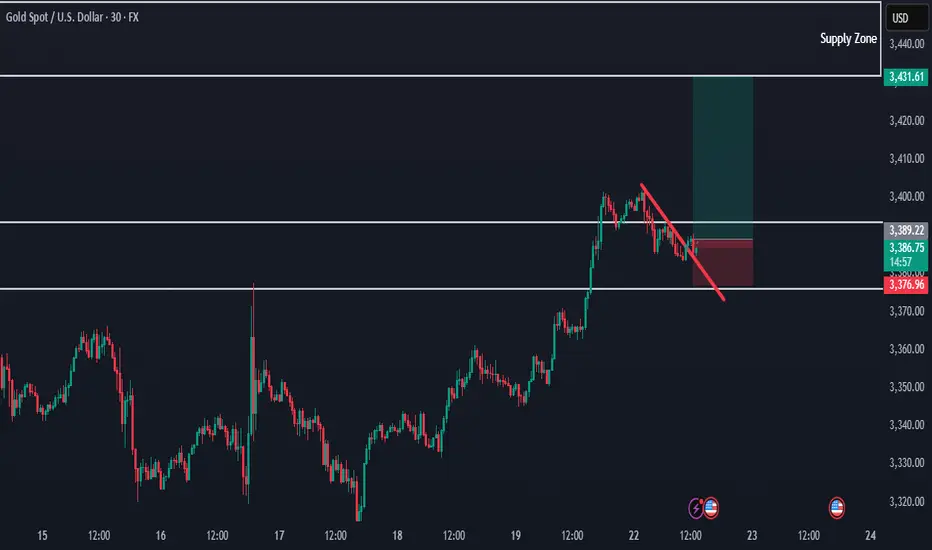
Gold Breaking Previous Highs — Bullish Trend ContinuesHello everybody!
Price is continuing its bullish trend and has broken some significant resistance.
According to the market structure, we’re looking for it to go higher, up to the 3430 area.
The break of the downward trendline is a confirmation for a buy position.
Manage your risk and trade safe!
Gold Bulls Back in Control as Trump Pressures Fed for Rate CutsHey Realistic Traders!
President Trump is ramping up pressure on the Fed to cut interest rates , saying the U.S. is falling behind countries with looser policies. As several Fed officials begin to shift their stance, expectations for rate cuts are growing. That’s putting pressure on the dollar and giving gold a fresh boost.
We’ll take a closer look at what this means for OANDA:XAUUSD (Gold) through technical analysis and explore its upside potential.
Technical Analysis
On the 4-hour chart, Gold has moved above the EMA-200, signaling a shift in momentum to the upside. Price has also broken out of a Descending Broadening Wedge (DBW) pattern, which often indicates the start of a bullish trend.
The breakout was confirmed by a Bullish Marubozu candle, reflecting strong buying pressure. To add further confirmation, the MACD has formed a bullish crossover, reinforcing the upward momentum.
Looking ahead, the first target is seen at 3417. If reached, a minor pullback toward the historical resistance zone (green area) may occur, with a potential continuation toward the second target at 3500.
This bullish outlook remains valid as long as the price stays above the stop-loss level at 3271 . A break below this level would invalidate the setup and shift the outlook back to neutral.
Support the channel by engaging with the content, using the rocket button, and sharing your opinions in the comments below.
Disclaimer: "Please note that this analysis is solely for educational purposes and should not be considered a recommendation to take a long or short position on XAUUSD.

Don't chase the bullish trend,wait for the short position layout#XAUUSD
The tariff policy recently announced by the US government is undoubtedly the focus of the current gold market. Trump also tied the tariffs to the trial of former Brazilian President Jair Bolsonaro, adding to policy uncertainty. ⚖️
The implementation of the tariff policy may push up commodity prices, thereby exacerbating inflationary pressure, which is both an opportunity and a challenge for gold📊. On the one hand, rising inflation expectations may enhance the attractiveness of gold as an anti-inflation asset; on the other hand, the strengthening of the US dollar and US Treasury yields may offset this positive. 💡
At present, the lower support has moved up to the 3375-3365 area, where a top-bottom conversion position will be formed. The upper short-term resistance level is 3387-3393, the previous high. If the market touches this for the first time, you can try to see a double top fall.
🚀SELL 3385-3390
🚀TP 3365-3355
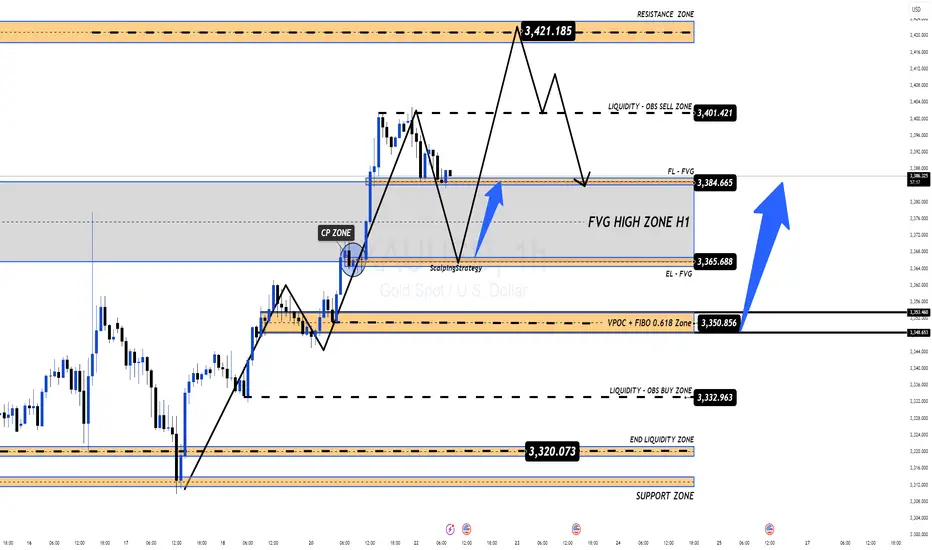
Gold 22/07 – Reversal in Sight After $3400? Watch These Key Zone XAUUSD – Intraday Market Outlook (22/07)
Gold posted a strong rally in the previous session, completing its short-term impulsive wave structure. However, as price approached the psychological resistance at $3400, it began to lose momentum, and a clear reversal candle appeared — a signal that today’s session may favour a pullback or correction.
🔍 Technical Overview
After printing a short-term top, gold is now retracing and has reached a critical support area: the FVG High Zone on the H1 chart. If bearish pressure continues and this level fails to hold, price is likely to drop further in search of deeper liquidity zones.
🔽 Key BUY Zones to Monitor Today
✅ Zone 1 – EL (End Liquidity within FVG): 3367 – 3350
→ A zone with strong potential for short-term rebounds due to previous liquidity sweeps.
✅ Zone 2 – Confluence of FIBO 0.5–0.618 + VPOC (3350 – 3335)
→ A technically significant area where multiple factors align — ideal for medium-to-long term entries.
📌 Trade Setup Ideas
🔸 BUY ZONE: 3351 – 3349
Stop Loss: 3344
Take Profit Targets:
3355 – 3360 – 3365 – 3370 – 3375 – 3380 – 3390 – 3400 – ???
🔸 BUY SCALP ZONE: 3366 – 3364
Stop Loss: 3360
Targets: 3370 – 3375 – 3380 – 3385 – 3390
🔻 SELL ZONE: 3420 – 3422
Stop Loss: 3427
Targets: 3415 – 3410 – 3405 – 3400 – 3390 – 3385
⚠️ Market Risk Reminder
While no major economic data is expected today, that doesn’t mean the market will stay calm. Unexpected volatility can still arise from geopolitical tensions or unscheduled central bank comments. Gold tends to compress and break out aggressively in low-news environments.
📌 Protect your capital with disciplined Stop Loss and Take Profit levels — no forecast is ever 100% certain.
📈 Strategic Outlook
Short-term bias: Market is likely to continue correcting
Medium to long-term plan: A deeper pullback could offer an excellent opportunity to build long positions from key demand zones, especially as markets begin to price in potential Fed rate cuts and gold continues its long-term bullish trend.
💬 Be patient, wait for confirmations, and trade with a clear plan — that’s what separates consistency from chaos.
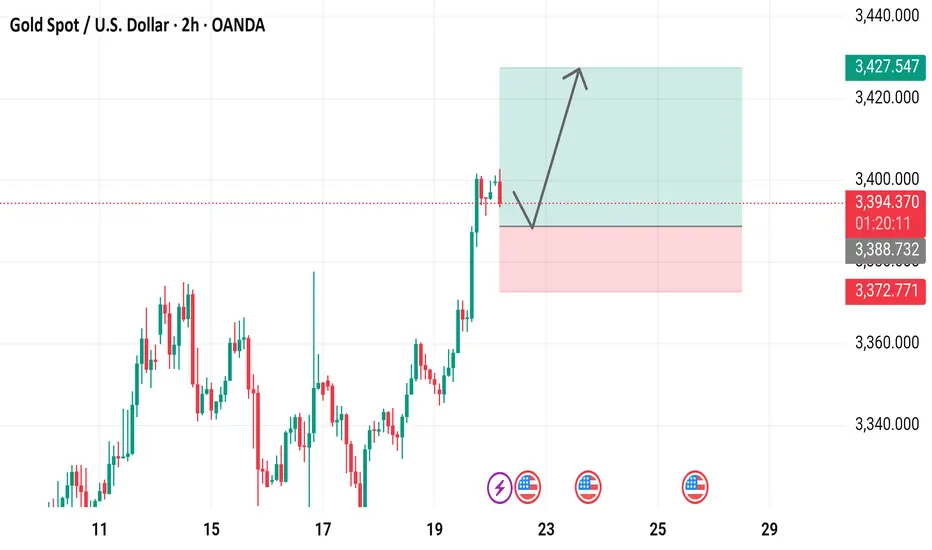
Gold Spot / U.S. Dollar (XAUUSD) 2-Hour Chart - OANDA2-hour candlestick chart displays the price movement of Gold Spot against the U.S. Dollar (XAUUSD) from OANDA, covering the period up to July 22, 2025. The current price is 3,395.285, reflecting a 1.775 (-0.05%) decrease. The chart includes buy/sell indicators (3,395.780 buy, 3,394.890 sell), a highlighted resistance zone around 3,400-3,425, and a support zone around 3,370-3,386. The chart also features technical analysis tools and annotations indicating potential price trends.
GOLD to the MoonHiper Clear Structure and the beginning of a new impulse towards 3.600 and 3.700
Hope everybody had a chance to got in
gg

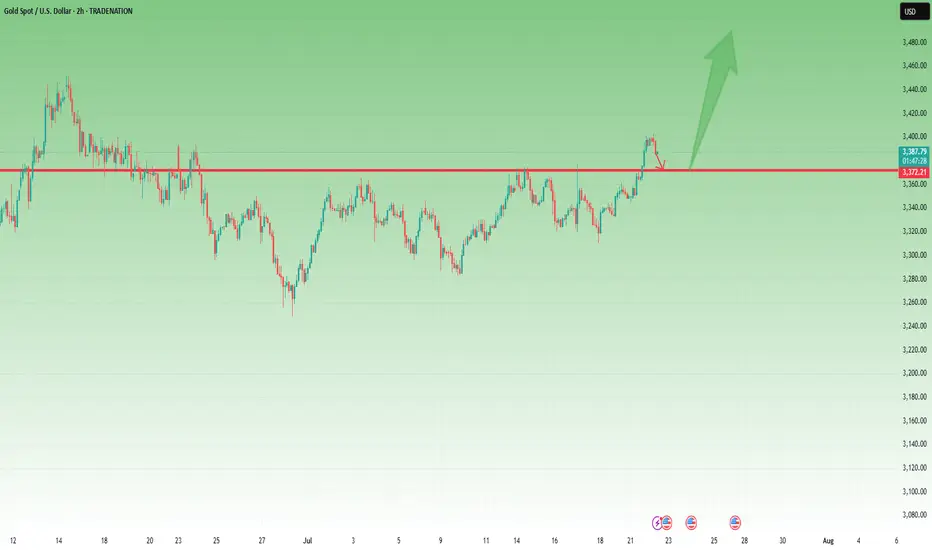
Gold - Above 3370 Is Bullish Territory – But 3360 Must Hold📆 What happened yesterday?
After more than a week of frustrating, sideways price action, Gold finally broke out above the key 3370 resistance zone.
The breakout was clean and impulsive, with TRADENATION:XAUUSD pushing to an intraday high around 3400.
Following that move, price printed a small double top near the high and began a modest correction — perfectly normal after such a breakout. At the time of writing, Gold trades at 3385, still holding above former resistance.
📈 Why this breakout matters:
The daily close at 3396 came in strong and near the top, leaving behind a clear Marubozu candle
This kind of price action signals conviction and momentum
The breakout confirms what I’ve been anticipating for days — the range is resolved, and the market is choosing the bullish path
🎯 What to expect next:
If price stabilizes above 3400, the road to 3450 opens — which is the target mentioned in my previous analyses
That area represents the next major resistance and likely magnet for price if bulls stay in control
🧭 Trading Plan:
For me, the plan is now simple:
✅ Buy the dips — especially on a potential retest of the 3370–3375 broken resistance, which now turns into support
❌ Negation comes only with a daily close below 3360, which would invalidate this breakout and raise questions
📌 Conclusion:
The breakout has finally come. After days of coiling, Gold chose the upside.
Momentum is building, structure is clean, and bulls are back in control — unless 3360 fails.
Until then, I remain bullish, looking to buy dips into strength. 🚀
Disclosure: I am part of TradeNation's Influencer program and receive a monthly fee for using their TradingView charts in my analyses and educational articles.
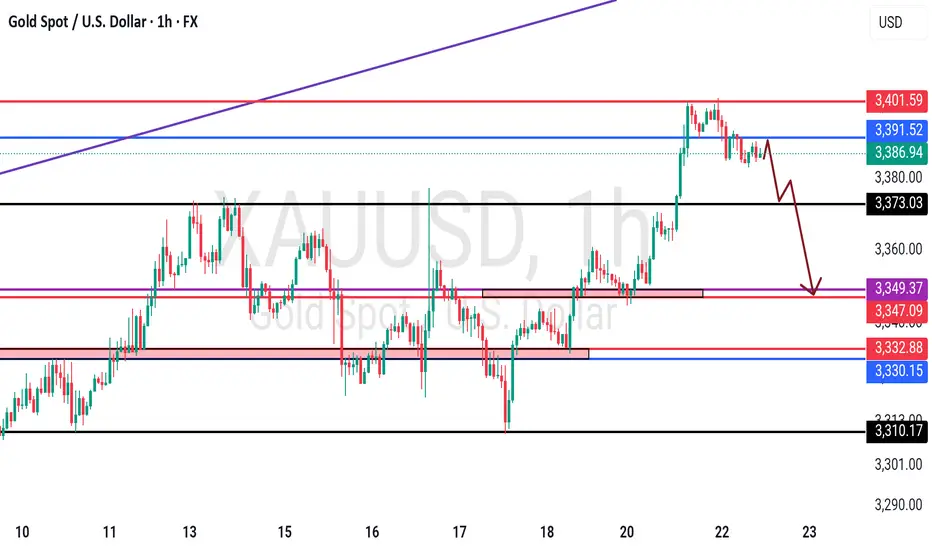
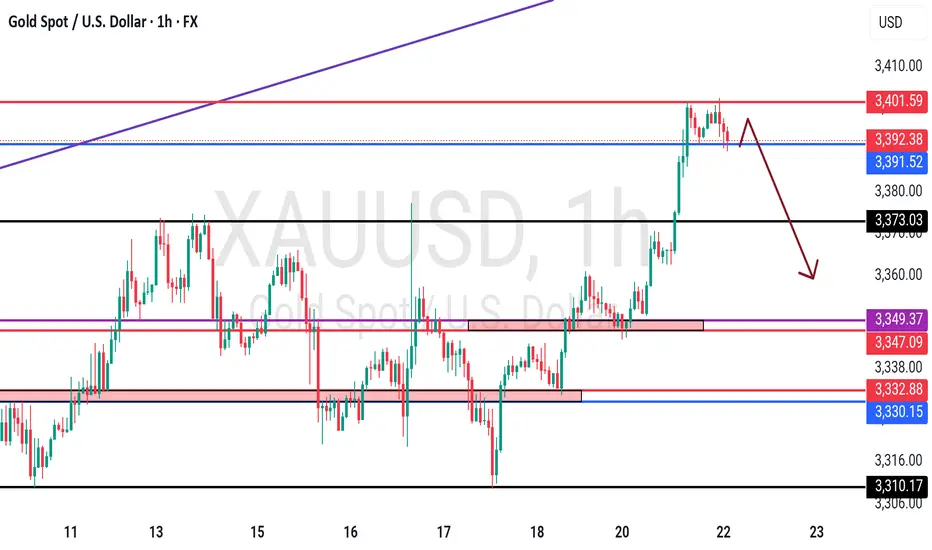
More Pain for Gold? The Charts Say It’s PossibleSince the start of the London market, gold has almost maintained a narrow range of fluctuations in the 3390-3385 area. Compared with yesterday, the market is much weaker today, and gold has failed to stabilize at 3400 several times, indicating that the sentiment of cashing out near this area is also very high. From the current gold structure, gold is obviously biased towards a long structure. Since gold broke through 3400, 3375-3365 has become the key support area after the top and bottom conversion in the short term.
However, gold rose strongly yesterday but did not stabilize at 3400. The bullish sentiment may no longer be strong. Moreover, after the accelerated rise in gold, the sustainability was not strong, so gold still needs to retreat in the short term. This is why I insisted on shorting gold again near 3400 yesterday. Therefore, I think gold has not yet retreated to the right level. I will pay attention to the opportunity to go long on gold after it pulls back to the 3375-3365 area.
Gold fell after touching 3400 twice. Whether a short-term effective "M" double top structure has been formed, I think more signals are needed to verify. However, in the short term, it is still under pressure in the 3405-3410 range, so if there is no major positive news, I think gold may maintain a wide range of fluctuations in the 3410-3360 range. Therefore, if gold rises to the 3400-3410 range again, I will continue to try to short gold!
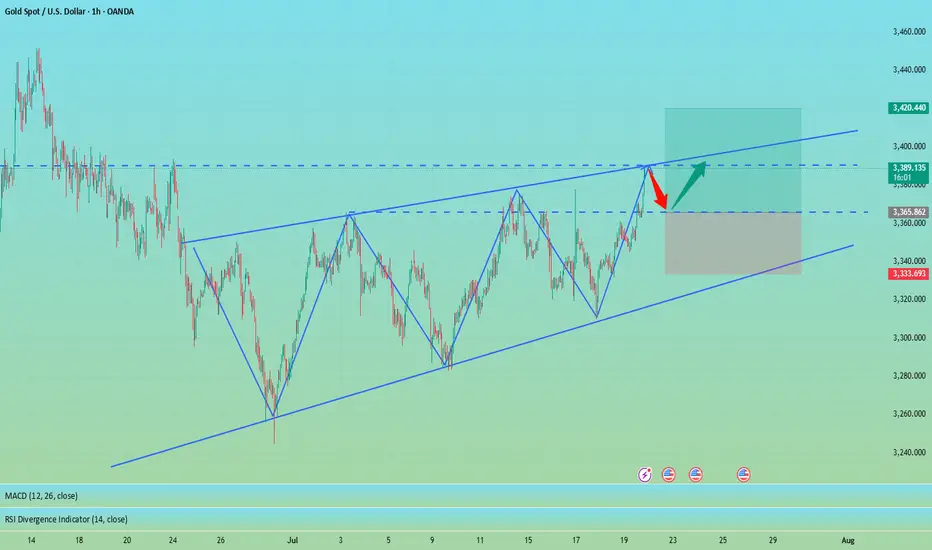
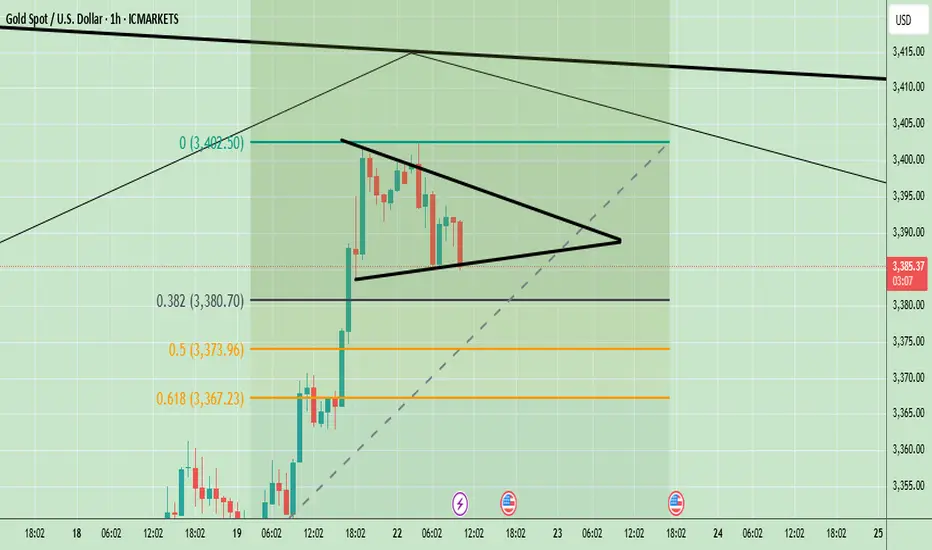
XAUUSD Technical Analysis – Triangle Breakout Ahead?Gold is currently consolidating in a symmetrical triangle pattern around $3,389. If it breaks above $3,402, we can expect a bullish continuation toward $3,420 and beyond. Key support lies at $3,367; a breakdown below this level would turn the trend bearish. The overall trend is still bullish, but a breakout is needed for confirmation.
📈 Potential Scenarios:
✅ Bullish Breakout Scenario:
- Break above $3,392–$3,402 zone.
- Targets: $3,420 > $3,450 > $3,480
- Supported by strong upward BOS (Break of Structure) and higher lows.
❌ Bearish Breakdown Scenario:
- Breakdown below $3,373–$3,367 zone.
- Targets: $3,355 > $3,345
- Would invalidate current bullish structure and form a lower low.
🔮 Trend Bias:
Bullish Bias remains intact as long as price stays above $3,367 and maintains higher lows. However, consolidation suggests waiting for breakout confirmation from the triangle before entering new trades.
🧭 Trend Outlook:
Gold is currently consolidating in a symmetrical triangle pattern, which typically precedes a breakout — either upward or downward. The price is holding above the key Fibonacci support levels and the overall market structure is bullish, suggesting an upward continuation is more likely if buyers maintain momentum.
Note
Please risk management in trading is a Key so use your money accordingly. If you like the idea then please like and boost. Thank you and Good Luck!
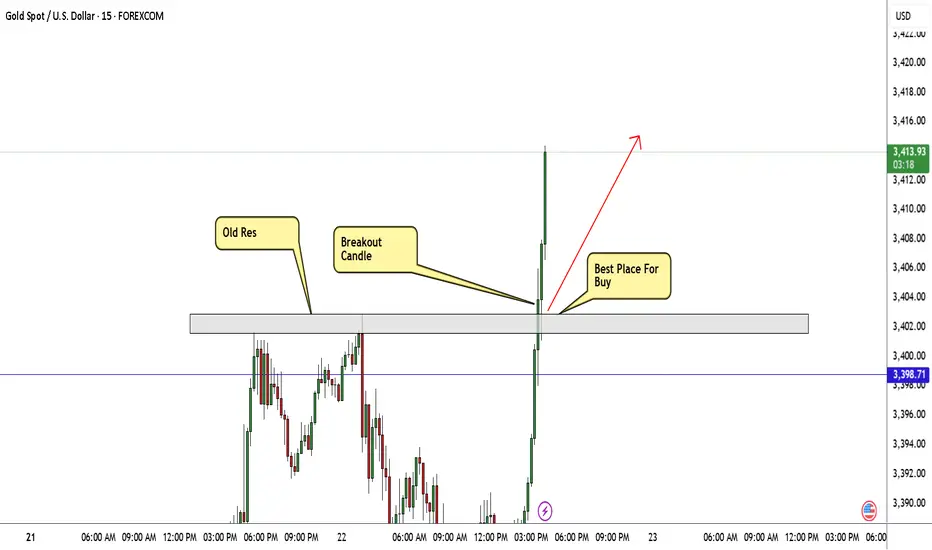
GOLD Still Bullish , Are You Ready For New Wave ? 200 Pips ValidHere is My 15Mins Gold Chart , and here is my opinion , we finally above 3400.00 and we have a 30 Mins Candle closure above this strong res , so i`m waiting the price to go back and retest this res and new support and give me a good bullish price action to can enter a buy trade and we can targeting 200 pips , and if we have a 4H Closure Above This res this will increase the reasons for buyers , just wait the price to back a little to retest it and then we can buy it . if we have a daily closure below it this idea will not be valid anymore .
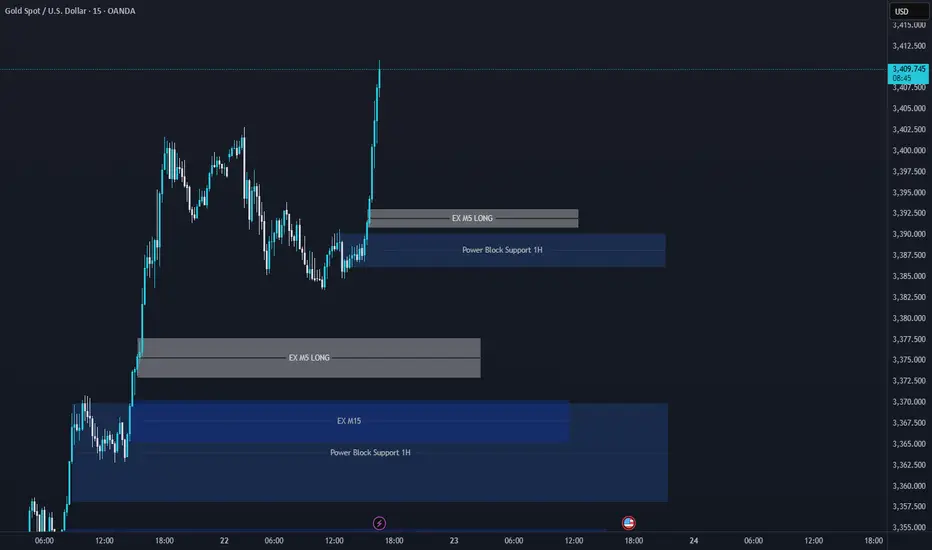
XAUUSD Support & Resistance Levels🚀 Here are some key zones I've identified on the H1/M15/M5 timeframe.
These zones are based on real-time data analysis performed by a custom software I personally developed.
The tool is designed to scan the market continuously and highlight potential areas of interest based on price action behavior and volume dynamics.
Your feedback is welcome!
gold still strong on buyinggold still taking the bullish stand, possible we expect price to keep buying if the H1 closes above 3405 area, then followed by M30 close below 3395 for selling.
the bullish is still strong depending on how the H1 react

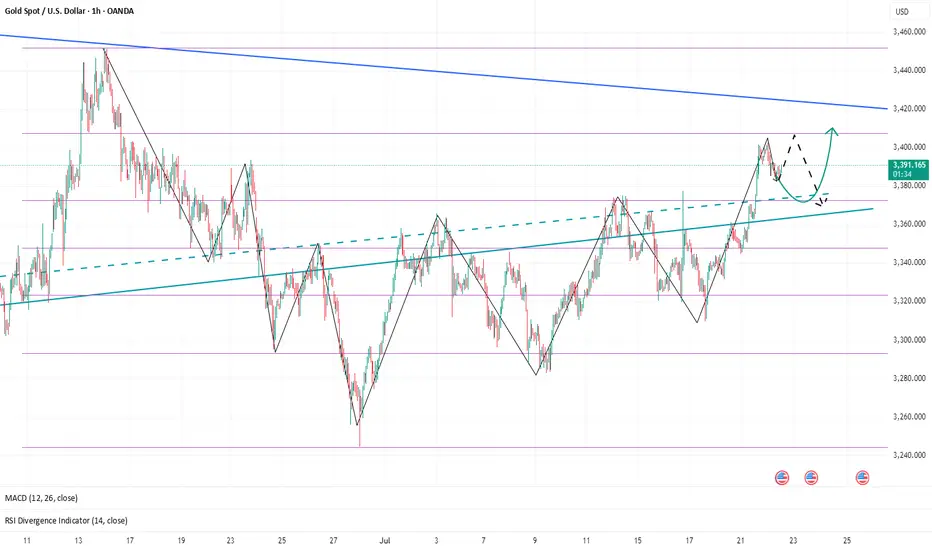
XAUUSD Trade Idea: Golden Cross Signals Bullish MomentumGold (#XAUUSD) is surging after breaking above the 61.8% Fibonacci level, confirming strong bullish momentum!
📊 Key Observations:
Price has bounced off the upper trendline, with an imbalance below, suggesting a possible small correction.
The MA50 has crossed above the MA200, forming a Golden Cross – a highly bullish signal!
🎯 Trade Strategy:
🔼 Consider buying ONLY if price consolidates above 3400 & the nearest fractal.
✅ Target: 3435 (next resistance zone)
⚠️ Watch for pullbacks – the Golden Cross supports upside, but a retest of support could offer a better entry.

The bulls rise and fall back to continue.Yesterday, gold technically held high and rose strongly in the Asian session relying on the 3350 mark. Both the European and American sessions formed a strong bullish rise and accelerated to break through the 3370 mark before the US session and continued to rise to the vicinity of the 3400 mark and fell back slightly to close strongly. The daily K-line closed with a shock break of the high-middle positive. The overall gold price broke through the recent rebound high of 3377 to form a bullish strong attack pattern. In the short term, 3377-80 became a new key support area.
From the 4-hour analysis, today's retracement relies on this position to continue to follow the trend of the main bullish bullish trend. The short-term bullish strong dividing line focuses on the 3350 mark. The daily level stabilizes above this position and continues to maintain the rhythm of retracement and bullish bullish trend. Short selling can only enter the market at key points, and enter and exit quickly without fighting.

gold on bulish reverse#XAUUSD await multiple breakout above 3389, possible target will reach new Day high 3305.
Entry at 3389 on 2 times breakout, target 3405 stop loss 3381.
Below 3380. on m15 closure will drop the price

Gold trend analysis: bullish but not chasing the rise.Gold, last Thursday's daily line closed with a long lower shadow, bottomed out and stabilized, and once again stabilized at the lower track support point of the large convergence triangle. Combined with the cyclical movement after the two stabilizations at 3247 and 3282, it was three consecutive positive rises; therefore, last Friday, and at least these two days on Monday this week, there will be consecutive positive rises; today gold rose as expected, the Asian and European sessions continued to be strong, and there was a second rise in the U.S. session. Since the U.S. session went directly higher before and after, the current support below has moved up to the 3377-75 area, where a top and bottom conversion position will be formed. Therefore, if it falls back to 3375-77 in the evening, you can continue to go long and look to above 3400. If it falls below 3370, it will fluctuate. The upper short-term resistance level is 3387-3393, the previous high. If the market touches here for the first time, you can try to see a double top decline.

Gold opening operation strategy.Gold's trend on Friday was mainly volatile upward. It can be said that gold was in a volatile market on Friday night, closing at 3350. If there is no stimulation from international news over the weekend, we will continue to be bullish next week. If your current gold operation is not ideal, I hope Tian Haoyang can help you avoid detours in your investment. You are welcome to communicate with us!
From the 4-hour analysis, the short-term support below continues to focus on around 3340-45, and the strong support is at the 3310 level. The key pressure above is the 3380 line. We will rely on this range to maintain the main tone of high-altitude and low-multiple cycles. For the middle position, we will watch more and do less, and be cautious in chasing orders, and wait patiently for key points to enter the market.
Investment is not a matter of one day or one night. Losses in the early stage do not mean losses in the later stage; profits in the early stage do not mean profits in the later stage. Therefore, friends who lose money should not be discouraged, and friends who make profits should not be complacent. Let yourself invest rationally with a peaceful mind. In this ever-changing market, the rise and fall of the market is not determined by personal subjective will, but is full of more than empty fights. Victory and failure are always around, but one thing is that the trend of the market will determine the future direction. The three steps of setting the trend, selecting the position, and controlling the position are success. Therefore, choice is far greater than hard work. Choosing a good teacher will benefit a lot, and I have always been there.

Gold opening market trend analysis.Last week, the gold price rebounded after hitting the low of 3310. The 4-hour chart shows that the Bollinger Bands failed to open downward, and the current market still maintains a volatile trend. Although the short-term price is easy to rise and difficult to fall, it should be noted that the three-month adjustment cycle is coming to an end when the fundamentals of the bull market remain unchanged, and the daily level change window is approaching. It is recommended to focus on preventing risks (especially short-term operation risks) at the opening today and wait patiently for the unilateral market start signal. In terms of short-term operations, the hourly chart price broke through the key level of 3344 after stepping back to the support of 3332. Today's overall trend is volatile and bullish. It is recommended to wait for the price to fall back to the 3337-3342 range to arrange long orders in batches at the opening today. Focus on the 3356-3366 resistance band above. If you encounter resistance, you can try short-term operations. Be sure to strictly stop losses to prevent the risk of false breakthroughs.

Gold continues to rise.The gold hourly line fell slightly to 3346 this morning and stabilized. It bottomed out and pulled up again to stand on the middle track of the hourly line, which means that the short-term stabilized and the overnight 3361 suppression adjustment ended. Looking at the second pull-up, this should have happened in the US market last Friday, but it was delayed until today. Finally, it successfully reached the 3366 target and hit the 3370 line;So today's Asian market rose, the European market continued to break high, and the US market still had a second pull-up; but because it is in a period of shock, wait patiently for a wave of stabilization before taking action. The reference point to choose is to pay attention to the 3382 split support, that is, 3361-60, which happens to be the top and bottom conversion support point, followed by 3358-56, 50 split support and the middle track, the limit is here, and then the starting point of 3350 cannot and should not break, otherwise it will encounter shocks and washes back and forth; the upper resistance level is concentrated at 3390-3395. It is expected that 3390 will not be able to break through in one breath for the time being. You can try to see a decline when you approach it for the first time;

GOLD - Cut n Reverse Area? What's next??#GOLD... Perfect holdings upside as we discussed in our video and last idea.
Now 3390-91 is major key level because only above that you can see again bounce otherwise not.
NOTE: we will cut n reverse above 3390-91 on confirmation.
Good luck
Trade wisely
GOLD - at cit n reverse area? What's next??#GOLD... market perfectly moved as per our video analysis and now market just reached at his current ultimate swing area
That is around 3402
So if market holds 3402 in that case selling expected otherwise not.
NOTE: we will go for cut n reverse above 3402 on confirmation.
Good luck
Trade wisely
Gold is under pressure. There is hope for another rise.Today's important news:
At 8:30, Fed Chairman Powell delivered a welcome speech at a regulatory meeting; at 13:00, Fed Governor Bowman hosted a fireside chat session at the large bank capital framework meeting hosted by the Fed.
Market conditions:
The current daily trend is mainly "strong rise" (Monday closed positive and broke through the shock, and the moving average turned upward). The core logic is that short-term bullish momentum is dominant, and it is necessary to focus on the effectiveness of support and the rhythm of breaking through resistance.
Today, we need to focus on the support belt 3365-3360 area (this position is the 5-day moving average position and the low point of yesterday's European session). As a short-term moving average support, this area is the first line of defense for bulls today. If it can stabilize here, it can be regarded as a signal of short-term strong continuation.
The key pressure level is still around 3420. As a trend line resistance that has been under pressure many times in the early stage, if it can break through, it means that the bulls will break the shock suppression and open up more room for growth.
In terms of operation, it is still mainly low-long. The current gold is still strong. Operation strategy:
Short around 3420, stop loss 3430, profit range 3400-3380
Long around 3360, stop loss 3350, profit range 3380-3400
