gold on sell reverse#XAUUSD price have multiple retest between the second and third pattern, now we await for drop below 3370-3360 possible for buy reverse.
Sell entry 3390, stop loss 3400, take profit 3370-3360.
Possible long candle closure on H1 above 3402 will continue bullish till 3420.
Xauusdanalysis

Gold price forecastGold prices continued to rise as weaker-than-expected labor market data showed that the number of Americans filing new claims for unemployment benefits was higher than economists had expected.
The U.S. Labor Department said on Thursday that initial jobless claims rose to a seasonally adjusted 226,000 for the week ended Aug. 2. That was higher than forecasts, with analysts expecting 220,000. The previous week's figure was also revised up to 219,000.
Meanwhile, the four-week average of new claims, a more reliable measure of the labor market because it strips out weekly fluctuations, came in at 220,750, below the forecast of 222,000 and compared with the previous week's adjusted average of 221,250.
Continuing jobless claims - which reflect the number of people receiving benefits - came in at 1.974 million for the week ended July 26, above forecasts of 1.947 million and the previous week's revised 1.936 million.
Weaker-than-expected US labor market developments are adding to gold's upside as investors bet the Federal Reserve will soon shift to a dovish stance to support growth.

Risk aversion is intensifying. Is gold poised for a breakout?Gold prices fell slightly in Asian trading on Friday, retreating from a two-week high of $3,409 hit the previous day as most investors chose to take some profits before the weekend.
Nevertheless, trade-related uncertainties continue to support gold. US President Trump announced this week that he would impose additional tariffs on Indian imports as a "punishment" for its purchase of Russian oil, raising the total tariff to 50%. He also plans to impose additional tariffs on semiconductors and pharmaceutical products next week.
In addition, the Federal Reserve’s policy expectations are also positive for gold prices. US non-farm payroll data for July was weak, with unemployment claims rising for the second consecutive week, signaling a weakening labor market. Data from the US Department of Labor showed that initial jobless claims rose to 226,000 in the week ending August 2, the highest level since early July.
Technically, gold prices encountered resistance near the upper limit of the daily rising channel and retreated after testing $3,410. Previously, the price of gold effectively broke through the resistance area of $3,380, showing that bulls still have momentum.
The momentum indicators in the daily chart: MACD and RSI remain upward, but the short-term rise has slowed down, indicating that the market has entered a consolidation phase.
If the gold price can regain its footing above $3,409, it is expected to test the $3,420 resistance area, and further targets will point to the historical highs of $3,434 or even $3,500.

The trend has not changed, go long and look for new highs#XAUUSD
Gold fluctuated at a high level in the Asian session, and the market has not yet taken a clear direction. Despite the current market conditions being extremely flat, caution remains regarding the potential for wider volatility after a breakout above key levels. The current short-term resistance area above gold is 3400-3410. With the breakthrough of yesterday's high today, the short-term support level will also move up. The middle track of the Bollinger band at the hourly level below has also risen to around 3390. The focus of the European session is whether gold can effectively break through the short-term suppression. If the European session is under pressure and encounters resistance, then gold may have a correction. It can be considered to retreat to the 3390-3378 area below and stabilize before lightly long gold to see new highs. Be wary of potential black swan events on Friday.
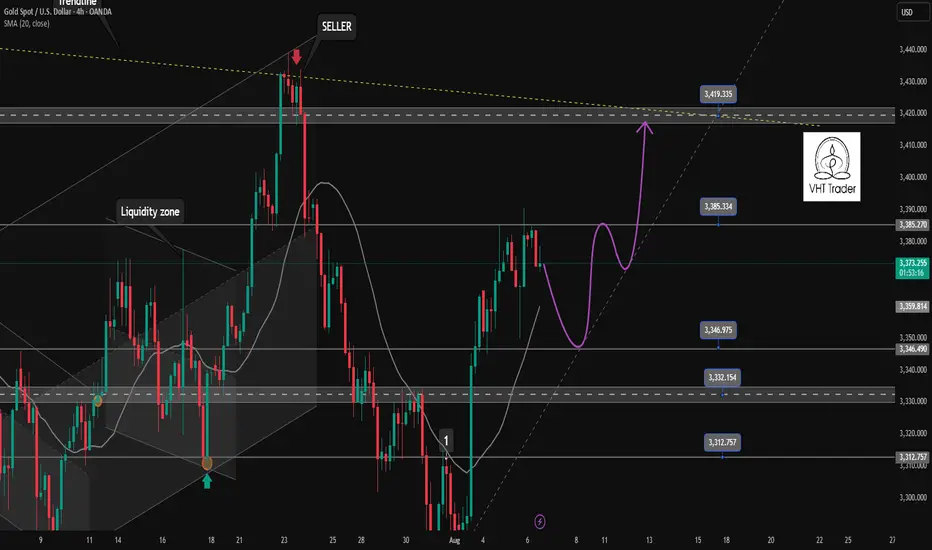
The best ambush point for short positions below gold 3400.The daily structure of gold still maintains a bullish dominant pattern. The upper target is the upper Bollinger band of 3400. If it breaks through this position, the upside space will be further opened up. The 4-hour Bollinger band is gradually closing, and the price is fluctuating in the range of 3400-3360. In the short term, it is still treated with range thinking. Before an effective breakthrough, the operation can adopt a high-altitude and low-long strategy. Gold is currently at a critical node of change. If it rises and falls in the evening, it may release a temporary peak signal. The area below 3400 is expected to become an opportunity for the layout of medium-term short positions. The overall recommendation is to remain cautious, respond flexibly to changes in rhythm, and strictly control risks.
Gold operation suggestion: You can continue to try short selling in the 3390-3400 range, with the target at 3380-3370.

Gold (XAU/USD) 4H Institutional Outlook — August 8, 2025Overview
As of writing, XAU/USD is trading around $3,392.30 in the 4-hour session, holding firmly above the $3,370–$3,380 support shelf. The recent price action reflects ongoing bullish momentum, driven by escalating geopolitical risks, weak U.S. labor market data, and renewed safe-haven flows after the announcement of U.S. tariffs on gold bars.
This analysis outlines the primary institutional Buy and Sell Zones for the day, based on Smart Money Concepts (SMC), ICT methodology, Order Block/FVG confluence, and 4H price structure. All zones presented are execution-ready and supported by multi-layered validation from institutional frameworks.
✅ Current Price Context
Live Price (XAU/USD): $3,392.30 (as of ~03:00 UTC)
Structure: Bullish (Higher Highs and Higher Lows)
Bias: Bullish, with continuation toward $3,420+ likely if key support holds
Recent High: ~$3,410
Key Support Base: $3,375–$3,385
The bullish market structure remains intact with strong institutional displacement legs to the upside and well-defined liquidity targets still in play above $3,420.
🔍 Institutional Trade Zones (4H)
🟩 Primary Buy Zone (Execution-Ready Long Setup)
Entry Range: $3,375 – $3,385
Stop Loss: Below $3,370 (beneath liquidity shelf and unmitigated OB)
Target 1: $3,420 (1.272 Fib extension)
Target 2: $3,450 (1.618 Fib extension)
Confluence Factors:
Unmitigated Demand Order Block (RBR)
Embedded Fair Value Gap following impulsive buy-side displacement
0.705–0.79 OTE retracement zone from latest swing
Liquidity sweep under equal lows at ~$3,370
Volume imbalance supports continuation from this zone
Located within Discount territory of internal swing
Overlaps with Asia–London Kill Zone
➡️ This zone offers the highest confluence of institutional logic today and is nominated as the Golden Zone.
🟥 Primary Sell Zone (Countertrend Reversal Setup)
Entry Range: $3,415 – $3,425
Stop Loss: Above $3,430
Target 1: $3,380
Target 2: $3,350
Confluence Factors:
Fresh Supply Order Block (DBD) at premium pricing
Presence of FVG following sell-side displacement
0.705–0.79 OTE retracement from bearish leg
EQH liquidity resting just above entry
Strong rejection wicks during NY session
Volume imbalance confirms sell-side aggression
New York Kill Zone alignment
⚠️ Consider only if price cleanly enters the upper premium zone and shows rejection or sweep behavior.
🟨 Fallback Buy Zone (Contingency Setup)
Entry Range: $3,365 – $3,370
Stop Loss: Below $3,360
Target: $3,385 → $3,395
Confluences:
Secondary Demand OB
Partial FVG
In Discount territory
Liquidity resting just below $3,365
Volume tapering indicates absorption
Use only if Primary Buy Zone is invalidated via strong stop-run or displacement.
🟥 Fallback Sell Zone (Contingency Setup)
Entry Range: $3,430 – $3,435
Stop Loss: Above $3,440
Target: $3,400 → $3,380
Confluences:
Lower timeframe mitigation zone
FVG within premium zone
Above EQH liquidity
Fulfills repricing logic after overextension
Valid only if the primary sell zone is invalidated by sweep and reversal pattern confirmation.
🌐 Institutional Sentiment Confirmation
Reuters confirms gold reached multi-month highs due to tariff-induced safe-haven flows
FXStreet reports gold holds above the 20-day EMA with a bullish intraday structure
FXEmpire technicals target $3,450–$3,500 extension zones if bullish pressure sustains
COT positioning and fund flows show continued institutional interest in gold longs
🔔 Final Notes for Execution
Allow price to retest and react within the zone before entering.
Prefer entries during Asia-London or London-NY Kill Zones
Avoid market chasing — wait for confirmations such as sweep → displacement → mitigation

Gold Holds Firm. Continues to Set New Highs?After four consecutive days of gains, gold continued its volatile upward trend on Thursday, reaching a new high for August. This performance suggests a relatively strong, volatile upward trend in the short term. The moving average system is currently extending upward, providing some support for the rise.
In the short term, focus on the support strength near 3380 on the MA5 moving average, which is a key indicator of the short-term trend. If this support level is broken, continue to monitor support near 3370 and 3365. 3370 marked the low point of Thursday's rapid decline in the European session, while 3365 marked the lowest point reached on Thursday.
It is worth noting that gold has maintained an overall volatile upward trend this week, with prices continuously reaching new highs. Therefore, as long as the price remains above yesterday's low, Quaid believes the market will continue to fluctuate upward. On the upside, we need to pay attention to the resistance near 3400-3410. The price has tried to break through many times, but has failed to stabilize above the integer mark of 3400. If it fails to break through strongly, the price will most likely make a correction and try to break through again after accumulating upward momentum.
Trading Strategy:
Short around 3405, stop loss at 3415, profit range 3380-3365
Long around 3365, stop loss at 3355, profit range 3380-3400

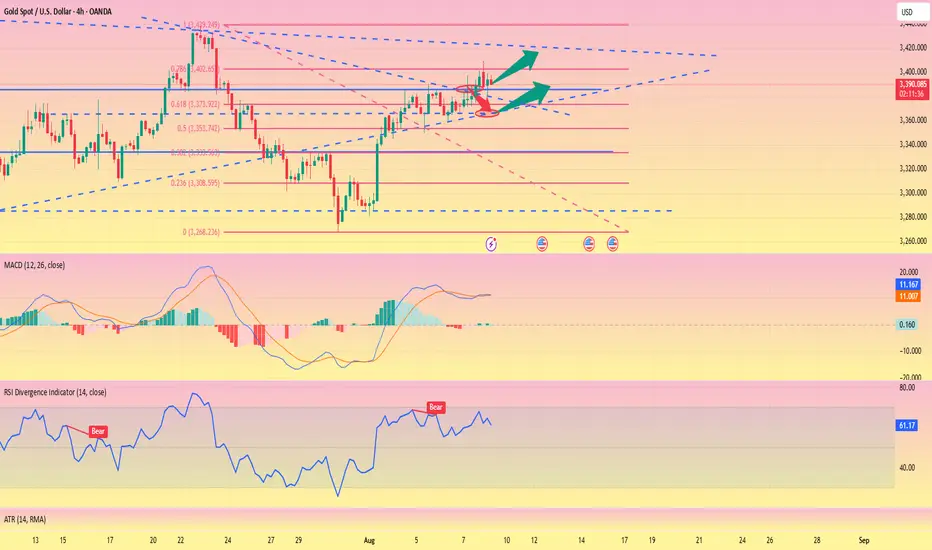
Gold may be taking a breatherWhat we know:
- Price has moved up strongly but is now forming a sideway-up structure.
- The range can be drawn as a wedge.
- Structure looks similar to a Motive wave.
- There are signs of Throw-under and Throw-over.
- This could be interpreted as a Leading Contracting Diagonal, or possibly evolving into a Flat pattern.
What to do:
- Wait for the uptrend to be invalidated by a breakout to the downside,
- Then observe the sideways movement to assess the next trend direction.

GOLD: Bullish Shift ConfirmedBullish BOS, price is trading above 3360. Clean bullish choch formed creating a new HH. Look to buy...
(H4)
✅ New HL formed around 3280 and we now have a break above $3355 and $3360 = BOS confirmed.
🟢 Key Zone: 3322–3337
(H1)
✅ BOS above 3360 confirms bullish bias
✅ Key Zone: 3322–3337 (Use this zone to set a limit or watch for confirmation)
Retracement expected before continuation.
(M15)
👀 What to Watch:
If price opens lower and taps into 3330s, monitor for:
✅ Sweep of intraday lows
✅ M15 bullish BOS above 3348–3350
🔁 Entry on retest of new demand zone after BOS
❌ Invalidation: Break and close below 3305
Other Scenario: No Pullback — Buy Breakout Instead
If price opens strong and continues up from the 3360s, wait for:
✅ Bullish Break of Structure (BOS) Above: 3385
This is your confirmation level that buyers are still in control

GOLD Breakout Done , Long Setup Valid To Get 150 Pips !Here is My 15 Mins Gold Chart , and here is my opinion , we finally above 3384.00 and we have a 30 Mins Candle closure above it And Perfect Breakout , so we have a good confirmation now to can buy it and we can targeting 100 to 150 pips .
Reasons To Enter :
1- New Support Created .
2- Bullish Price Action .
3- Bigger T.F Giving Good Bullish P.A .
4- Clean Breakout .

Gold - The diligent top formation!🏆Gold ( TVC:GOLD ) finished the bullrun:
🔎Analysis summary:
For the past 10 years, Gold has been trading in a very strong expected bullrun. Just like we witnessed it in 2011, a 10 year bullrun is followed by a shorter term bearmarket. Gold is starting to lose its strength, which is a clear sign of weakness and the beginning of a bearish reversal.
📝Levels to watch:
$2.800
SwingTraderPhil
SwingTrading.Simplified. | Investing.Simplified. | #LONGTERMVISION

Bullish Outlook Intact: Gold Targeting 3400-3410Gold encountered resistance and retreated several times on its way to 3400, but it remained above 3370 during the pullback, perfectly maintaining the integrity of its volatile upward trend. Therefore, even though gold's upward momentum has weakened, I still believe that due to structural support, gold still has the potential to reach the 3400-3410 area, and may even continue its bullish trend to the 3420-3430 area.
As gold prices rise, market sentiment tends to be more optimistic, and the price behavior reflected by the candlestick chart becomes clearer. The lows of gold continue to rise, and the highs always insist on setting new highs in the process of rising. The oscillating upward structure is particularly obvious. While greatly limiting the retracement space, it also greatly consolidates the support structure below and is conducive to further rises in gold. At present, gold has been confirmed to have stabilized above 3370, so gold may not give another chance to fall back to the 3360-3350 area.
Then in the next short-term trading, the gold pullback is a buying opportunity. We focus on the opportunity to participate in long gold after gold retreats to 3380-3370. The target will first look at the 3400-3410 area, and the higher target area is in the 3420-3430 area.

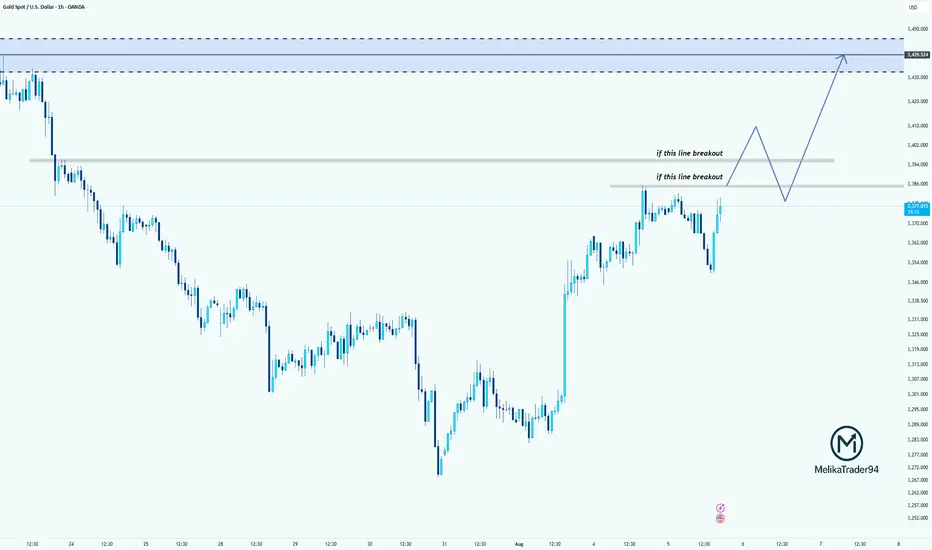
Breakout Levels in Focus for XAUUSDWhy did I say to cancel the last position? because gold is in the critical area!
Price is testing a key resistance area around 3374.
If it breaks above the first resistance level, we may see a bullish continuation toward the second breakout line.
If both levels are broken and retested successfully, the path toward the supply zone at 3430–3440 opens up.
Patience and confirmation are key here!
XAUUSD LONG PositionGold has been ranging for a while now, looking at Mr. America tariff race. We look gold to push Further up with no Compromising area of reversal.

Don’t Blink — Gold Charging Toward 3400!Overnight, we entered a long trade at 3365 and successfully closed the trade by hitting TP: 3395, locking in nearly 300pips of profit. This was a very successful and accurate trading strategy.
Just now, gold became very crazy after rising, and plunged directly from around 3397 to around 3372. It was a very scary and crazy diving action. In fact, I am not worried about it. On the contrary, I am very happy that it provides me with another opportunity to enter the market and go long on gold. I've already entered a long position in gold again, as planned, in the 3375-3365 area.
Regarding the recent plunge in gold, I think it was intended to scare off the long positions that were somewhat loose in their intentions. Although gold has fallen sharply, it is still in a recent volatile upward structure. The volatile upward structure has not been destroyed in the short term, so I believe that gold will not have much room for retracement for the time being under the support of the bullish structure. On the contrary, I believe that after gold touches around 3397, even if it is weak, it will try to hit the 3400 mark, and it is even expected to continue the bullish trend to the 3420-3430 area.
There may be many friends in the market waiting for the opportunity to enter the long market at 3350 or even 3340, but what I want to say is that under the support of the gold bull structure, the downward space has been greatly limited. In the short term, gold may not go to such a low position at all, so relatively speaking, I prefer to go long on gold in the 3375-3365 area, and I have indeed done so!

Only look for BUY signal points in the current trend of Gold✏️The D1 candle closed with strong bullish force at the end of the day. The gold trend is still increasing wave 3 and there is no sign of correction. The reaction around 3385 in the Asian session this morning is being awaited to see if it is a recovery of Gold or not. The BUY strategy at important support zones is still maintained and pay attention to the price reaction of the candle.
📉 Key Levels
Support 3363-3346-3332
Resistance 3385 - 3407
Buy trigger: Confirmation of buying candle at support zones 3363-3346-3333
Target: 3400.00

Correction in Tokyo, London session. And return go up in NewYork✏️Gold prices saw some selling pressure in the Tokyo session. Yesterday's US session saw strong buying pressure, leading to a psychological profit-taking session early today. The possibility of a correction in the Asian and European sessions today and the buying pressure will return in the London session. The SELL signal is triggered at the moment and the Target is aimed at the reaction of buyers at the support areas for the BUY strategy.
📉 Key Levels
SELL now 3375 (Scalping)
BUY trigger: Price rejection at the support areas 3346-3333-3315
Target 3420
Leave your comments on the idea. I am happy to read your views.
Is USDCHF correction over?✏️USDCHF in the medium term is still in an uptrend. After a retest wave of Fibonacci 0.5 some buying pressure was present in the European session today with the confirmation of the H4 candle Full bullish force. The reaction at Fibonacci is also the support zone for break out in the past. This is considered an important point in the structure of the bullish wave. The BUY point is triggered with the expectation that USDCHF will break the peak of last week and head towards higher levels.
📉 Key Levels
BUY now 0.80800 (confirmation of candle at the support zone)
BUY DCA trigger Break the peak 0.816
Target 0.830
Leave your comments on the idea. I am happy to read your views.

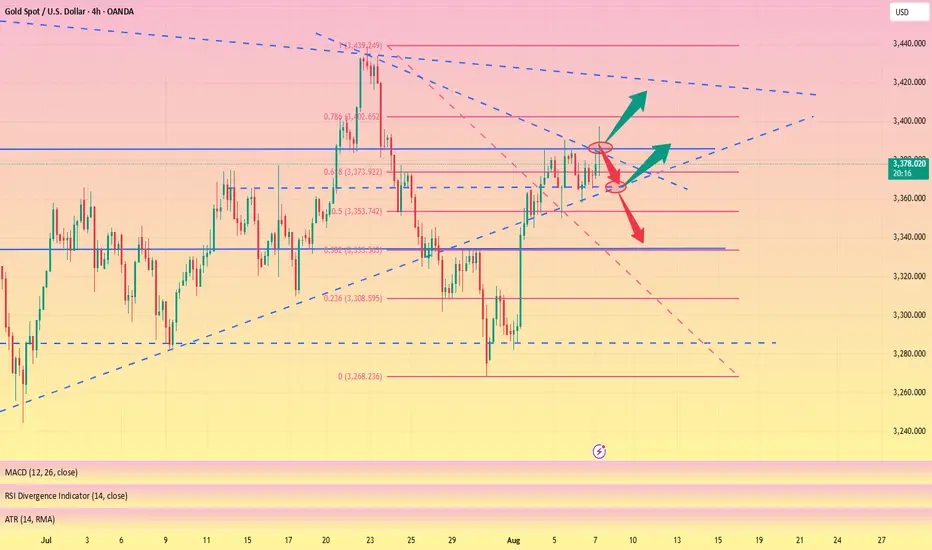
The triangle pattern is about to break through and hit 3400#XAUUSD
Although the price of gold was too high last night due to the rise in risk aversion, the upward momentum weakened significantly in the evening, and it fluctuated sideways at a high level. Gold is currently consolidating within a triangle pattern, with a short-term price increase reaching the triangle's boundary. A break above 3385 could lead to significant intraday gains. Meanwhile, the downside is defending short-term support at 3365. As long as this support level remains intact, the bullish trend remains intact. If the European session gives an opportunity to fall back to the 3375-3365 support area without breaking, you can consider going long and look at 3395-3405, and if it breaks, look at 3415.
Gold (XAUUSD) – 4H Price is currently consolidating near the 3373 level, showing strength above the dynamic support zone and mid-range trend bands. A bullish breakout continuation appears likely, especially if the asset holds the 3360 support zone, which aligns closely with the 38.2% Fibonacci retracement from the recent impulsive move.
Ideal Entry:
Zone: 3360–3365, aligning with a pullback to the Fibonacci 38.2% retracement level and mid-band support.
Invalidation: A clean break and close below 3335 may suggest a deeper retracement or reversal.
🎯 Fibonacci based Targets:
Target 1: 3389 – Immediate resistance and equilibrium level; ideal for partial profit booking.
Target 2: 3422 (38.2% Fib extension) – A stronger extension target in line with the recent highs.
Target 3: 3443 (61.8% Fib extension) – Key swing extension; potential exhaustion or reversal zone.
Stop Loss: Below 3335
As long as price maintains above 3360, the bullish momentum remains valid. Look for bullish candlestick confirmation at entry and increasing volume for confirmation of a move toward the Fibonacci targets.

Gold trading rhythm is perfectly matchedIn the previous strategy, we recommended maintaining a high-selling and buying-low strategy for gold. We accurately predicted the high point near 3397 and arranged short positions near 3395. It then fell steadily to around 3371. Judging from the current gold trend, gold rose and then fell in the European session, touching around 3397, which is exactly the pressure level of the upward channel trend line. The Bollinger Bands in the 4H cycle closed, and the indicators temporarily showed signs of differentiation, but the overall market was resistant to declines at high levels. The current short-term support is around 3375-3370. If it does not break the short-term, it will still be volatile. If it falls below, the strong support of 3360 will be seen. The upper pressure levels are 3385, 3398-3400. In terms of operation, we still maintain a high-altitude, low-multiple short-term strategy. I will give the specific operation ideas at the bottom, remember to pay attention in time!

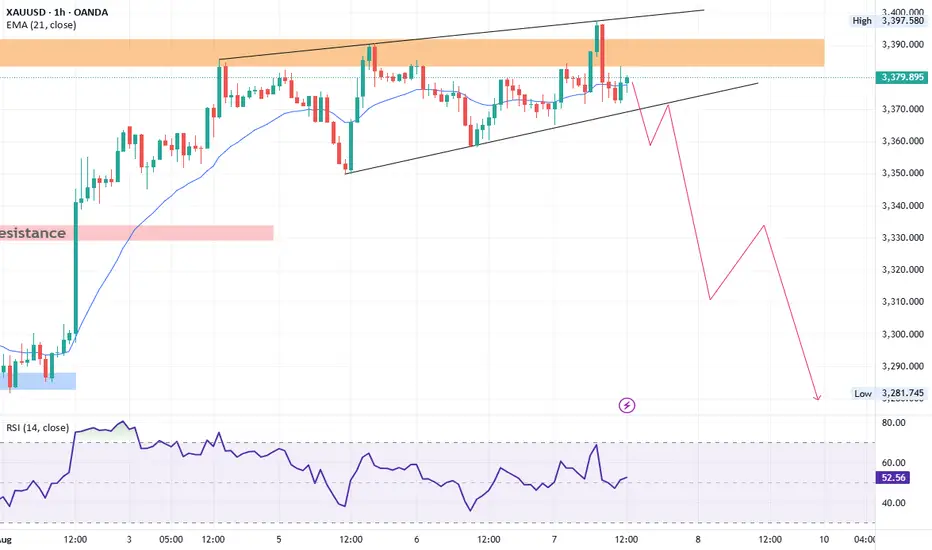
XAUUSD Technical AnalysisGold is currently trading within a rising wedge pattern on the 1-hour chart. The price recently touched the upper trendline of the wedge and faced a strong rejection, indicating bearish pressure. If the price breaks below the lower boundary of the wedge, it will likely trigger a sharp bearish move.
Key downside targets after a confirmed breakdown are:
3340
3300
3270
If Gold drops below 3270, the next significant support lies at 3250 on the daily chart. A daily close below 3250 will confirm a shift in the medium-term trend, opening the path toward the 3000 psychological level.
OANDA:XAUUSD
"Gold Rejected at Resistance – Eyes Set on $3,350 Support"This 45-minute chart of Gold Spot (XAU/USD) highlights a possible bearish reversal pattern. After testing and rejecting resistance around the $3,400 level twice, price action shows signs of weakening bullish momentum. The chart suggests a corrective move is likely, targeting the support zone around $3,350, which aligns with the previous breakout level and horizontal support. Traders should watch for confirmation signals near the resistance before entering short positions. Keep an eye on volume and candlestick patterns to validate the move.🔍 Overview
Current Price: $3,380.32
Timeframe: 45-minute chart
Instrument: Gold Spot (XAU/USD)
Trend: Sideways to bearish bias near resistance
Key Zones:
Resistance: ~$3,400
Support (Target): ~$3,350
Major Support: ~$3,295–$3,300 (prior consolidation low)
---
🧱 Chart Structure & Key Observations
1. Double Top Formation
Price has tested the $3,400 zone twice and failed to break higher.
This creates a potential double top – a bearish reversal pattern.
2. Price Rejection
Long upper wicks near the top suggest strong selling pressure.
The recent move downward signals a shift in sentiment.
3. Bearish Impulse & Projection
The forecasted arrow shows a corrective move toward $3,350.
This level coincides with previous breakout structure and acts as a logical support retest.
