No Bullish Confirmation – Targeting 3250 on XAU/USDIn yesterday’s analysis, I mentioned that due to Monday’s daily Pin Bar, I closed my short trade on Gold around break-even and decided to wait for more confirmation.
Unfortunately, that wasn't the best decision. The price failed to break above resistance for a bullish continuation and instead dropped sharply, closing the day exactly at the 3300 figure. At the time of writing, Gold is trading even lower at 3293, after briefly rebounding from the 3285 support zone—a level I’ve highlighted in the past.
Moving forward, after the failed bullish continuation and yesterday’s bearish move, it’s clear that bears are back in control. A drop toward the 3250 zone is now on the table.
Conclusion: I’m looking to sell rallies, with my invalidation zone set above 3340, aiming for a good risk-to-reward setup.
Disclosure: I am part of TradeNation's Influencer program and receive a monthly fee for using their TradingView charts in my analyses and educational articles.
Xauusdanalysis

Gold Recovery Trade As gold moved around 500 pips on last day. The pull back seems good and this trade's possibility will be good and a good Risk Reward ratio. Keep your risk small if you want to take the trade. This isn't an investment advice this is a probability analysis. Which according to market structure seems good.

Gold (XAUUSD) – July 9 | M15 Bearish Pullback After H4 OB Tap🟡 Gold (XAUUSD) – July 9 Analysis | H4 OB Tapped, M15 Still Bearish
The market has just tapped into the H4 order block near 3280 (3288–3275) — a level we’ve been tracking closely.
However, price action shows that the H4 pullback is still active and not yet complete.
Yesterday, Gold respected the H4 supply zone (3342–3345) exactly as anticipated.
Since then, price broke below the M15 low at 3296 , confirming that bearish momentum remains valid on the lower timeframe.
🔍 Structure Breakdown
• H4: Pullback ongoing
• H4 OB: 3288–3275 (just tapped)
• M15: Broke below 3296 → Bearish trend continuation confirmed
• Current M15 State: In pullback phase
⚠️ Key Consideration:
While we are looking at bearish opportunities, keep in mind that the H4 OB (3288–3275) is a significant demand zone.
If the market begins to reclaim structure and breaks the Lower High(H4 supply zone), this could signal resumption of the H4 uptrend .
Until that happens, we remain cautiously short — but prepared to adapt.
📌 What We’re Watching
Despite the H4 OB tap, M15 remains bearish until proven otherwise.
So the focus stays on short opportunities — no longs unless structure shifts.
📍 Key M15 POI for Rejection:
→ 3322–3326 (Order Block)
→ If price pulls into this zone and gives M1 confirmation (ChoCh + micro BoS)
→ We’ll plan short setups aligned with current trend
If this zone fails, or structure flips bullish, we’ll wait patiently for a potential revisit of the H4 supply zone (3342–3345) — which remains a valid short area for high-probability setups.
🧠 Summary:
✅ H4 OB (3288–3275) tapped
❌ No bullish reversal yet — M15 still bearish
🔍 Watching 3322–3326 for possible short
📉 Bias: Bearish until structure shifts
But be flexible — if LH breaks, the game changes.
📖 Respect the structure.
The chart doesn’t reverse because you want it to —
It reverses when the market is done moving the other way.
📘 Shared by @ChartIsMirror

Follow up before the Fed minutesGold, the price fell from the historical high of 3500 to 3120 in the first round this year, and is now in the second round of downward cycle after rising to 3452. The mid-term top idea is maintained, and the operating target is 3120; after bottoming out and rebounding to 3345 on Monday, it did not continue on Tuesday, and fell to 3287 in a weak position; the daily chart recorded a real big Yin, and the K-line combination was short-term, and the bearish trend continued during the day, and attention was paid to the impact of the Federal Reserve's monetary policy minutes on Thursday morning;
Opening at 3301, short-term resistance at 3308-3310 during the Asian session, strong resistance at 3315 and daily chart MA5-3320, the limit rebound is not more than here; short-term support at 3293, strong support at 3287, and the previous parallel low at 3247 is expected to be seen if it breaks;

Gold Wants to Go lowerSee my previous analysis for gold I described I will take the low and has taken already. now the daily candle shown good sell. today there are two possibilities. Either gold will have pullback or will go further in sell. I have given both possibilities in my analysis.
For Pull Back: It may take the previous day low and then retraces back to 4 hour FVG or to the order block residing at 3324.
For Further sell : It may pull back to 4 hour FVG and then goes back to take previous day low.

7/9: Failure to Break Above 3321 May Lead to a Drop Toward 3220Good morning, everyone!
Yesterday, gold tested support and attempted a rebound but failed to break through resistance, followed by a second leg down that broke the support zone, invalidating the potential inverse head-and-shoulders pattern and resulting in a drop below the 3300 level.
On the daily (1D) chart, price has now broken below the MA60, signaling a further confirmation of the bearish structure.
However, due to the sharp drop, a double bottom or multi-bottom structure is forming on the 30-minute chart, which may be building momentum for a potential test of the 3321 resistance zone.
📌 Key focus areas:
If 3321 is broken and held, there is room for a short-term rebound to extend;
If 3321 holds as resistance, the current rebound is likely a short-selling opportunity.
Technically speaking, without the support of bullish news, if gold fails to reclaim and sustain above 3321, there is a strong chance of a further move lower—potentially down to 3220, where the weekly MA20 is located. A deeper decline could even test the 3200–3168 support zone.
📉 Therefore, the primary trading bias remains bearish, with sell-on-rebound as the preferred strategy until a stronger bullish signal emerges. Monitor the 3321 zone closely for direction confirmation.

Will gold continue to rise if it accelerates its decline?Technically, we need to focus on the key support of 3260 and the strong resistance range of 3320 above. The hourly chart shows that the short-term moving average diverges downward, and the K-line is under pressure, showing short-term fatigue, suggesting that there is still a need for a correction. The current long-short watershed is at the 3390 mark. If the gold price cannot effectively break through and stand above 3315, the short-term rebound can be regarded as a good opportunity to enter a short position. The 4-hour chart shows that the gold price has received support after touching 3287 and slowly repaired the decline, but it is still in a volatile pattern in the near future. Although the 3287 support is effective, the oscillation range has not been broken. The future direction needs to pay attention to the actual defense strength of the 3260 support level and the direction of the range break. The operation suggestion on Wednesday is to rebound high as the dominant strategy. The upper resistance area focuses on the 3315-3320 range, where short positions can be arranged. The downward targets are 3270 and the key support level 3260. If 3260 is effectively broken, it may open up a larger downward space.

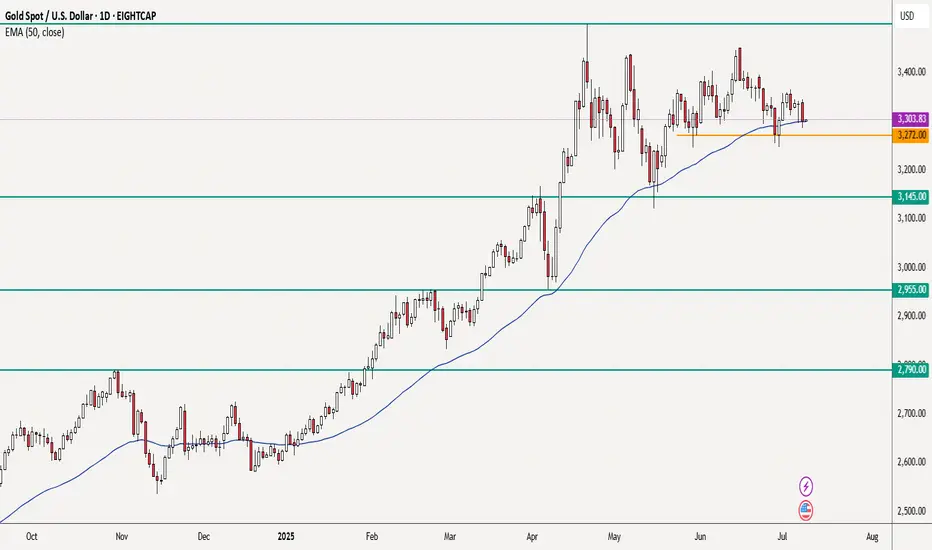
Gold - Time to short XAUUSDIt may be difficult to have a bearish bias on gold, but the chart is saying sell!
After a prolonged bull run, you can see how price got rejected at $3,500. Subsequent bullish moves became weaker and weaker, you may even see a H&S pattern but more importantly the latest weaker bounce seems to indicate that the local support at 3272 may soon break.
If this plays out as I think, a nice trade will setup. I also took a quick look at the H1 chart and noted that we already have lower daily central pivots. Looking forward to see how PA in the next couple of days develops.
This is not a trade recommendation; it’s merely my own analysis. Trading carries a high level of risk so carefully managing your capital and risk is important. If you like my idea, please give a “boost” and follow me to get even more.
XAUUSD 4H – Smart Money Concept (SMC) SetupPrice action on the 4H chart shows a confirmed Change of Character (CHoCH) at the 3,320 level, marking a shift from a bearish trend into potential bullish order flow. This CHoCH is supported by a strong break of internal structure followed by a pullback.
🧠 Smart Money Insight:
CHoCH Zone (Break of Structure): Price broke the previous lower high, confirming possible bullish intent.
POI (Point of Interest): A refined 4H demand zone sits between 3,280–3,310, aligning with a previous accumulation area. Price is currently approaching this zone with decreasing momentum (potential liquidity sweep below minor lows).
Liquidity Grab: Several equal lows were formed before the POI — prime setup for a liquidity sweep before a bullish push.
Refined Entry Zone: Based on candle wicks and order block imbalance.
🎯 Trade Idea:
🟢 Entry: Wait for bullish reaction or confirmation inside the POI zone (3,295–3,305)
🎯 Target Zones:
TP1: 3,380 (reaction level)
TP2: 3,420–3,440 (major supply zone + inefficiency)
🛡️ Stop Loss: Below 3,270 (invalidates demand zone and structure)
📈 Bias: Bullish unless POI fails
🔍 Confluences:
✅ 4H CHoCH Confirmed
✅ Price approaching refined demand zone
✅ Liquidity resting below recent lows
✅ Previous imbalance not yet filled
✅ Clean supply zone overhead (TP target)
💬 Conclusion:
This is a clean SMC-based long setup. We are waiting for price to tap into demand and show bullish intent before entry. Strong probability of reversal into premium pricing zone if structure holds.
📍Drop a like if you caught this setup or save it to monitor the reaction!

XAU/USD Analysis – Expecting Fibonacci Retracement to 0.618 I’m currently anticipating a short-term retracement in XAU/USD towards the 0.618 Fibonacci level around 3323, followed by a continuation of the bearish move targeting a Fair Value Gap (FVG) around 3272.
📌 Technical Confluence:
The market has recently shown a strong bearish impulse, and the current price action appears to be forming a corrective retracement.
The 0.618 retracement level aligns with a key resistance area around 3323, increasing the probability of a bearish reaction from this zone.
There’s a visible FVG left unfilled near 3272, which may act as a price magnet.
I’m also watching for a liquidity sweep above local highs, followed by bearish confirmation on the lower timeframes (e.g., 5min) to trigger a short entry.
📉 Trade Idea:
Looking for a sell entry near 3323 after confirmation (liquidity grab, bearish structure shift, etc.)
Target: 3272 FVG zone
Stop Loss: Just above recent highs or liquidity zone, depending on intraday structure

The intraday low has already appeared, so go long on gold boldlyGold unexpectedly fell sharply to around 3287. To be honest, the short position is relatively strong. However, since gold fell below 3000, we can clearly see that gold has shown strong resistance to falling during the decline, and the volatility tends to converge around 3287, proving that the buying support below is strong; and as gold continues to retreat, the off-market wait-and-see funds will be more willing to go long on gold; and some short positions will be more willing to go long on gold after profit taking;
In addition, although the short position is strong, it is difficult to continue in the short term. The intraday decline is basically in place. It is estimated that 3287 is the intraday low, so at this stage, it is inconvenient for us to continue to chase short gold. On the contrary, we can boldly go long on gold in the 3305-3295 area and look at the target area: 3320-3330.

7/8: Inverse Head and Shoulders Pattern, Support at 3321–3312Good morning, everyone!
Yesterday, gold broke below the 3321 support during the session, dropped to around 3296, then staged a strong rebound back toward the opening price—forming a classic deep V-shaped reversal and regaining support above the MA60 on the daily chart.
The market remains in a consolidation phase between the MA20 and MA60 on the 1D chart, with no clear directional breakout yet.
On the 30-minute chart, the previous head-and-shoulders top pattern has been completed with the recent decline. The current structure can be tentatively viewed as the formation of a head-and-shoulders bottom.
If this bullish reversal pattern holds:
The 3321 level must act as valid support during any pullback; deeper confirmation may come from 3312, which corresponds to the previous left shoulder low. Although this was partially driven by a data-related spike, most candle bodies remained around 3321—so 3321 is the primary support, and 3312 is the backup.
If confirmed, the price may advance toward the 3360 target zone.
If the pattern fails, watch for the development of a double bottom formation, with MA60 on the daily chart remaining a key support level.
📌 For today, focus on trading within the 3312–3352 range, using a buy-low/sell-high approach, and stay flexible in response to evolving chart patterns.

XAUUSD 15M Smart Money Sell SetupGold is showing classic Smart Money Concepts (SMC) behavior with liquidity engineering and premium mitigation.
🧠 SMC Breakdown:
Price swept buy-side liquidity above 3,355 and failed to close above the zone.
Supply zone (red) at 3,350–3,360 was previously unmitigated and now tapped.
Clean mitigation candle formed inside the supply with a sharp rejection.
Sell pressure expected from institutions looking to fill short positions after engineered liquidity.
📌 Sell Idea:
We anticipate a bearish reaction from the 3,350–3,360 zone down to the demand area.
🎯 Trade Plan:
📍 Entry Zone: 3,350–3,360 (inside red supply zone)
🛑 SL: 3,365 (above the liquidity wick)
✅ TP: 3,300 zone (green demand block)
📊 Why This Trade?
Structure is bearish from higher timeframes.
This is a sell in premium after liquidity sweep.
Imbalance left behind during the move up still unfilled.
Expecting internal CHoCH on M1/M5 to confirm entry.
🧲 Liquidity Map:
Engineered highs above 3,355 swept.
Clean equal lows sitting at 3,300 – perfect magnet for price.
⚠️ Note: Patience is key. Let price come into your zone and show a reaction before entering.
#XAUUSD #SmartMoneyConcepts #SupplyAndDemand #GoldSellSetup #SMC #TradingView #InstitutionalTrading #LiquiditySweep #PriceAction #Forex

XAUUSD:Sharing of the Latest Trading StrategyAll the trading signals this week have resulted in profits!!! Check it!!!👉👉👉
Gold Market Analysis:
Overnight Dynamics: Following Trump’s reinstatement of tariffs, gold’s safe-haven demand drove another rally, but it still pulled back after facing pressure at the 3345 level. The decline extended today, requiring attention to the sustainability of safe-haven flows—recently, safe-haven-driven rallies have often been followed by pullbacks, so caution remains warranted for further gold corrections.
Technical Trends:
On the daily chart, gold continues to trade in a narrow range, with short-term moving averages essentially converging and flattening, suggesting a high probability of continued sideways movement in the near term.
The current range is temporarily compressed between 3285–3345, with the market bias leaning toward a "range-bound bearish" trend.
Trading Bias: Maintain a bearish stance on rebounds!
Trading Strategy:
Sell@3330-3320
TP:3300-3280

XAUUSD h4 buying target levelsGOLD (XAU/USD) - 4H Analysis
Price is currently reacting from a well-defined support zone (demand area) near $3,250–3,270, which previously acted as strong resistance and now flipped to support.
🔍 I'm watching for bullish confirmation from this zone for a potential upward move toward the next resistance levels.
🎯 Targets:
Target 1: $3,400 (First key resistance)
Target 2: $3,460 (Major resistance & previous high)
📉 If price fails to hold above the support area, this setup will be invalidated. Risk management is key.
This idea is based on structure breakout and price respecting previous resistance turned support zone.
📊 Levels:
Support (Entry Area): $3,250 – $3,270
Target 1: $3,400
Target 2: $3,460
Invalidation Below: $3,240
#GOLD #XAUUSD #PriceAction #TradingSetup #BuySetup #4HChart #ForYou #BreakoutTrade #SmartMoney #ForexAnalysis #LiquidityGrab
CAPITALCOM:GOLD

Short-term gold bulls and bears are anxious,3330 becomes the keyAt present, the market has been fluctuating narrowly in the range of 3330-3320, and both bulls and bears are in a stalemate. However, gold has formed a double-layer head and shoulders bottom pattern, so the short-term bullish trend is definitely unchanged. In the previous post, I also mentioned that if the rebound in the European session is weak and gold continues to be below 3345, then the short-term NY session may usher in a retracement and a second bottom. Therefore, I still hold a long order of 3325-3315, and temporarily modify the TP to the 3335 line. I expect that there may be a retracement here, but there may also be a direct retracement. No matter what the situation is, we need to stabilize before entering the market.
In addition to investment, life also includes poetry, distant places, and Allen. Facing the market is actually facing yourself, correcting your shortcomings, facing your mistakes, and exercising strict self-discipline. I share free trading strategies and analysis ideas every day for reference by brothers. I hope my analysis can help you.
PEPPERSTONE:XAUUSD FOREXCOM:XAUUSD FX:XAUUSD FXOPEN:XAUUSD OANDA:XAUUSD TVC:GOLD

How to solve the problem of order being trapped in a loop📊 Gold Day Trading Strategy (Recommendation index ⭐️⭐️⭐️⭐️⭐️)
📰 News information:
1. The lasting impact of new tariffs
2. The impact of geopolitical conflicts
3. The Fed’s interest rate cut
📈 Technical Analysis:
The recent market conditions have been volatile. Many brothers have reported that they have been trapped recently. They have just been released from short positions, but have fallen into the situation of being trapped by long orders again. I have also encountered such a situation recently. Brothers who follow me must know that I have been trapped, but in the process of being trapped, I still share my trading ideas for the brothers who are trapped to check, so that we can all get out of the trap.
Gold fell as expected and hit the lowest point of 3287 before rebounding. The current 3300-3290 range given at the bottom has certain support. At present, I have answered it. As long as it does not fall below 3285, we can still go long and look for rebound correction. TP can temporarily look at 3305-3310. At present, the short-term upper watershed is near the 3321 line. As time goes by, the medium-term point can be seen at 3345. Only when the price stands above 3345 can the upward momentum continue to touch the 3380 line, or even 3400. In the short term, you can go long if you look at the support below. In the short term, pay attention to the resistance above 3315-3320. If it encounters resistance under pressure, it will fall back. On the contrary, after breaking through the first level of resistance, the upward trend will continue.
🎯 Trading Points:
BUY 3300-3290-3285
TP 3305-3315-3320-3345
SELL 3315-3321
TP 3300-3290
In addition to investment, life also includes poetry, distant places, and Allen. Facing the market is actually facing yourself, correcting your shortcomings, facing your mistakes, and exercising strict self-discipline. I share free trading strategies and analysis ideas every day for reference by brothers. I hope my analysis can help you.
TVC:GOLD OANDA:XAUUSD FXOPEN:XAUUSD FX:XAUUSD FOREXCOM:XAUUSD PEPPERSTONE:XAUUSD
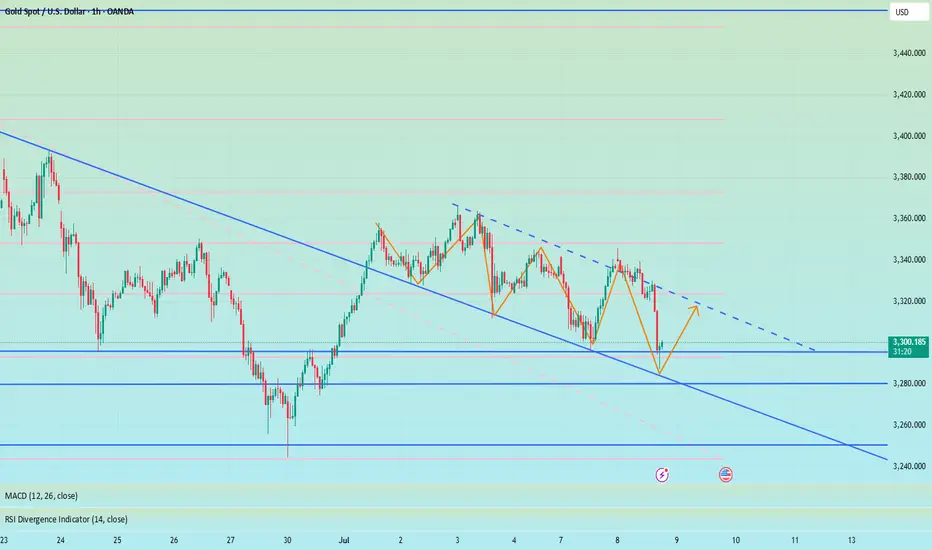
Gold is going down without any signs. Will it continue?Yesterday's seemingly strong rise in gold's safe-haven market may make people mistakenly think that gold is going to rise sharply, but the recent safe-haven market has poor sustainability and poor upward momentum, and cannot maintain the continuation of the upward trend.
Looking at gold in 1 hour, after the price surged, it continued to fall under pressure at 3345. 3345 is also the recent key position for long and short positions. The 1-hour moving average of gold is still in a short position and continues to diverge downward. The short-term short momentum of gold still exists. I think the price will still fall after the rebound. Gold started to fall directly at 3330, and 3330 formed a strong resistance for gold in the short term. The downward low point did not continue after touching 3288. The current price rebounded and fluctuated around 3295. So we can sell high and buy low around 3385-3325.
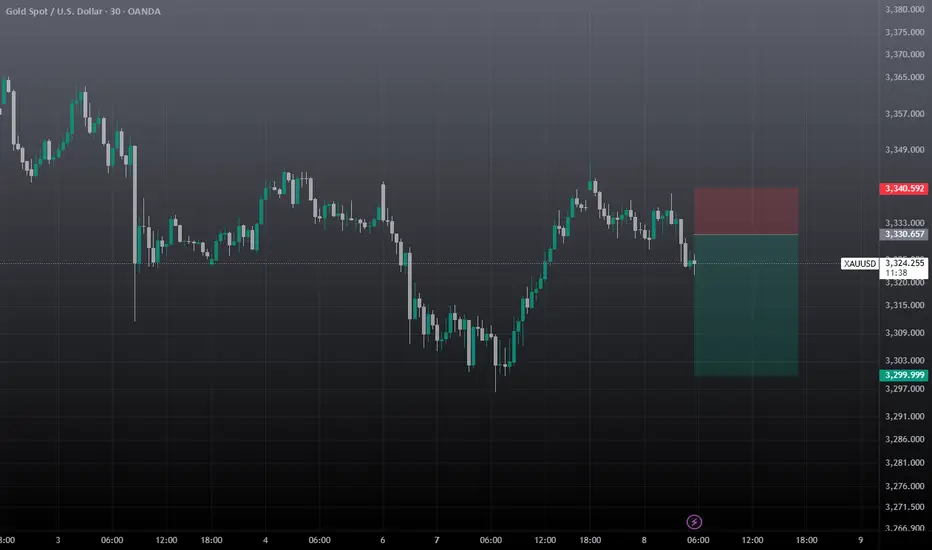
Gold Setup Expected Move📈 Bullish Scenario (Upside Move)
✅ Conditions:
Price holds above $3,327 support
EMA50 acts as dynamic support
RSI stays above 50
MACD shows bullish crossover
🔼 Targets:
TP1: $3,342 (Resistance 1)
TP2: $3,360 (Resistance 2)
Potential Breakout Zone: Above $3,360 could open path to $3,375+
🔒 Invalidation:
Bullish bias invalid if price breaks below $3,327 and EMA50
📉 Bearish Scenario (Downside Move)
✅ Conditions:
Price breaks below $3,327 support
EMA50 is broken to the downside
RSI drops below 45–40
MACD shows bearish crossover or negative histogram
🔽 Targets:
TP1: $3,308 (Support 2)
TP2: $3,295–$3,285 (next demand zone
🔒 Invalidation:
Bearish bias invalid if price reclaims above $3,335–$3,342 quickly with volume
🧭 Summary Table
Scenario Trigger Target(s) Invalidation
Bullish Holds above $3,327, EMA50 support $3,342 → $3,360+ Break below $3,327
Bearish Breaks below $3,327 + EMA50 fails $3,308 → $3,295 Regain above $3,342

XAUUSD Short / Sell Setupwait for the entry and place tp & SL, must use SL, never exceed more than 2% on SL of your portfolio on any trade. If tp is achieved first then trade setup will be invalid.
Gold price this afternoon (July 8)Given the definition of the gold price trend, market participants remain anxious and oriented to signs of the US Federal Reserve’s stance on monetary tightening, which could shape the future course of gold prices.
As the US dollar gains traction, it is also a difficult time for gold. But if the tariff war accelerates, gold will rise, especially as fears of annihilation and trade wars increase.
🔴 XAUUSD BUY 3295 3293 🔴
✅TP1: 3310
✅TP2: 3320
✅TP3: OPEN
🚫 SL:3289
🔴 XAUUSD SELL 3308 3306 🔴
✅TP1: 3300
✅TP2: 3290
✅TP3: OPEN
🚫 SL:3313

Gold Price Setup: Bullish Continuation or Rejection? 🧠 Chart Analysis (XAU/USD – 1H):
Key Structure Highlights:
CHoCH (Change of Character) zones marked both up and down indicate a battle between bulls and bears.
Recent bullish CHoCH followed by a fair value gap (FVG) retest suggests potential continuation to the upside.
Price recently bounced strongly from demand zone, shown by the green arrows and strong candle reaction.
Ichimoku Cloud:
Price is trying to break back above the Kumo (cloud), a sign of bullish momentum building.
However, resistance is still present with the Kijun and Tenkan lines converging.
FVG (Fair Value Gap):
The current price is attempting to fill and break above the FVG zone.
A successful breakout above this area confirms bullish intention.
Fibonacci Levels:
Price is hovering around the 0.5 - 0.618 retracement zone, often a strong reversal or continuation point.
Upside targets lie near the 0.786 retracement (3352) and ultimate target at 3391, a major resistance level.
Risk Management:
Trade setup shows an excellent Risk:Reward ratio.
Stop-loss placed just below the last structure low.
Potential downside to 3290–3258 if breakout fails.
🟢 Possible Next Move:
Bullish Scenario: If price clears the FVG and breaks above 3353, expect continuation to 3391.
Bearish Rejection: If rejected at FVG/0.618 level, watch for a drop back to 3290 or even 3259.

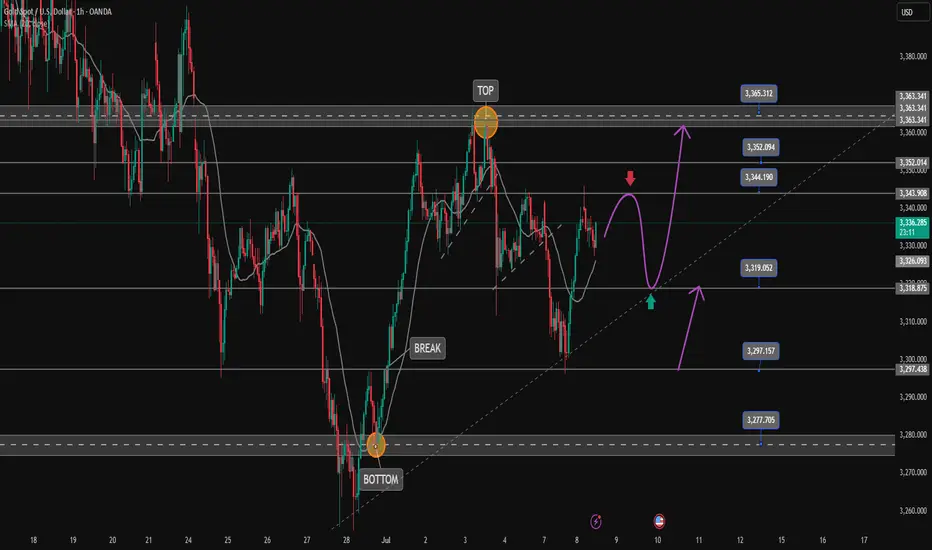
Gold is bullish and needs more momentum at 3320The buying pressure in the US session pushed the price up and formed a bullish hammer candle on D1. Today's bearish recovery is seen as a buying opportunity to head towards the uptrend again.
3344 is the immediate resistance zone in the European session that Gold faces. Breaking this resistance zone will head towards 3365. According to the wave structure, it would be great to have a retest of 3320 to find some buying momentum and then break 3344.
SUPPORT: 3320-3297
RESISTANCE: 3345-3352-3365
SELL Trigger: Break 3320 ( Trendline & break zone)
Do you have any comments on the trading plan? I would love to hear your views.