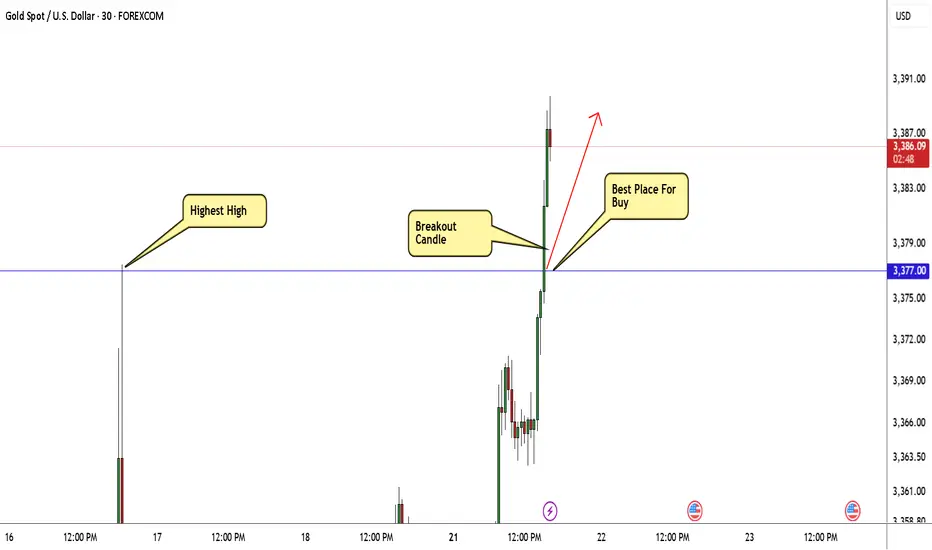
GOLD Breakout Done , Long Setup Valid To Get 200 Pips !Here is My 30 Mins Gold Chart , and here is my opinion , we finally above 3377.00 and we have a 30 Mins Candle closure above this strong res , so i`m waiting the price to go back and retest this res and new support and give me a good bullish price action to can enter a buy trade and we can targeting 200 pips , and if we have a 4H Closure Above This res this will increase the reasons for buyers , just wait the price to back a little to retest it and then we can buy it . if we have a daily closure below it this idea will not be valid anymore .
Xauusdanalysis
QUIET START TO THE WEEK, WATCH OUT FOR KEY RESISTANCE!🔔 GOLD PLAN 21/07 – QUIET START TO THE WEEK, WATCH OUT FOR KEY RESISTANCE!
🌍 Market Overview
Gold has bounced back strongly following a brief pullback late last week. The move comes as geopolitical tensions and global conflicts continue to escalate.
While this week may not feature high-impact economic data, macroeconomic risks and global uncertainty remain the primary drivers of price action.
📊 Technical Outlook
Price is currently approaching a strong resistance zone between 3377–3380, which aligns with a Buy Side Liquidity region.
💡 Sellers may step in here to push the price lower, aiming to fill FVG zones (Fair Value Gaps) left behind during the previous bullish rally.
⚠️ Entering SELL positions at this level is risky — only act upon confirmed reversal signals (candlestick rejection or volume-based confirmation).
🎯 Trade Setup
🟢 BUY ZONE: 3331 – 3329
Stop Loss: 3325
Take Profits:
3335 → 3340 → 3344 → 3348 → 3352 → 3358 → 3364 → 3370
🔴 SELL ZONE (confirmation required): 3377 – 3379
Stop Loss: 3383
Take Profits:
3372 → 3368 → 3364 → 3360 → 3350
📌 Key Notes
The 3347 zone acts as short-term support for bulls. If this level breaks, a move toward lower FVG liquidity zones becomes more likely.
Keep an eye on EU session volume for clearer short-term direction and better trade timing.
✅ Final Thoughts
Discipline is key. Stick to your TP/SL strategy to manage risk effectively during early-week volatility.
🛡️ Wishing everyone a successful start to the week. Stay patient, stay focused.
GOD BLESS ALL!
Gold Spot / U.S. Dollar (XAU/USD) 4-Hour Chart - OANDA4-hour chart displays the price movement of Gold Spot (XAU) against the U.S. Dollar (USD) from late July to early August 2025. The current price is 3,390.266, with a recent decrease of 10.870 (-0.32%). Key levels include a sell price of 3,336.420 and a buy price of 3,337.020, with a resistance zone highlighted between 3,340.720 and 3,380.000, and a support zone around 3,314.186. The chart includes candlestick patterns and trading indicators.

Gold Outlook – The Range Holds, Direction Still Pending📆 What happened recently?
Since the middle of last week, I’ve been repeating the same core idea like a broken record:
👉 “Gold needs to break out of the range to define its next real move.”
And once again, on Friday, TRADENATION:XAUUSD respected the structure, fluctuating quietly and closing the week right in the middle of the range — no breakout, no confirmation.
📈 Current status:
The new week opened with some bullish interest, and at the time of writing, Gold trades around 3363. Still inside the box.
So far, no technical change, and certainly no resolution.
❓ What am I watching for?
A clear break above 3375 → confirms bullish continuation
A decisive break below 3320 → confirms reversal potential
Until then, everything in between is noise and chop.
🧭 Trading plan:
My stance remains unchanged:
⏳ No position. No bias. Just waiting.
Once we get confirmation in either direction, I’ll take action.
📌 Conclusion:
Gold is still locked inside the range. The market is coiling, but no side is winning yet.
Patience here is a weapon — and I’m keeping it loaded. 🚀
Disclosure: I am part of TradeNation's Influencer program and receive a monthly fee for using their TradingView charts in my analyses and educational articles.
Gold is waiting for a pullback to break through 3400In the short term, gold is stuck in a sideways trend near 3365. It is not recommended to enter this point regardless of long or short positions. It is expected that there will be certain variables in the NY period. If gold retreats and falls in the short term as we expect, it may first touch around 3361. If it falls below 3361, it is expected to touch around 3353, which is also the point I gave this morning to see support.
Judging from the market, our focus on the upper side is still the 3375-3385 resistance area. If it can be effectively broken through, it is expected to hit the 3400-3420 mark. Although the daily MACD is oscillating near the zero axis, the 4H market shows that the oscillation is strong. Our trading strategy remains unchanged in the short term. The pullback in the NY period provides an opportunity, and we can consider going long. If there is new news during the day that requires adjustment, I will notify you immediately. Bros, please be patient and wait for trading opportunities.
OANDA:XAUUSD

gold on sell#XAUUSD sell at 3362, the candle is rejecting on bullish which will make retracment on the price.
Entry below 3362 on H1 or M15 closure. Target 3344, stop loss 3372.
Bullish can break following longer candle closure on H1.

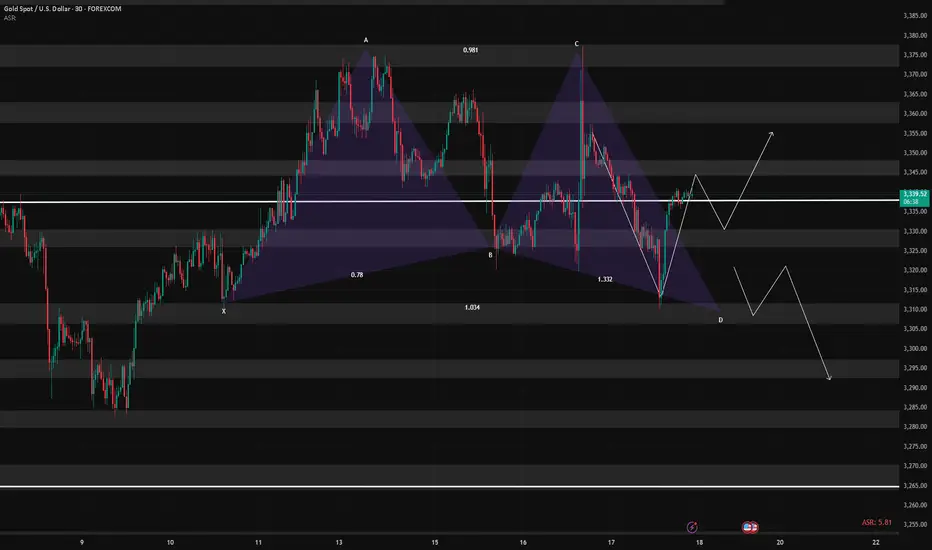
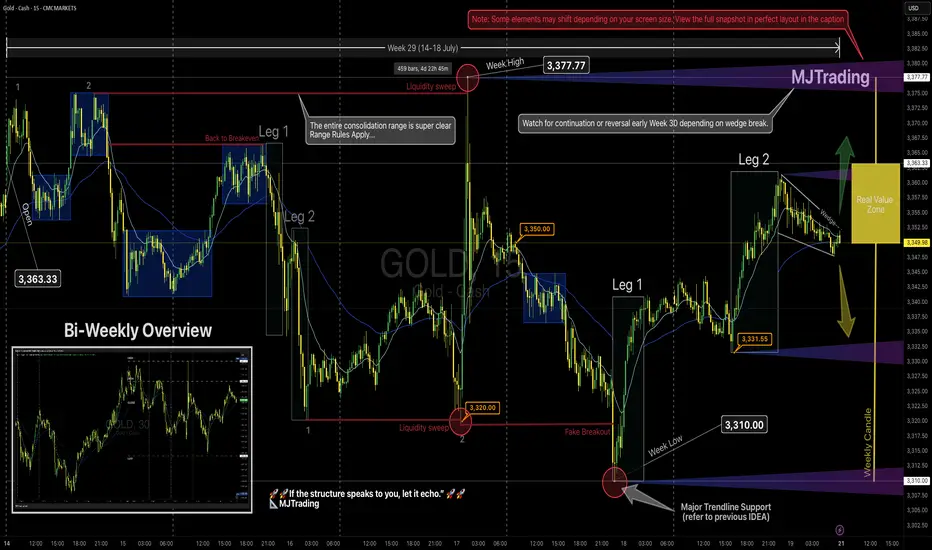
GOLD Weekly Recap (Week 29) – MJTrading View📸 Viewing Tip:
🛠️ Some layout elements may shift depending on your screen size.
🔗 View the fixed high-resolution chart here:
Now that you have got the perfect layout let's dive in...
📈 GOLD Weekly Recap (Week 29) – MJTrading View
🕰 Timeframe: 15min chart with bi-weekly perspective
📅 Period Covered: July 14–18 (Week 29)
🎯 Visual Framework: Leg structure, range boundaries, liquidity sweeps, trendline holds, and Real Value Zone.
🔹 Weekly Summary
Open: 3,363.33
High: 3,377.77 (🔴 sweep: trapped buyers)
Low: 3,310.00 (🔴 sweep into key demand + touching the main ascending trendline )
Close: 3,349.98~3350 (lovely round level)
Structure: Entire week played inside a broad consolidation range, with sharp but failed breakouts on both extremes.
Range rules applied: traps, sweeps, compression — everything aligned for responsive trading.
📌 Key Observations
Early Week:
A double-top structure led to rejection from ~3,375 → slid into 3,350.
Price returned to breakeven but then flushed hard toward 3,320 via a clean 2-leg drop.
Midweek:
After forming a double bottom, price created a tiny liquidity sweep, then exploded to the weekly high.
The move above 3,377.77 was a textbook liquidity grab, immediately rejected.
This led to a slide toward the weekly low, tagging both the trendline and consolidation floor — forming a false breakout + reversal.
Late Week:
The low at 3,310 was swept cleanly (🔴), followed by a leg-based reversal:
Leg 1: Up to 3,331
Leg 2: Extended to ~3,360 before fading back inside the range.
Compression:
Price closed inside the Real Value Zone (weekly candle body) — just under the open, forming a tight wedge, hinting at breakout conditions for Week 30.
🟨 Weekly Candle Body
Open → Close of weekly candle reflects Real Value Zone .
Highs and lows were swept, but real commitment stayed within the body.
🧭 Key Levels to Watch – Week 30
Level Role
3,377.77 Weekly High / Liquidity Sweep (🔴 rejection)
3,363.33 Weekly Open (break & hold = bullish bias) / Previous Weekly High
3,350.00 Micro resistance / Mid-structure cap / Round Level
3,331-3 Leg 2 low & first reaction zone / Round Level
3,320.00 Breakdown support / Flush origin
3,310.00 Weekly Low / Major Demand (🔴 sweep)
3,400.00 Next possible main target
3,282.00 Previous Weekly Low
Dynamics: Both Uptrend and Downtrend Lines...
🧠 MJTrading Notes
Bias remains neutral inside the range.
A break & acceptance above 3,363 could trigger a re-test of the sweep zone (3,377+).
A breakdown below 3,331 puts 3,320 → 3,310 back on the map then 3,282.
Don’t force direction — let expansion confirm itself.
🧭 “If the structure speaks to you, let it echo.”
– MJTrading 🚀
#MJTrading #ChartDesigner #GOLD #LiquiditySweep #PriceAction #StructureTrading #Weekly #Chart #Consolidation #2legs
🧠 Psychology always matters:
GBPAUD's wide trading range remains intact✏️GBPAUD is trading in a wide range. After the increase on Friday, the pair is retesting the support zone breaking past resistance. And the current reaction point also coincides with the 20 SMA. There is not much momentum for the pair to break out of the wide trading range, so buying the pair to the upper range of 2.097 is a reasonable choice at the moment.
📉 Key Levels
Support: 2.058
Resistance: 2.083-2.096
BUY Trigger: Confirmed bounce from 2.059 (EMA support)
Target 2.09600
BUY DCA Trigger: Break 2.083
Leave your comments on the idea. I am happy to read your views.

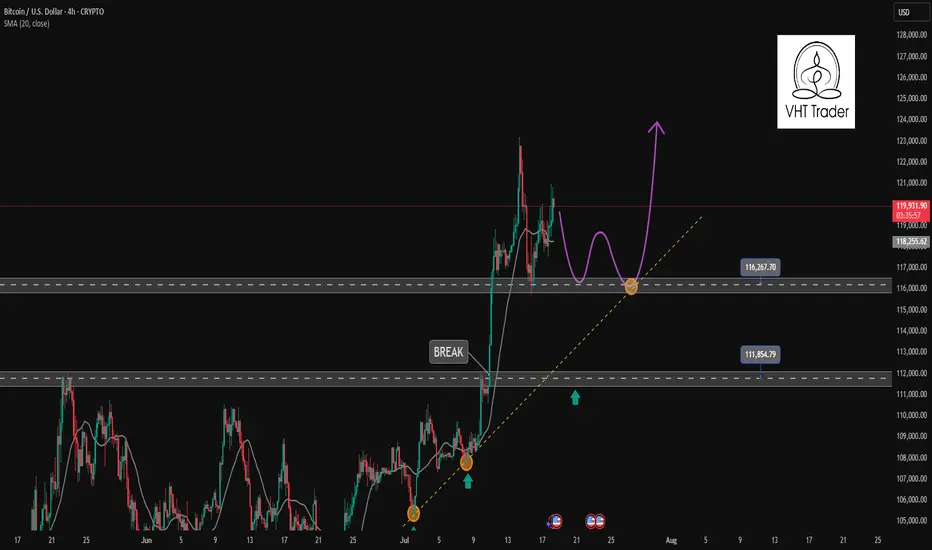
Find a recovery point to continue buying BTC✏️ CRYPTO:BTCUSD is trading near the all-time high. The trading strategy is to wait for some investors to take profit so that the price can return to the nearest support zones and continue to buy to the new all-time high zones.
📉 Key Levels
BUY Trigger: confirms the recovery from the support trend line 116000
BUY zone 112000 (Strong support zone)
Target 129000
Leave your comments on the idea. I am happy to read your views.
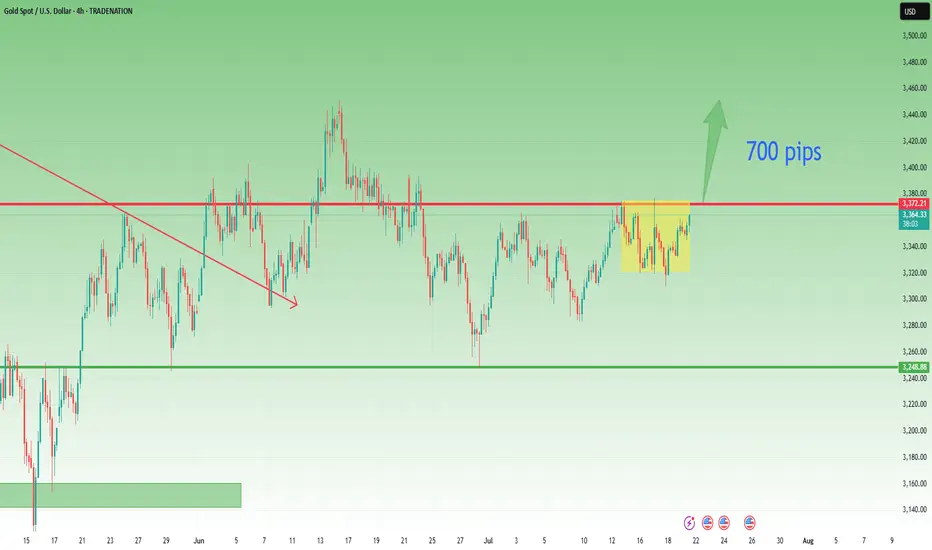
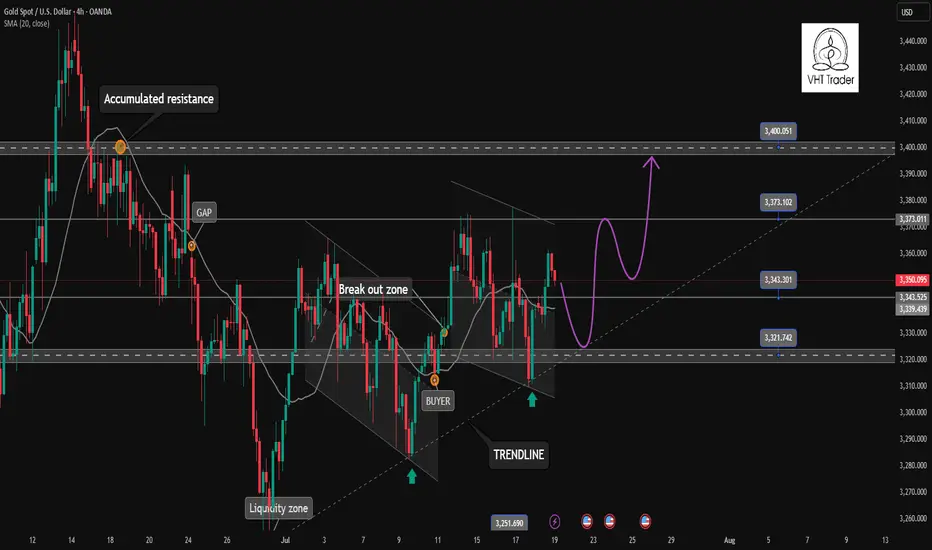
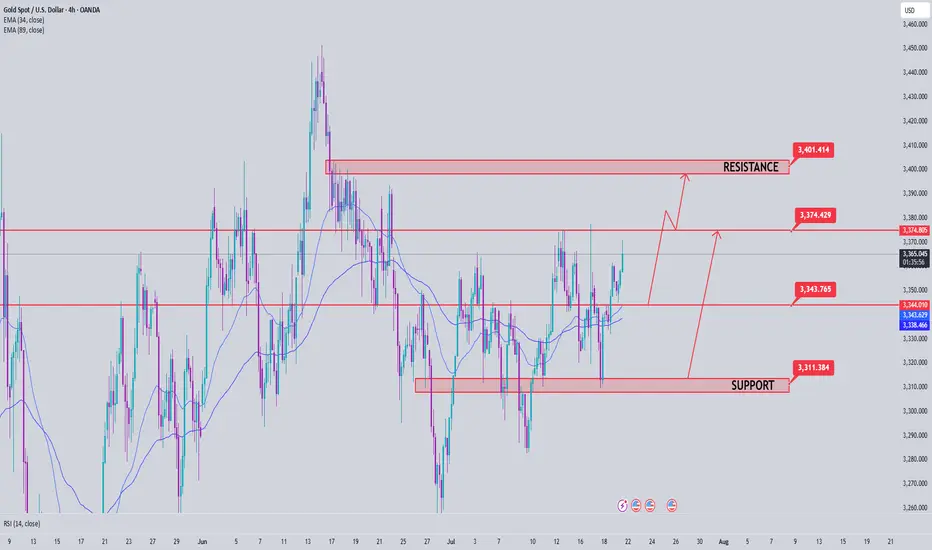
Gold returns to its original nature. Price increase towards 3400✏️ OANDA:XAUUSD is back to its inherent uptrend. Currently trading in a wide range. Shaped by CPI news last week. Trendline is still supporting Gold price towards 3400 next week. Pay attention to the important zone 3373 to DCA BUY and do not SELL when breaking this important zone 3373. Effective trading strategy is to wait for Gold to correct and buy.
📉 Key Levels
Support: 3343 - 3322
Resistance: 3373-3400
Buy Trigger: Rejects the support zone 3343 and reacts to the upside
Buy Trigger: Rebound from 3322
Target 3400
Leave your comments on the idea. I am happy to read your views.
XAUUSD SELL OR TRAP (READ CAPTION)Hi trader's. what do you think about gold
current price: 3331
gold is working in bullish Parrallal channel under gold retest is down side 3320 and 3307 this is support market respect this zone and reject support and and h1 candle close in bullish so possible gold pump upside
support zone: 3320:3307
resistance zone :3345
supply 3374
please like comment and follow thank you

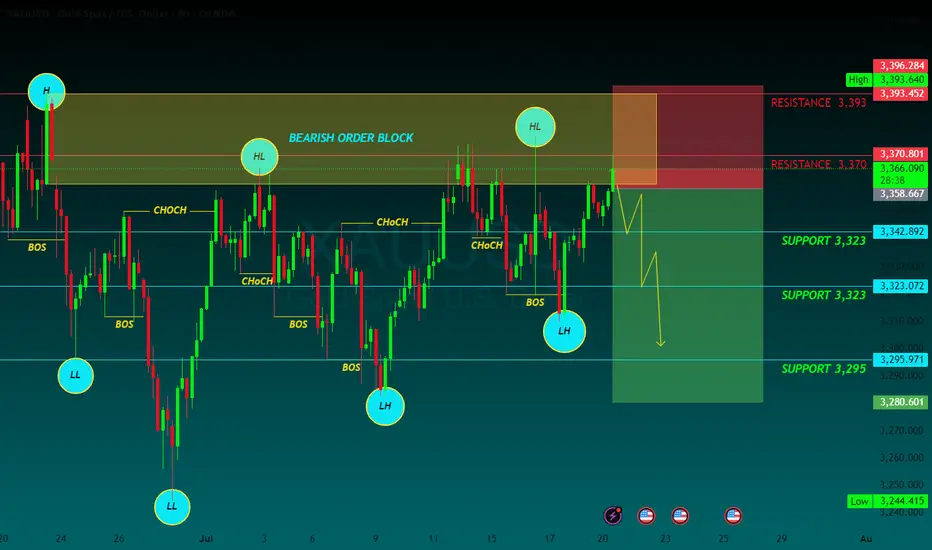
GOLD SELLGold price remains confined in a multi-week-old range as bulls seem reluctant
Gold price attracts some safe-haven flows amid persistent trade-related uncertainties. Mixed Fed rate cut cues keep the USD depressed and further benefit the XAU/USD pair. The range-bound price action warrants some caution before placing fresh bullish bets.
In the Forex market, Gold functions as a currency. The particularity of Gold is that it is traded against the United States Dollar (USD), with the internationally accepted code for gold being XAU.
Known as a safe-haven asset, Gold is expected to appreciate in periods of market volatility and economic uncertainty. Gold is also widely seen as a hedge against inflation and against depreciating currencies as it doesn’t rely on any specific issuer or government.
Central banks are the biggest Gold holders. In their aim to support their currencies in turbulent times, central banks tend to diversify their reserves and buy Gold to improve the perceived strength of the economy and the currency. The United States is the country that holds the biggest resources of Gold in the world.
1 SUPPORT 3,323
2 SUPPORT 3,323
3 SUPPORT 3,295
1 RESISTANCE 3,370
2 RESISTANCE 3,393
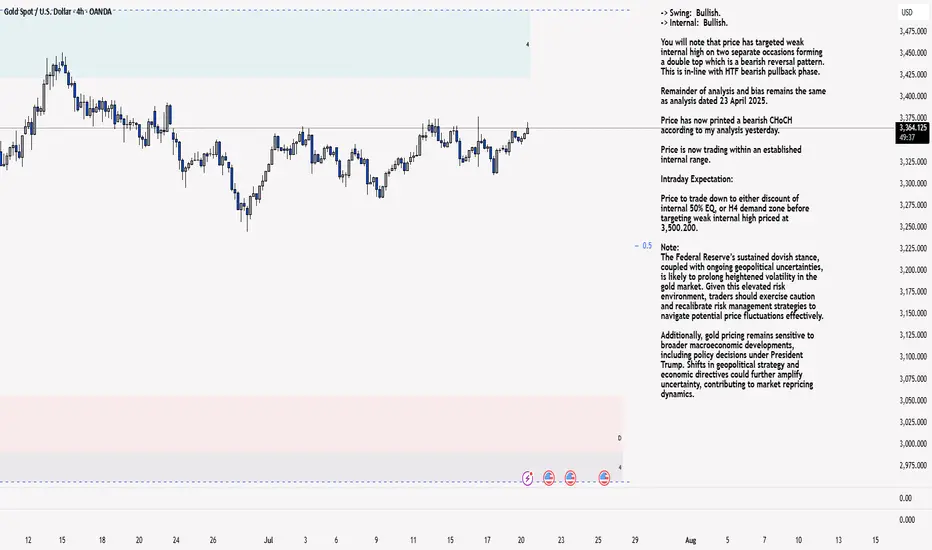
XAU/USD 21 July 2025 Intraday AnalysisH4 Analysis:
-> Swing: Bullish.
-> Internal: Bullish.
You will note that price has targeted weak internal high on two separate occasions forming a double top which is a bearish reversal pattern. This is in-line with HTF bearish pullback phase.
Remainder of analysis and bias remains the same as analysis dated 23 April 2025.
Price has now printed a bearish CHoCH according to my analysis yesterday.
Price is now trading within an established internal range.
Intraday Expectation:
Price to trade down to either discount of internal 50% EQ, or H4 demand zone before targeting weak internal high priced at 3,500.200.
Note:
The Federal Reserve’s sustained dovish stance, coupled with ongoing geopolitical uncertainties, is likely to prolong heightened volatility in the gold market. Given this elevated risk environment, traders should exercise caution and recalibrate risk management strategies to navigate potential price fluctuations effectively.
Additionally, gold pricing remains sensitive to broader macroeconomic developments, including policy decisions under President Trump. Shifts in geopolitical strategy and economic directives could further amplify uncertainty, contributing to market repricing dynamics.
H4 Chart:
M15 Analysis:
-> Swing: Bullish.
-> Internal: Bullish.
H4 Timeframe - Price has failed to target weak internal high, therefore, it would not be unrealistic if price printed a bearish iBOS.
The remainder of my analysis shall remain the same as analysis dated 13 June 2025, apart from target price.
As per my analysis dated 22 May 2025 whereby I mentioned price can be seen to be reacting at discount of 50% EQ on H4 timeframe, therefore, it is a viable alternative that price could potentially print a bullish iBOS on M15 timeframe despite internal structure being bearish.
Price has printed a bullish iBOS followed by a bearish CHoCH, which indicates, but does not confirm, bearish pullback phase initiation. I will however continue to monitor, with respect to depth of pullback.
Intraday Expectation:
Price to continue bearish, react at either M15 supply zone, or discount of 50% internal EQ before targeting weak internal high priced at 3,451.375.
Note:
Gold remains highly volatile amid the Federal Reserve's continued dovish stance, persistent and escalating geopolitical uncertainties. Traders should implement robust risk management strategies and remain vigilant, as price swings may become more pronounced in this elevated volatility environment.
Additionally, President Trump’s recent tariff announcements are expected to further amplify market turbulence, potentially triggering sharp price fluctuations and whipsaws.
M15 Chart:
XAUUSD FORMED A BULLISH PENNANT PATTERN-ANOTHER BULLISH IMPULSE?XAUUSD FORMED A BULLISH PENNANT PATTERN - ANOTHER BULLISH IMPULSE?📈
Gold has been under buying pressure since the beginning of the year. Since April 21 the price has been consolidating. Now the graph represents the bullish pennant.
What is a bullish pennant?
Pennant pattern: Short-term continuation pattern after a sharp price move (flagpole), forming a small symmetrical triangle. Signals trend resumption, lasts 1-3 weeks with declining volume. So, first of all, identify a flagpole and a consolidating triangle. Confirm it with indicators (bullish/bearish divergence). After that you may trade breakout in trend direction (buy bullish, sell bearish) with volume spike. Set your stop-loss below/above the opposite side of pennant. You may set your take-profit at a flagpole height from a breakout.
Here we see the divergence on RSI 4-h timeframe. If the price breaks the upper border of the pennant pattern you may open long position.

XAU/USD Intraday Plan | Support & Resistance to WatchGold has extended its recovery and is now trading around 3,366, pushing into the next resistance cluster.
Price is holding firmly above both the 50MA and 200MA, which are now flattening and beginning to turn upward, acting as dynamic support.
A confirmed break and hold above 3,362 would open the path toward the next upside targets at 3,383 and 3,400, with 3,416 and 3,440 as higher‑timeframe resistance levels if momentum continues.
If price rejects the 3,362 resistance zone and fades lower, watch the Pullback Support Zone (3,336–3,317) closely. A break back below that area would shift focus to the broader Support Zone (3,289-3,267).
Failure to hold there could expose price to the deeper HTF Support Zone.
📌 Key Levels to Watch
Resistance:
3,362 ‣ 3,383 ‣ 3,400 ‣ 3,416
Support:
3,336 ‣ 3,317 ‣ 3,302 ‣ 3,289 ‣ 3,267
🔎 Fundamental Focus – Week of July 21–25
📌 Tuesday, Jul 22
Fed Chair Powell Speaks
📌 Thursday, Jul 24
Unemployment Claims
Flash Manufacturing PMI & Flash Services PMI

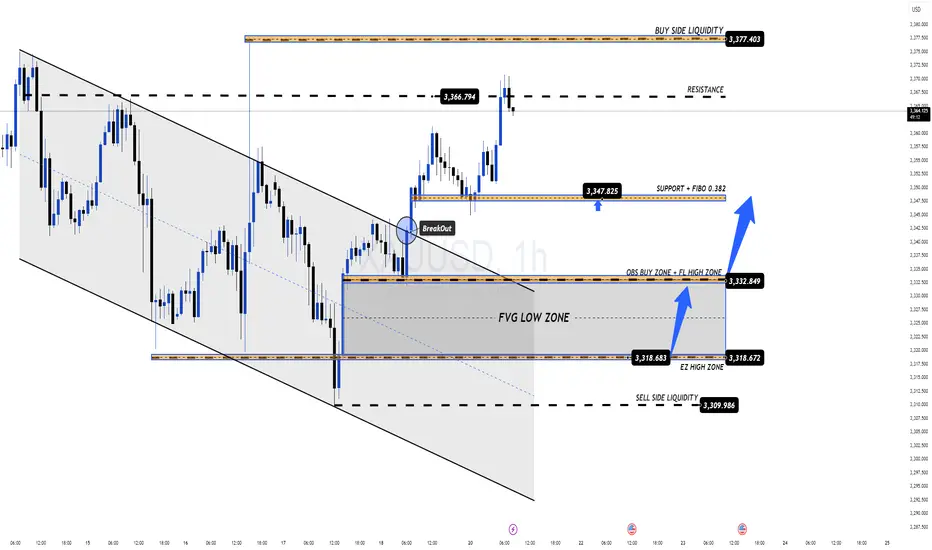
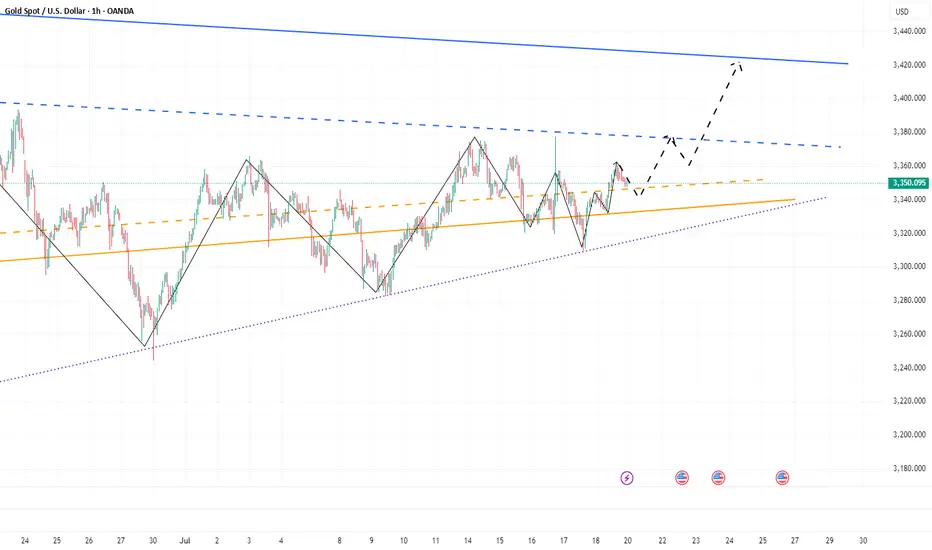
XAUUSD 21/07 - Will the Bullish Momentum Continue?In today’s session (July 21), the 1H chart of XAUUSD shows a confirmed breakout above the medium-term descending trendline. The bullish momentum originated from a strong rebound at the confluence zone of support, EMA, and ascending trendline — suggesting a high-probability continuation setup for the short term.
Technical Analysis Overview:
🔹 Price Action Structure:
Price broke out of a falling wedge / descending triangle with a strong bullish Marubozu candle, confirming the breakout move.
Breakout was supported by increased volume, indicating strong institutional buying near 3,346–3,350.
🔹 Trendlines and EMA Outlook:
Price is currently holding above the ascending yellow trendline.
Short-term EMAs (e.g., EMA20/50, not shown) are likely sloping upwards and sitting below price, confirming bullish market structure.
🔹 Key Support and Resistance Levels:
Immediate Resistance: 3,370 USD – recently tested previous swing high.
Major Resistance: 3,378 – 3,385 USD – Fibonacci projection and previous supply zone.
Short-term Support: 3,359 USD – minor pullback zone and EMA alignment.
Major Support: 3,346 USD – the breakout retest zone and price structure support.
Suggested Trading Strategies:
Scenario 1: Buy the Dip
Entry: Near 3,359 – 3,346 USD (on minor retracement)
Stop Loss: Below 3,338 USD (to invalidate the breakout zone)
Target 1: 3,370 USD
Target 2: 3,378 – 3,385 USD
Scenario 2: Breakout Continuation Buy
If price breaks above 3,370 with strong candle + volume:
Entry: Around 3,372 – 3,374 USD
Stop Loss: 3,359 USD
Target: 3,385 – 3,392 USD
Additional Indicators to Watch:
RSI (not shown): If approaching 70+, watch for bearish divergence or exhaustion signals.
Volume: Sustained or increasing volume will confirm strength of the uptrend.
Conclusion:
XAUUSD is showing strong bullish technical signals after breaking the descending trendline and successfully retesting the breakout level. As long as price holds above 3,346 – 3,350, the short-term bullish structure remains intact.
- Follow for more high-quality trading strategies and daily gold analysis. Save this idea if you find it useful for your trading setup!
What’s your view on this analysis? Let’s discuss more in the comments below!

Gold Price Analysis July 21After being reinforced by CPI data last week, gold prices have regained their bullish momentum and are currently trading in a wide range. The technical structure still shows a dominant uptrend, with the trendline continuing to act as reliable support, targeting the important resistance zone of 3400 next week.
📌 Preferred trading strategy:
Watch the price reaction around the support zone of 3343. If there is a rejection signal of this zone accompanied by buying pressure, that will be the ideal entry point.
If the price continues to correct deeper, the strong support zone of 3322 will be a reasonable DCA point.
It is not recommended to SELL if the price breaks the confluence zone of 3373, as this is a signal confirming the strong bullish momentum continues.
📍 Important price zones:
Support: 3343 – 3322
Resistance: 3373 – 3400
🚀 Buy Trigger:
Price rejects 3343 zone with clear bullish signal
Strong bounce from 3322 zone
Xauusd Analysis is Ready technical analysis of XAUUSD (Gold Spot vs. US Dollar) on the 15-minute timeframe using support and resistance levels, with projected price movements annotated.
Key Levels:
Support Zone: Around 3350 USD (labeled as "Support 3350")
Resistance Zones:
Minor resistance: Around 3380.18 USD
Major resistance: Around 3390.77 USD
Target: 3390 USD, highlighted as the ultimate bullish goal.
Current Price:
Price at the time of analysis: ~3368.30 USD
Analysis Summary:
1. Support Retest Scenario:
Price may pull back to the 3350 support zone.
If this support holds, a bullish reversal is expected.
The anticipated move is a rebound back toward the resistance zone at 3380, and possibly to the target at 3390.
2. Immediate Bullish Continuation:
Alternatively, price could continue upwards from the current level without revisiting support.
Resistance around 3380 may act as a minor barrier.
If broken, the price could reach the target at 3390.
3. Bearish Risk:
If 3350 fails to hold as support, further downside may occur, invalidating the bullish setup.
Strategy Implication:
Buy positions could be considered on a successful retest and bounce at 3350.
Take-profits might be set near 3380 and 3390.
Traders should watch for price action confirmation at key levels before entering trades.
This is a classic support-resistance trading setup with short-term bullish bias aiming for a breakout toward higher resistance levels

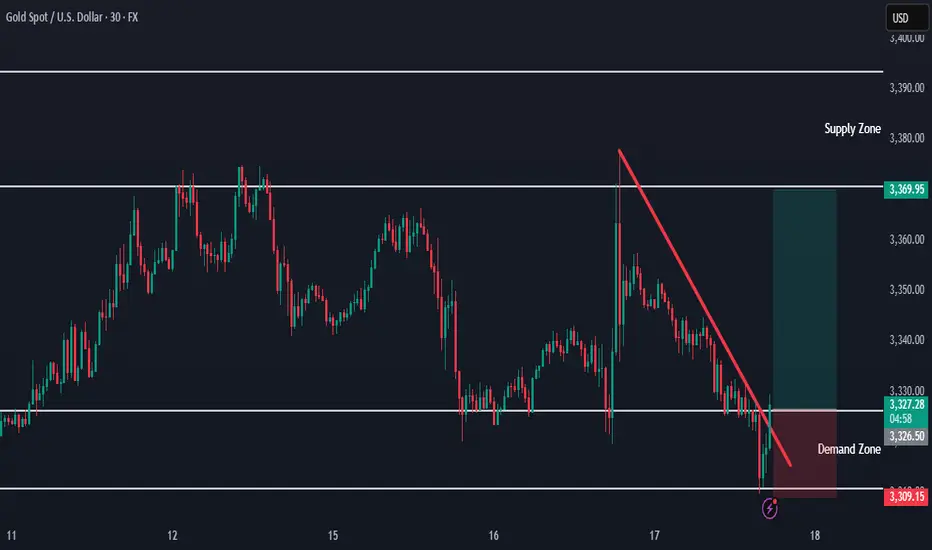
Gold Holding Demand — New Buy Setup FormingThe demand zone on the higher timeframe is still holding, and price is starting to move higher.
A new buy opportunity is forming upon the break of the downward trendline.
Is This the Start of a New Gold Bull Run?News that must be paid attention to:
1. The Middle East region is in constant conflict and the situation is unstable, which may re-stimulate the market's risk aversion sentiment;
2. Trump strongly called for a rate cut, and many Fed directors agreed to the rate cut. Under the situation of internal and external troubles, can Powell withstand the pressure of rate cuts? In addition, the tense relationship between Trump and Powell, as well as the development of Powell's dismissal storm, have increased the market's risk aversion demand and enhanced the market's bullish sentiment;
3. The uncertainty brought about by the tariff issue may disrupt the market.
Technical aspects:
This week, the gold market is roughly a bottoming out and rebounding trend. We can clearly see from the recent candle chart that the recent trend line suppression is located near 3380, and this week gold has repeatedly encountered resistance and fallen in the 3375-3380 area, which has strengthened the suppression effect of resistance in this area to a certain extent; and gold has repeatedly tested the 3320-3310 area support during the retracement process. Gold has not fallen below the support of this area during multiple retracements, giving the market bulls great confidence.
On Friday, gold hit 3360 during the rebound and closed above 3350, which is strong in the short term. As gold continues to rebound, the current bull-bear dividing line is in the 3345-3335 area. If gold cannot even fall below the 3345-3335 area during the retracement next week, it will greatly boost buying power and is expected to hit the 3380 area again. Once gold breaks through the 3380 area during the rise, there will be a chance to further continue the rise and test 3400, or even the 3420 area.
Therefore, at the beginning of next week, if gold retreats to the 3345-3335 area for the first time, I think we must make an attempt to buy gold, first focusing on the target 3370-3380 area, and then bullish to the 3400-3420 area after a strong breakthrough.
XAU/USD Elliott Wave Setup : Triangle Ends, Impulse BeginsThe 8-hour XAU/USD chart presents an Elliott Wave structure, currently in the final stages of Wave 4 within a larger impulsive cycle. The complex correction in Wave 4 has unfolded as a WXYXZ (triple-three pattern), forming a contracting triangle (ABCDE) — a classic consolidation phase that typically precedes a sharp impulsive breakout.
Wave E has recently completed near the lower boundary of the triangle, supported by the ascending trendline drawn from the April low. This suggests the correction is mature and Wave 5 is ready to ignite.
Target 1 (T1) : 3434.845
Target 2 (T2) : 3500.535
Stop Loss (SL) : 3309.729
The triangle (Wave 4) breakout structure suggests bullish continuation.
Multiple internal WXY corrective waves have completed, signaling exhaustion.
Volume and candle structure support the possibility of impulsive buying in Wave 5.

Gold (XAU/USD) Technical Outlook — 21 July 20251. Market Overview & Live Price Confirmation
Gold is currently trading around $3,354, with a daily range of approximately $3,345–$3,359. This places it firmly within its broader uptrend, showing resilience amid recent macro uncertainties and consolidating its position above key support zones.
2. Four-Hour Technical Breakdown
Trend & Structure
The 4-hour chart reveals a strong bullish structure, marked by consistent higher highs and lows. A recent Break of Structure occurred near $3,324, reinforcing the upward bias. A minor Change of Character around $3,360–$3,358 reflects a healthy retracement, but the bigger picture remains strong.
Key SMC & ICT Zones
Supply Zone: $3,360–$3,362 — recent peak area likely to attract sellers and sweep above liquidity.
Demand Zone: $3,340–$3,344 — aligns perfectly with the 38.2% Fib from the $3,308–$3,362 swing, forming a prime area to buy from.
Order Block / FVG Zone: $3,336–$3,342 — open imbalance suggesting price may revisit for efficient entry.
Liquidity Context: Order flow patterns indicate stop hunts around established zones — part of classic Smart Money Concepts.
Fibonacci Levels
38.2% retrace at $3,340, offering medium-term confluence support.
Upside projections via Fibonacci:
1.272 extension: $3,378
1.618 extension: $3,389
3. One-Hour Intraday Trading Setups
Aligned with the 4-hour bullish bias, these setups offer scalable, structured entry opportunities.
Strategy Entry Zone Stop-Loss Take-Profit Risk:Reward
Aggressive Long $3,344 $3,338 $3,358 → $3,362 ~2:1
Conservative Long $3,340 $3,330 $3,362 → $3,378 ~2.5:1
Short Opportunity Rejection @ $3,362 $3,368 $3,344 ~2:1
🌟 The Golden Setup
Buy within $3,340–$3,344 (4H demand + Fib zone + FVG)
Stop-Loss: $3,330
Take-Profit 1: $3,362 (range high)
Take-Profit 2: $3,378 (Fib 1.272)
Why It Works: A confluence of structural support, liquidity zones, and retracement levels gives this setup high predictive quality.
4. Analyst Consensus Snapshot
Market commentary from professional analysts shows alignment with dip-buy strategies. Most recognize the $3,340 region as key support and express caution entering $3,360–$3,375 resistance. Weekly forecasts describe tight trading with potential for breakouts or retracements depending on economic data and Fed commentary, but the medium-term trend remains bullish.
5. Summary & Trading Blueprint
Price Range: $3,345–$3,359 (daily); $3,338–$3,378 (targets)
4-Hour Bias: Bullish, with defined demand and supply zones
Golden Trade: Buy $3,340–3,344 → SL $3,330 → TP1 $3,362 / TP2 $3,378
Catalysts to Watch: Federal Reserve speech, tariff developments, USD movements.
6. Final Thoughts
Gold continues to demonstrate bullish resilience, supported by both technical structure and macro tailwinds. The $3,340–3,344 zone offers a clear, high-probability entry confluence, while stop placement and profit targets are well-defined. Profit management around $3,360 ensures disciplined scaling or early exits if risk factors emerge.
By blending price action, Smart Money frameworks, ICT concepts, and Fibonacci confluence—all structured into actionable trade setups—you have a professional-grade playbook ready for deployment.

7/18: Watch 3343 Resistance, Guard Against Break Below 3323Good morning, everyone!
Yesterday, gold broke below the 3337 support after consolidating there, driven lower by bearish data, and eventually reached the 3323–3312 support zone. A rebound followed, and price has now returned above 3323, which also aligns with the daily MA60.
📌 Key Levels to Watch Today:
Resistance: 3343 / 3352–3358
→ A sustained break above 3343 opens the door for a potential move toward 3366 / 3372–3378;
Support: 3323 / 3312
→ If price remains capped below resistance and weekly close is under 3323, it will signal bearish structural pressure for the medium term.
📌 Trading Strategy:
Trade flexibly within the range of 3358–3343–3332–3323–3312
📌 Important Reminder:
If today’s closing price is below 3323, and you're planning to hold positions over the weekend, it’s safer to lean short. While we can’t predict weekend news, technically, bears have the upper hand, so risk control is essential.