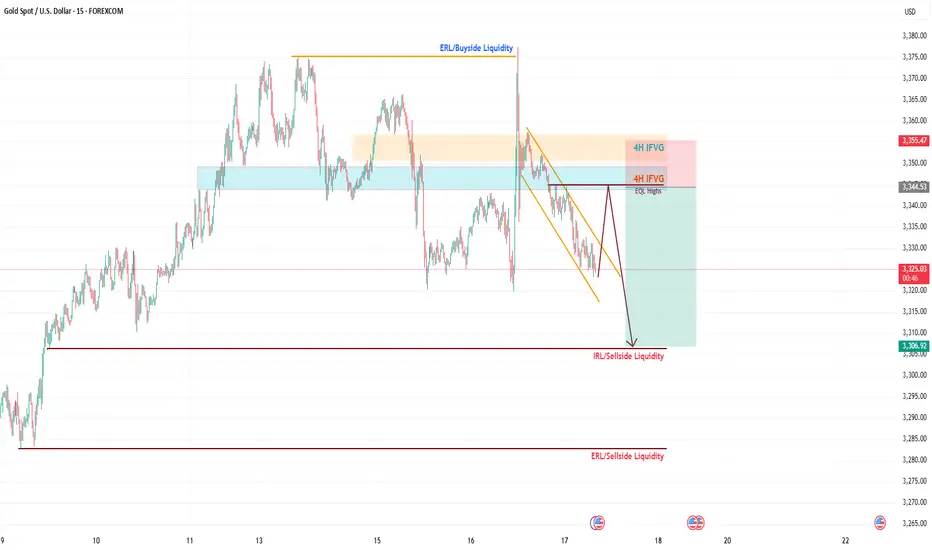
Gold Trading Idea: Short Opportunity on 15-Min Descending ChanneHello TradingView Community,
Following up on my Gold analysis from Monday, the price action has respected the levels I outlined (check my previous posts for the breakdown), delivering solid trade opportunities except yesterday's news-driven volatility. Today, we're eyeing a short setup on Gold based on the 15-minute timeframe.
Technical Analysis:
Gold is moving within a descending channel on the 15-min chart.
I've identified equal highs and a small FVG (Fair Value Gap) aligning with the 61.8% Fibonacci retracement of the channel's range.
This confluence zone is where I expect the price to react, potentially clearing liquidity above the channel before reversing.
Trade Plan:
Entry: Wait for the price to reach the confluence zone (equal highs + 61.8% Fib + FVG) and show a clear reaction (e.g., rejection or reversal pattern) before entering a short position.
Take Profit: Targeting 3310 level.
Risk Management: If the price fails to reach the zone and breaks lower, I'll stay out to avoid chasing trades. Patience is key here.
Stay disciplined, traders! Let the price come to our zone, and always manage your risk.
Follow for more setups, like this post if you found it helpful, and drop your thoughts in the comments below! Let’s discuss!
#Gold #XAUUSD #ShortSetup #TechnicalAnalysis
Xauusdanalysis
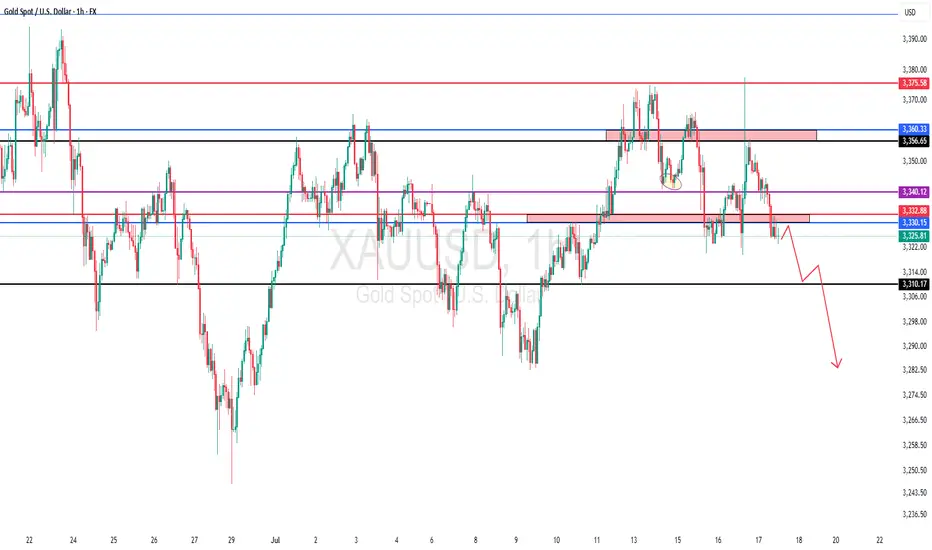
Continue to go long after bottoming outYesterday, the Trump and Powell incident caused gold to rise strongly to around 3377. The rise in gold was only short-lived. In the end, gold closed positively on the daily line, but it closed with a super long upper shadow line. In the end, the gold price quickly rose and broke through the 3377 mark, but fell back under pressure and closed in a volatile market. The daily K-line closed high and fell back in a volatile market. Although the overall gold price repeatedly fluctuated and washed out under the stimulation of news, it ultimately failed to break through the recent large box oscillation range. Today we continue to pay attention to the support line of 3318-25 below, and we will continue to go long if it falls back!
From the 4-hour analysis, the short-term support below continues to focus on around 3318-25, the short-term suppression above focuses on the 3340-45 line, and the key pressure above focuses on the 3380 line. Relying on this range as a whole, the main tone of high-altitude and low-multiple cycles remains unchanged. In the middle position, watch more and do less, be cautious in chasing orders, and wait patiently for key points to enter the market.

GOLD - Its Breakout? Short now??#GOLD.. perfect move as per our analysis, and now market just break hit current supporting area that was actually 3328
so keep close it and if market stay below that then we can expect a further drop towards our next supporting areas.
good luck
trade wisely
gold on sell#XAUUSD await breakout below 3324 which holds sell continuation. Expected target is below 3305-3292.
Below 3324 will drop the price, target 3305-3292, stop loss 3337.
Fundamental can change price back to Bullish. So we watch closely.

WEDGE IN XAUUSD, POSSIBLE OUTCOMESWEDGE IN XAUUSD, POSSIBLE OUTCOMES👀
Since the fundamentals didn't influence this asset (I mean yesterdays U.S. PPI report, escalation in the Middle East and Trump's hint on Powell's resignation), let's talk about technicals in gold.
XAUUSD primarily trades sideways since the beginning of June. Main support levels are 3,250.00 and 3,300.00. Main resistant levels are 3,375.00 and 3,450.00. Currently the asset trades within a range of 3,300.00 - 3,375.00. Additionally, bullion has formed a bearish wedge since the beginning of July. Right now the price is heading towards lower border of this wedge, where the SMA50 is situated and may act as an additional support here.
I see 2 main scenarios for a mid-term here:
1) Break below the wedge, rebound from 3,300.00 support, targeting 3,375.00.
2) Rebound from the wedge’s lower border, show a bearish move to 3,375.00, then drop to 3,300.00.
In both cases, I assume the price to stay sideways for a long period of time.

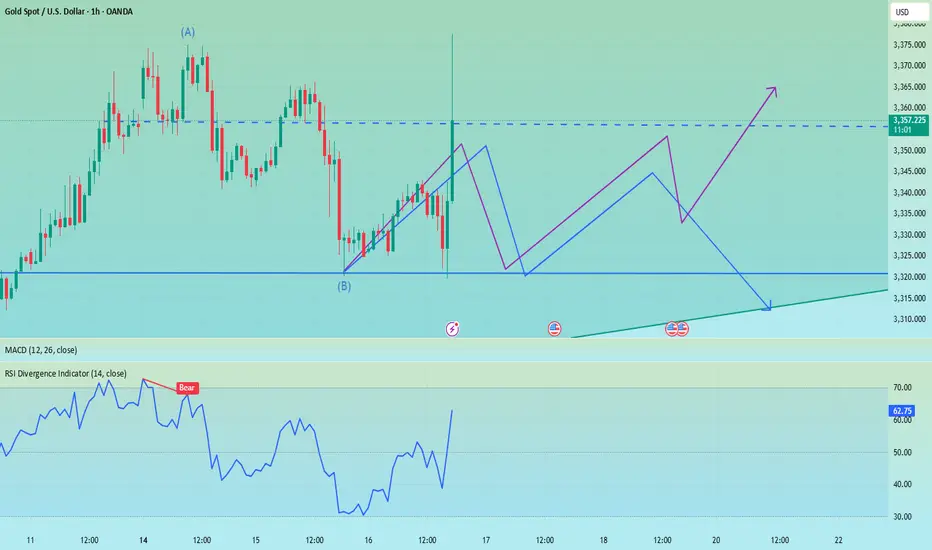
NordKern - XAUUSD InsightNordKern | Simplified Insight OANDA:XAUUSD Short Opportunity Ahead
Gold saw a sharp surge in price today, primarily driven by political headlines that temporarily shook market sentiment. To be specific:
📅 Jul 16, 2025 – 16:56 CET
CBS Reports: Trump asked Republican lawmakers whether he should fire Fed Chair Jerome Powell. This headline alone triggered an intraday spike of +$52/oz in gold as markets priced in increased macro and institutional risk.
As previously stated "Context Matters."
While the President cannot remove the Fed Chair without cause, even the suggestion introduces uncertainty and undermines confidence in the Fed’s independence especially ahead of a high-stakes election cycle.
However, further developments quickly followed: 📅 Jul 16, 2025 – 17:58 CET
Trump: “Firing Powell is highly unlikely.” 📅 Jul 16, 2025 – 18:06 CET
Trump: “Reports on me firing Powell are not true.” With this clarification, the initial rally appears overstretched and sentiment-driven, leaving room for a corrective pullback as the market digests the full picture.
Trade Setup - Short Bias
Parameters:
Entry: 3356.40
Stop Loss: 3690.30
Take Profit: 3322.00
Key Notes:
- The spike was headline-driven and not supported by policy shift or macro data.
- Trump’s denial removes much of the political risk premium that had been briefly priced in.
- Watch for momentum fading near resistance and confirmation via intraday structure.
This remains a tactically driven setup. Manage risk appropriately and stay alert for any renewed political developments.
False breakout? Gold reverses sharply after news surgeBecause of the news that Trump hinted at firing Powell, gold surged strongly in the short term and passed to 3377, recovering the recent decline in one fell swoop. We went long on gold near 3323 in advance, and went long on gold near 3340 again after gold retreated, hitting TP: 3345 and 3355 respectively. The two long trades successfully made a profit of 370pips, with a profit of more than $18K.
Although gold has risen sharply in the short term and effectively destroyed the downward structure, it is mainly news that drives the market. After Trump denied firing Powell, gold rose fast and fell fast. So we can't chase long gold too much. First, the sustainability of the news-driven market needs to be examined, and second, the certainty of Trump's news is still unreliable. He always denies himself the next day.
After the gold price retreated quickly, a long upper shadow appeared in the candlestick chart, indicating that the upper resistance should not be underestimated. Therefore, we should not rush to buy gold. We can still consider shorting gold in the 3355-3365 area. We should first focus on the area around 3340. If gold falls below this area during the retreat, gold will return to the short trend and test the area around 3320 again, or even fall below this area after multiple tests and continue to the 3310-3300 area.
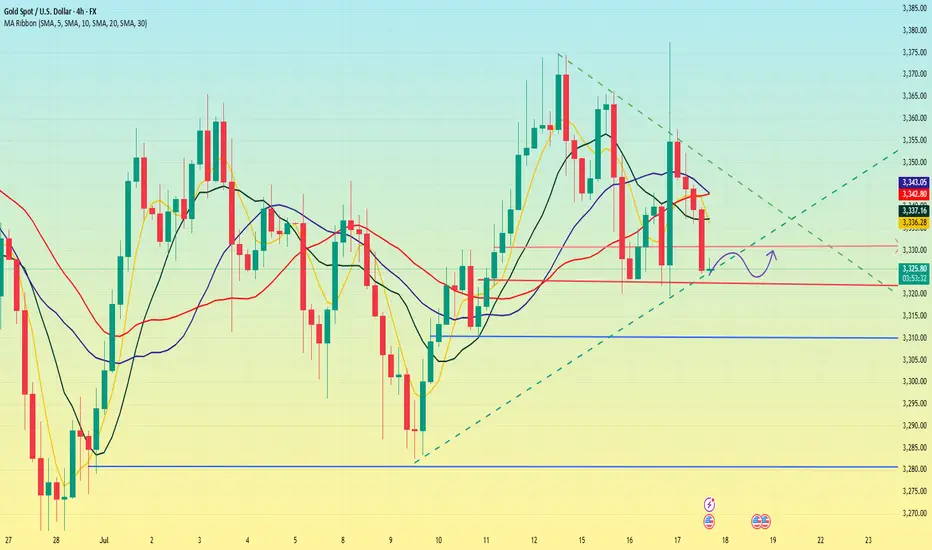
Gold fluctuated downward. Stuck in a stalemate.Information summary:
Global investors have experienced the longest night this year. There are reports that Trump has drafted a letter to fire Federal Reserve Chairman Powell. The incident triggered a strong reaction in the financial market. An hour later, Trump came out to clarify that "there is no plan to take any action" and denied drafting a letter to fire Powell.
Due to the impact of the incident, gold experienced a roller coaster market, soaring more than $50 at one time, hitting a three-week high of $3,377.17, and then narrowed its gains to 0.68%, and finally closed at $3,347.38. In today's Asian market, gold fell slightly and is currently hovering around $3,325.
Market analysis:
The current volatility pattern has not changed. In the short term, the market shows signs of weakness, which is also affected by CPI data, and expectations for interest rate cuts have weakened. In the current state where there is no break in the pattern, waiting and watching is still the best strategy.
The first support level is around 3,310, which is the starting point of last week's high. The second is around 3280, which is the historical low since July and also the starting point of the rise in the first week of July.
XAU/USD Chart Analysis: Volatility at a Yearly LowXAU/USD Chart Analysis: Volatility at a Yearly Low
The daily chart of XAU/USD shows that the Average Directional Index (ADX) has reached its lowest level since the beginning of 2025, indicating a significant decline in gold price volatility.
Yesterday’s release of the US Producer Price Index (PPI) initially triggered a sharp spike in gold prices, but the gains were short-lived, with the price quickly reverting to previous levels. This price action aligns with a broader market narrative of equilibrium—where supply and demand are in relative balance, and the market appears to be efficiently pricing in key influencing factors, including geopolitical tensions and tariff-related developments.
However, this fragile balance may soon be disrupted.
Technical Analysis of XAU/USD
From a broader technical perspective, gold remains within a long-term ascending channel (highlighted in blue) in 2025. Key observations include:
→ Attempts to rebound from the lower boundary of the channel (marked with arrows) lack conviction. Bulls are not capitalising on these opportunities to reignite the uptrend, suggesting a potential exhaustion of buying interest.
→ A trendline drawn across the major highs of 2025 has proven to be a strong resistance level. All recent breakout attempts have failed at this barrier.
As a result, the XAU/USD chart is showing signs of forming a large-scale triangle pattern, with its axis centred around the $3,333 level. If bulls continue to falter in extending the multi-month rally, it could encourage bears to challenge the lower boundary of the ascending channel, increasing the risk of a downside breakout.
This article represents the opinion of the Companies operating under the FXOpen brand only. It is not to be construed as an offer, solicitation, or recommendation with respect to products and services provided by the Companies operating under the FXOpen brand, nor is it to be considered financial advice.
The firing of Powell set off the market, don't chase the longsTrump showed a draft of the letter to fire Powell, but whether Powell will be fired in the end remains to be seen, but the impact on the gold market is undoubtedly huge. The wolves have now smelled a very dangerous scent. Don’t chase high prices. Don’t chase high prices! ! ! After all, the impact of the news comes and goes quickly, and there is a high possibility of a reversal later in the evening. The final suppression position of the current gold daily line is 3340. If the closing line today can maintain above 3340, then gold will usher in a real bullish trend in the future.
OANDA:XAUUSD
Gold Slips in London – $3,296 Incoming?📉 XAUUSD 1H Bearish Analysis – July 17, 2025
Gold (XAUUSD) is showing clear signs of bearish momentum on the 1-hour chart. After forming a local high around the $3,346–$3,347 region, price was sharply rejected and has since maintained a lower high structure. This rejection came right after the London session began, confirming that institutional volume is likely favoring the downside for now.
The previous few sessions show multiple failed attempts to break above the $3,346–$3,365 range. Sellers are consistently stepping in near those zones, marking a strong supply area. Meanwhile, recent candles have broken below the intraday support around $3,327.74, showing bearish continuation is underway.
Session activity is also in favor of the bears. The current London session opened weak, following a failure to hold above the previous session highs. Typically, gold experiences volatility during London and New York overlaps, and given the current structure, the pressure seems tilted to the downside.
From a broader perspective, the lower highs and lower lows on the 1-hour chart confirm a short-term downtrend. Price is now hovering just above $3,319 support—if this level is taken out cleanly with volume, it opens the path to deeper targets.
________________________________________
📌 Trading Setup (Short Bias)
• Entry: $3,327.74 (breakdown zone)
• Stop-loss: $3,346.29 (above last supply rejection)
• Take-Profit 1: $3,319.69
• Take-Profit 2: $3,311.62
• Take-Profit 3: $3,296.28
• Take-Profit 4 (extended): $3,282.66
________________________________________
If price manages to hold below $3,328 with consecutive rejections on any pullback, this bearish thesis remains valid. A breakdown below $3,311 would likely trigger momentum-driven selling toward $3,296 and potentially $3,282. However, any 1H close back above $3,346 would invalidate the current setup and favor a temporary bullish retracement.

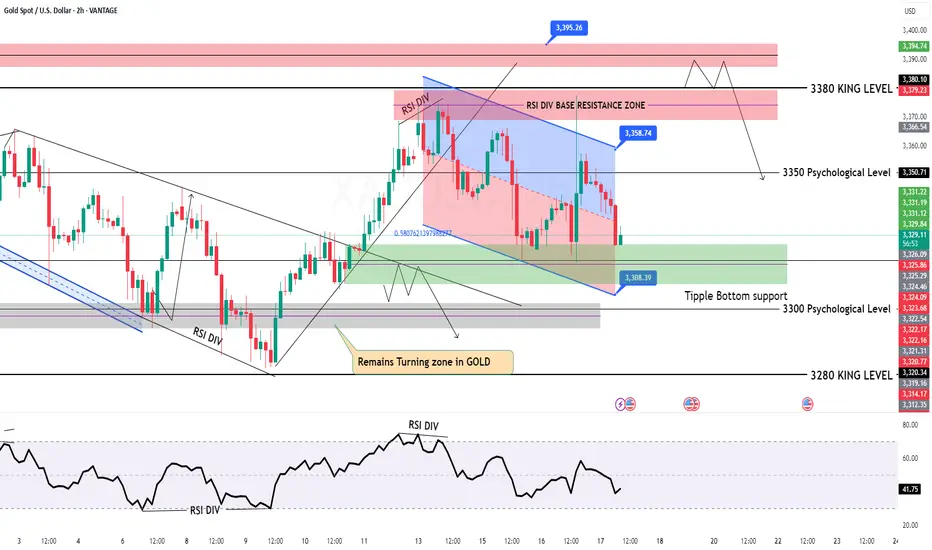
GOLD Intraday Chart Update For 17 July 2025Hello Traders, welcome to new Trading day
Today we have some high impact news of USD, Currently market is still in tight range and we still need breakout of 3300 Psychological for downside clearly
For upside market must need to close above 3380-90 zone for further upwards continuation
currently we are also keep an eyes on WAR Fundamental news
Disclaimer: Forex is Risky
XAUUSD BUY IDEAOn the H4 we have a clear unmitigated fvg+KL just blow a valid level as inducement which price might come to raid.
There has been series of military attack between iseal and Syria and also Fed cutting the rate will also be a key factor

XAUUSD NEXT MOVE (READ CAPTION)Hi trader's. what do you think about gold market
current price : 3354
gold Friday breakout sell trade and gold breakout resistance 3345 and close above 3345 and gold just retest downside then he taking support and pump upside gold breakout 3365 then gold next move 3395
support zone: 3343:3330
resistance zone :3365
target 3395
stop loss: 3310
please like comment and follow thank you

The latest gold trend analysis and strategic suggestionsYesterday, the price of gold showed a range of fluctuations. The long and short sides fought fiercely but failed to break through the existing range. The overall trend direction is still unclear. From a fundamental point of view, the market is still dominated by risk aversion, which makes it difficult for the price of gold to form a clear trend reversal. However, it should be noted that the main funds may take extreme suppression measures in the future to force the price of gold to fall. From the 4-hour chart, gold has been under pressure near the upper track 3377 and continued to fall. Yesterday, it broke through the middle track support and touched the lower track. The current price is temporarily supported near the lower track, but the overall trend still shows a wide range of fluctuations and has not formed an obvious trend. The short-term strength of the US dollar suppresses the upward movement of gold, but the key support and resistance levels have not been effectively broken; in terms of intraday short-term operation suggestions, the current callback near 3320-3325 can try to do ultra-short-term longs. It is recommended to stop profit and exit in the 3340-3345 range. It can be combined with the K-line pattern to short-sell, and the target is the lower track area. If the downward momentum is strong, it may fall below yesterday’s low to form a continuous decline.
Operation suggestions:
1. Go long when gold falls back to around 3320-3325, stop loss at 3312, target at 3340-3345.

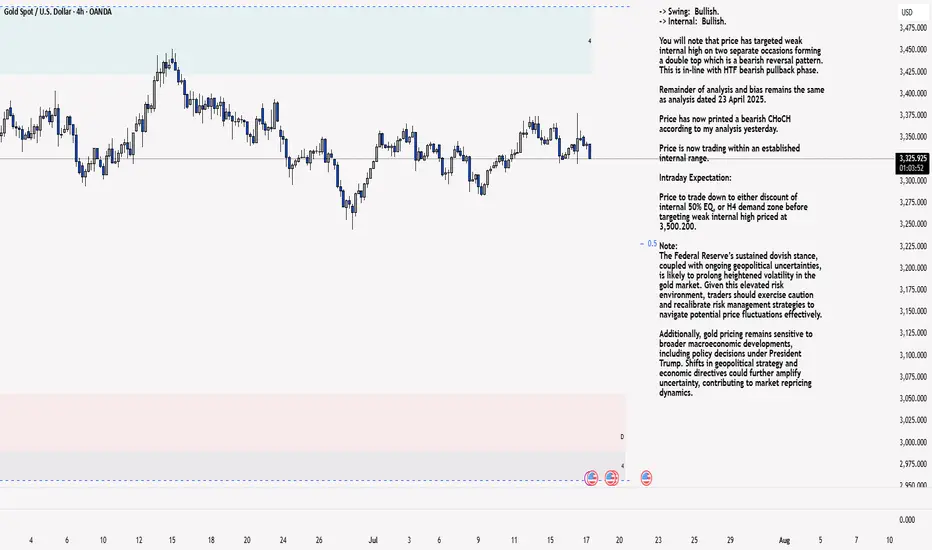
XAU/USD 17 July 2025 Intraday AnalysisH4 Analysis:
-> Swing: Bullish.
-> Internal: Bullish.
You will note that price has targeted weak internal high on two separate occasions forming a double top which is a bearish reversal pattern. This is in-line with HTF bearish pullback phase.
Remainder of analysis and bias remains the same as analysis dated 23 April 2025.
Price has now printed a bearish CHoCH according to my analysis yesterday.
Price is now trading within an established internal range.
Intraday Expectation:
Price to trade down to either discount of internal 50% EQ, or H4 demand zone before targeting weak internal high priced at 3,500.200.
Note:
The Federal Reserve’s sustained dovish stance, coupled with ongoing geopolitical uncertainties, is likely to prolong heightened volatility in the gold market. Given this elevated risk environment, traders should exercise caution and recalibrate risk management strategies to navigate potential price fluctuations effectively.
Additionally, gold pricing remains sensitive to broader macroeconomic developments, including policy decisions under President Trump. Shifts in geopolitical strategy and economic directives could further amplify uncertainty, contributing to market repricing dynamics.
H4 Chart:
M15 Analysis:
-> Swing: Bullish.
-> Internal: Bullish.
H4 Timeframe - Price has failed to target weak internal high, therefore, it would not be unrealistic if price printed a bearish iBOS.
The remainder of my analysis shall remain the same as analysis dated 13 June 2025, apart from target price.
As per my analysis dated 22 May 2025 whereby I mentioned price can be seen to be reacting at discount of 50% EQ on H4 timeframe, therefore, it is a viable alternative that price could potentially print a bullish iBOS on M15 timeframe despite internal structure being bearish.
Price has printed a bullish iBOS followed by a bearish CHoCH, which indicates, but does not confirm, bearish pullback phase initiation. I will however continue to monitor, with respect to depth of pullback.
Intraday Expectation:
Price to continue bearish, react at either M15 supply zone, or discount of 50% internal EQ before targeting weak internal high priced at 3,451.375.
Note:
Gold remains highly volatile amid the Federal Reserve's continued dovish stance, persistent and escalating geopolitical uncertainties. Traders should implement robust risk management strategies and remain vigilant, as price swings may become more pronounced in this elevated volatility environment.
Additionally, President Trump’s recent tariff announcements are expected to further amplify market turbulence, potentially triggering sharp price fluctuations and whipsaws.
M15 Chart:
Gold Price Analysis July 17XAUUSD Analysis Today
The price has cleared the liquidity to the 3377 zone, then returned to trading within the triangle. The market is currently waiting for new momentum to determine the next trend.
✅ BUY Scenario
If the 3322-3323 zone continues to hold and there is a bearish rejection signal and confirmation of buying power, gold is expected to continue its uptrend towards the 3373 - 3400 zone.
❌ SELL Scenario
If the price breaks the 3321 support with clear selling pressure, it can extend the decline to 3285.
🔑 Key Level Today
Support: 3321 - 3323
Resistance: 3373 - 3400
💡 Strategy:
Watch the price reaction at the important support zone to decide the next action.
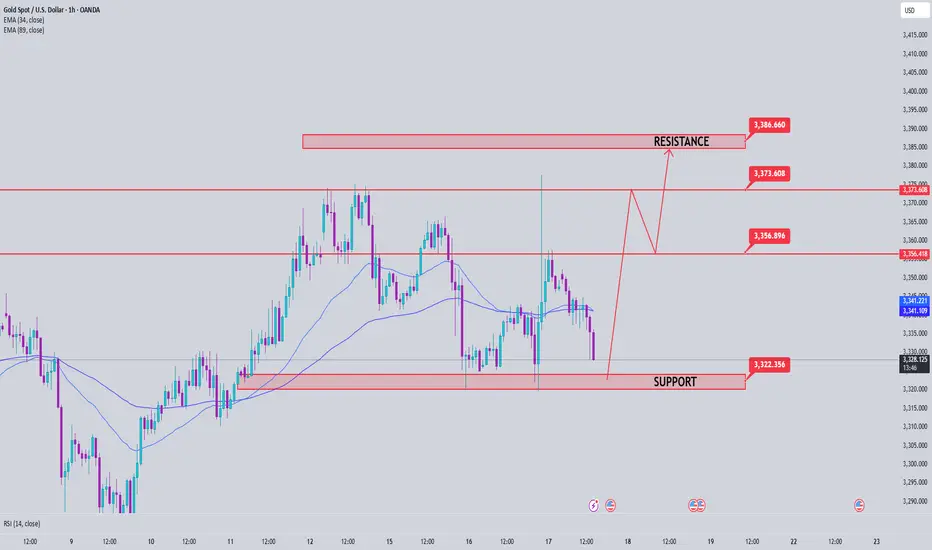
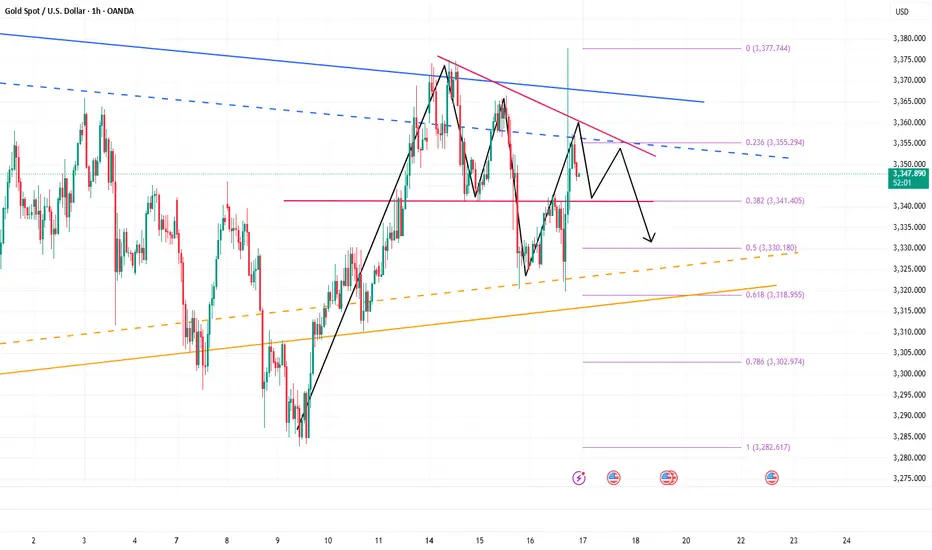
Gold Short Term OutlookYesterday, gold staged a strong rally, pushing up toward 3,377, which was followed by a strong rejection. Price has pulled back sharply and is now testing the Pullback Zone once again.
Currently trading around 3,329, price is caught between the 50MA overhead acting as dynamic resistance and the 200MA below offering dynamic support.
For the bullish structure to regain momentum, we need to see a clean break and hold back above 3,354. This would reopen the path toward 3,383 and 3,400, with 3,416 as a higher‑timeframe target.
If buyers fail to defend the Pullback Support Zone, and price breaks decisively below 3,305, attention shifts to the Support Zone (3,289–3,267). A deeper selloff could then expose the HTF Support Zone (3,241–3,208).
📌 Key Levels to Watch
Resistance:
‣ 3,354
‣ 3,383
‣ 3,400
‣ 3,416
Support:
‣ 3,335
‣ 3,305
‣ 3,289
‣ 3,267
‣ 3,241
🔎 Fundamental Focus – High‑Impact U.S. Data Today
A packed U.S. calendar could drive volatility:
📌Core Retail Sales m/m and Retail Sales m/m
📌Unemployment Claims
📌Philly Fed Manufacturing Index
These red‑folder releases can create sharp intraday swings.
Additionally, multiple FOMC member speeches later in the session could add headline‑driven moves.
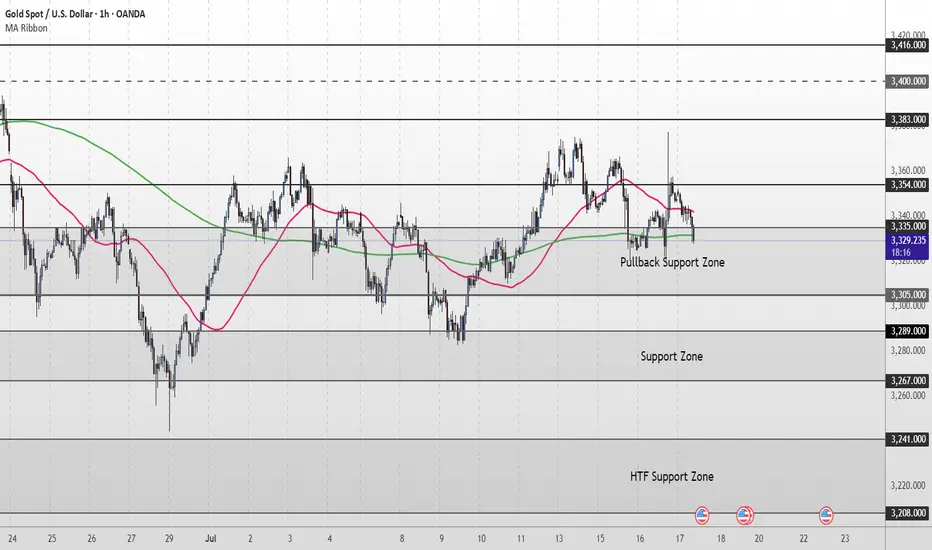
Gold Spot / U.S. Dollar (XAU/USD) 4-Hour Chart4-hour chart from OANDA displays the price movement of Gold Spot (XAU/USD) against the U.S. Dollar, showing a current price of $3,329.145 with a decrease of $18.455 (-0.55%). The chart highlights key levels including a sell price of $3,328.920 and a buy price of $3,329.370, with a recent trading range between $3,355.339 and $3,312.393. The data spans from late June to mid-July 2025, with notable price fluctuations and a shaded area indicating a potential trading zone.

XAUUSD Trade Setup: Buying Opportunity at 3,322 Support ZoneGold (XAUUSD) is currently testing a critical support zone between 3,322 and 3,323 USD. This area represents a confluence of the previous swing low and the 0.618 Fibonacci retracement level, which is historically known to trigger technical bullish reactions. If a confirming signal appears on the H1 chart, this may offer a favorable short-term buy opportunity.
Trade setup details:
Entry (Buy limit): 3,323 – 3,322 USD
Stop loss: below 3,318 USD
Take profit: 3,331 – 3,340 USD
Risk-to-reward ratio: approximately 2:1
Technical rationale for the trade:
The 3,322 level has acted as a strong support in recent price structure
Aligns with the 0.618 Fibonacci retracement, often seen as the last line of defense in bullish setups
RSI on the lower time frame is nearing oversold, signaling potential bullish momentum
Risk management notes:
If price closes below 3,318 USD, the long idea becomes invalid
Best entries should be supported by price action signals such as pin bar, bullish engulfing, or other reversal candles near support
Conclusion: A buy position in the 3,322 – 3,323 USD zone presents a reasonable strategy as long as the support holds. If bullish reaction occurs, price may revisit the 3,340 resistance area in the short term.
Save this strategy if you find it useful, and stay tuned for more real-time trade ideas and insights.

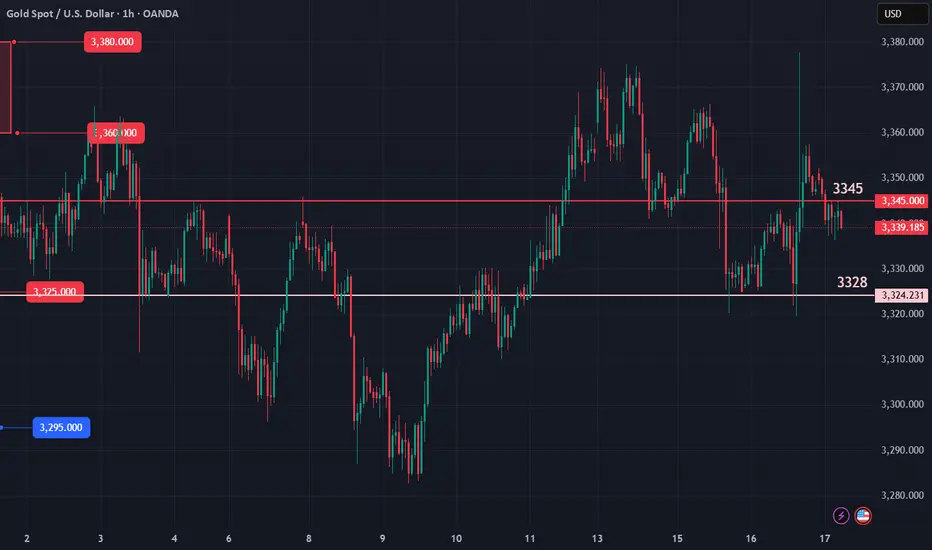
XAUUSD what's going on? sittuation for 17/07/2025🔹 Current Price Action (M30 & H1):
Price is stuck in a tight range between 3335–3345.
Volume is dropping — showing no strong pressure from either buyers or sellers.
%R indicator is in the oversold zone (below -80), but there’s no sharp bounce yet.
On H1, there's a weak attempt to recover — small candles with upper wicks = uncertain growth or selling pressure at highs.
🔍 Possible Scenarios for Today:
✅ Scenario #1: Fake Breakout Down, Then Reversal Up
If price holds above 3329–3331 and we see a strong bullish candle with volume, it might be worth trying a long.
🎯 Targets: 3348, then 3355
🛑 Stop-loss: below 3328
⛔ Scenario #2: Break Below 3328, Move Lower
If M30 or H1 closes confidently below 3328, that could signal a drop towards 3315–3305.
Look to short on the retest of the broken level.
🎯 Targets: 3316, then 3306
📌 Priority Right Now:
We're in balance — no clear bias.
But if we break and hold below 3328, shorts become more attractive.
If price breaks and holds above 3345, that opens up upside potential.
Gold (XAU/USD) Technical Outlook: July 17, 2025🔷 Market Context and Current Price
As of July 17, 2025, gold (XAU/USD) is trading near $3,341, slightly above the week’s midpoint. The metal remains range-bound but shows signs of bullish resilience as it tests key structural support zones. Today’s analysis integrates advanced technical methodologies — including Price Action, Fibonacci tools, ICT and Smart Money Concepts — to present a clear directional bias and actionable trade ideas.
📊 4‑Hour Chart Analysis
1️⃣ Price Structure & Trend
Gold has maintained a sideways-to-upward bias, consolidating between $3,320 (support base) and $3,377 (range resistance). Higher lows since early July reinforce the short-term bullish narrative, though price remains capped by supply in the upper 3,370s.
No decisive Break of Structure (BOS) has yet occurred, keeping price within this range. However, minor bullish BOS signals have appeared near $3,332–$3,334, with a confirmed Change of Character (CHOCH) around $3,320–$3,324, as buyers repeatedly defended this level.
2️⃣ Smart Money Concepts & ICT Insights
Demand Zone / Order Block (OB): $3,332–$3,334. This zone aligns with a recent fair value gap and bullish order block.
Supply Zone / OB: $3,355–$3,359, corresponding to prior inefficiencies and institutional selling.
Liquidity Levels: Sell-side liquidity was swept near $3,320 earlier this week, suggesting smart money accumulation below prior lows.
Fair Value Gap (Imbalance): Present at $3,332–$3,333, partially filled and offering a strong risk-reward for long setups.
3️⃣ Fibonacci Levels
Using the recent swing low ($3,320) and swing high ($3,377), Fibonacci retracements show:
38.2%: ~$3,342 — currently being tested.
50%: ~$3,348 — an interim bullish target.
Fibonacci extensions project potential upside toward $3,401 if momentum strengthens beyond the range top.
4️⃣ Key Levels Summary (4H)
Zone Level
Demand / Buy Zone $3,332–$3,334
Structural Support $3,320
Interim Pivot $3,340–$3,342
Supply / Sell Zone $3,355–$3,359
Range Ceiling $3,375–$3,377
🔷 Directional Bias and Strategy
The 4-hour structure remains neutral-to-bullish, favoring upside so long as the $3,332–$3,334 demand zone holds. A confirmed BOS above $3,342–$3,344 could accelerate bullish momentum toward $3,355–$3,360 and even $3,375. Conversely, a breakdown below $3,332 risks revisiting $3,320 and potentially $3,300.
⏳ 1‑Hour Chart – Intraday Trade Setups
The 1-hour timeframe reveals tactical opportunities aligned with the broader bias:
Setup Direction Entry Stop Loss Take Profit
Setup A – Smart Money Long Long $3,334 $3,329 $3,348 / $3,355
Setup B – Breakout Long Long $3,344 (after breakout) $3,340 $3,355 / $3,375
Setup C – Range Short Short $3,355–$3,359 $3,362 $3,340 / $3,332
🏆 The Golden Setup
Setup A – Smart Money Long offers the highest statistical edge:
Entry: $3,334 (at demand OB / FVG)
Stop Loss: $3,329 (below structure)
Take Profits:
TP1: $3,348 (pivot)
TP2: $3,355 (supply zone)
R:R Ratio: ~2.8:1
This setup benefits from multi-timeframe confluences: demand zone, fair value gap, bullish CHOCH, and proximity to BOS, making it a high‑conviction trade.
🔷 External Consensus Check
An alignment scan of professional analyst views shows strong consensus:
Buy interest remains concentrated around $3,332–$3,335.
Profit-taking and caution advised as price approaches $3,355–$3,377.
No notable divergence in professional outlook — most remain cautiously bullish above $3,332.
📜 Summary Report
✅ Bias: Neutral-to-bullish above $3,332; downside risk below.
✅ Key Levels: $3,332–$3,334 (buy zone), $3,355–$3,359 (sell zone), $3,375–$3,377 (range ceiling).
✅ Top Trade: Long from $3,334 with stops under $3,329 and targets at $3,348/$3,355.
✅ Alternate Trades: Breakout long above $3,344 or short from supply near $3,355.
✅ Confidence Zones: Buyers dominate above $3,332; sellers reappear above $3,355.
Conclusion
Gold remains in a well‑defined range, with smart money likely accumulating near the lower boundary at $3,332. With structural supports intact and demand zones respected, the path of least resistance favors cautious upside toward $3,355 and possibly $3,375. Intraday traders are advised to focus on precise execution within the outlined confidence zones, maintaining discipline around stops and targets.
The current market structure rewards patience and alignment with institutional footprints — positioning ahead of breakout confirmation, while respecting range extremes.

Gold (XAUUSD) – 17 July Analysis | Demand Zone in Play🟢 Gold (XAUUSD) – 17 July Analysis | Demand Zone in Play
Gold continues to follow the bullish structure we’ve been tracking in our recent posts. Yesterday's news-driven price action pushed the market to a new swing high near 3377.600 , confirming strength in higher timeframes. Now, price is currently in a retracement/pullback phase , pulling back toward a key intraday demand zone at 3326–3320 — offering potential opportunity for the next leg upward.
🔍 Where Are We Now?
The market is currently pulling back toward a key M15 demand zone: 3326–3320 . This level also aligns with a higher timeframe order block on the H4, making it a critical confluence area for structure-based traders.
This 3326–3320 zone is crucial because:
→ It’s a fresh M15 demand zone inside a higher timeframe bullish structure
→ It aligns with the H4 OB that previously acted as a launchpad
→ The overall trend remains bullish unless this zone is decisively broken
If the zone holds and we get LTF confirmation (such as M1 internal structure shift + micro-BoS), it may present a high-probability long setup.
⚙️ Structure Summary:
✅ H4: Bullish continuation structure with recent higher high
✅ M15: Pullback within bullish order flow
✅ M1 (for entry): Awaiting ChoCH + BoS as entry trigger inside POI
📌 Trade Setup Plan (upon confirmation):
→ Entry: From 3326–3320 demand zone
→ Stop Loss: 40 pips below entry
→ Take Profit: 120 pips (targeting new HH based on H4 projection)
→ Risk-to-Reward Ratio: 1:3
🧠 Key Trading Insight:
We never predict — we prepare .
We don’t chase price — we position with confirmation .
Discipline means waiting for price to invite us in , not entering just because a level looks attractive.
📈 Summary & Expectations:
➡️ Price is retracing into a structurally significant demand zone
➡️ Market bias remains bullish unless this zone fails
➡️ If the zone holds with valid M1 confirmation, we’ll consider a long setup targeting a new high
➡️ No confirmation = no trade. Patience > prediction.
📘 Shared by @ChartIsMirror
This analysis is part of our ongoing structure-based approach to trading Gold. All entries are derived from pure price action, multi-timeframe structure alignment, and trader discipline — as taught in our book:
“The Chart Is the Mirror: Mastering Gold with Structure, Stillness, and Price Action”
