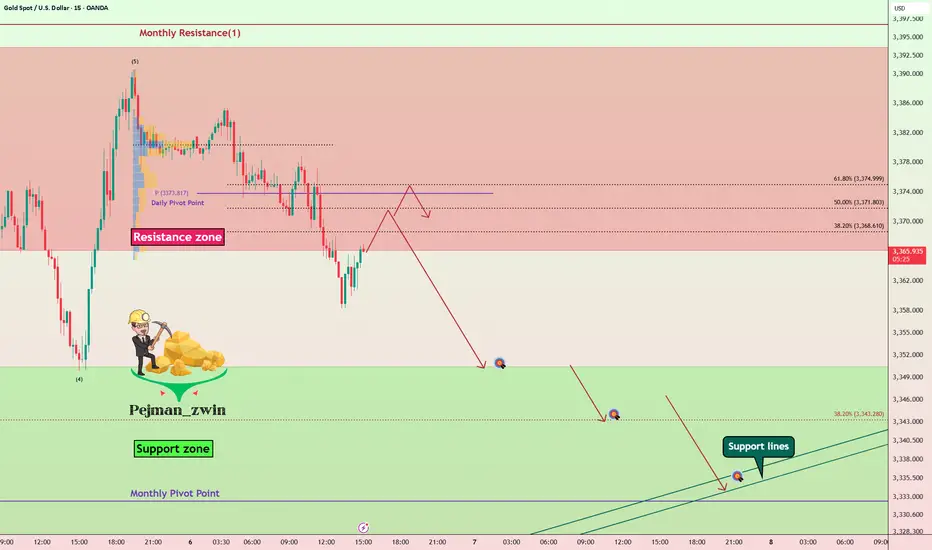
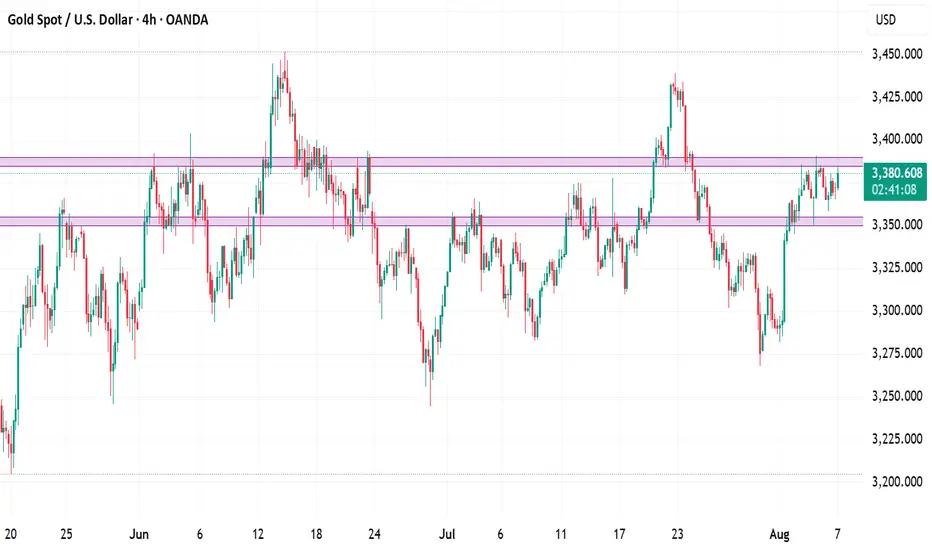
Gold Roadmap — Short termGold ( OANDA:XAUUSD ) rose to $3,383 as I expected in yesterday's idea .
Gold is currently moving in the Resistance zone($3,393-$3,366) .
In terms of Elliott Wave theory , it seems that Gold has completed 5 impulse waves , and we should wait for corrective waves on the 15-minute time frame .
I expect Gold to start declining from one of the Fibonacci levels and fall to at least $3,351 .
Second Target: $3,344
Third Target: Monthly Pivot Point/Support lines
Note: Stop Loss (SL) = $3,392
Gold Analyze (XAUUSD), 15-minute time frame.
Be sure to follow the updated ideas.
Do not forget to put a Stop loss for your positions (For every position you want to open).
Please follow your strategy; this is just my idea, and I will gladly see your ideas in this post.
Please do not forget the ✅ ' like ' ✅ button 🙏😊 & Share it with your friends; thanks, and Trade safe.
Xauusdanalysis
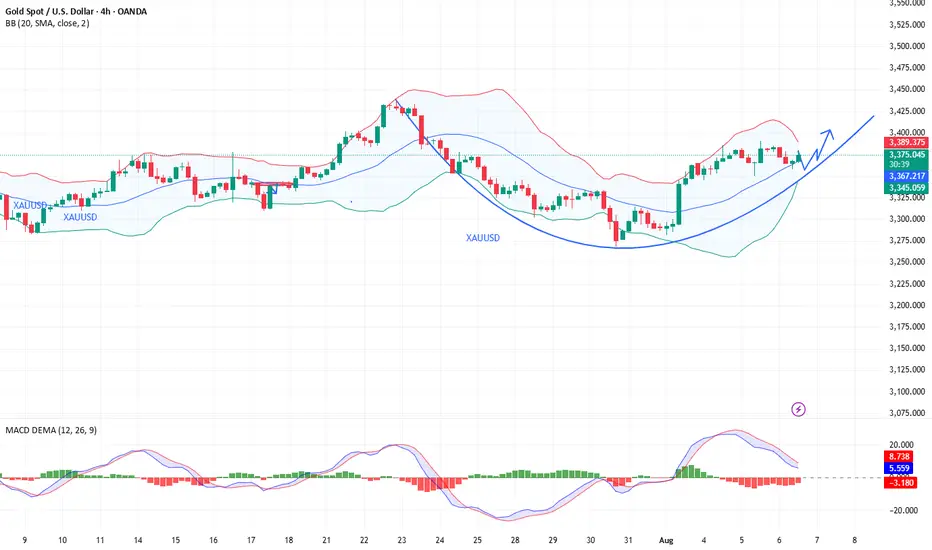
XAUUSD - 3400Technical picture
Bullish momentum is strengthening: US jobs shortage has caused an influx into safe havens, which has contributed to gold's growth
A reversal signal is forming: a bounce from the lower line of Bollinger Bands is observed, and a bullish cross of EMA-8 and EMA-21 is also forming, plus a moderately positive MACD - a classic "buy on dip" entry pattern
Key levels:
Support: around $3,330 - a support zone coinciding with the 21- and 50-day SMAs. Below — potential for decline to $3,297-$3,283
Resistance: $3,380 — resistance, breakout of which could open the way to $3,440-$3,450
Structural pattern: breakout from triangle to the downside could signal a deeper correction
Industry consensus: Citi has revised its target range up to $3,300-$3,600 in the next three months, based on a weak US economy and rising geo-risk
Meanwhile, HSBC warns of possible weakness — forecast for 2025-2026 from $3,215 to $2,350 in a more bearish scenario

Gold is under pressure. Can the upward trend continue?On Thursday, gold rose rapidly in the European session, reaching around 3397, but failed to successfully break through the 3400 integer mark; it currently fell back slightly and fluctuated around 3375. Judging from the 4-hour chart, the price is currently running close to the middle track of the Bollinger band; since the market opened this week, the gold price has continued to run above the middle track of the Bollinger band. Despite the slight decline, it has remained within the upward trend channel and has continuously set new highs.
The current upward pressure position remains at 3390-3400, and the key support level is around 3370, which is also the crossover position of the current MA5, 10, and 20 moving averages. The RSI indicator remains above its midline, indicating that bullish momentum remains.
Quaid believes that as long as the price remains above 3370 in the US session, any pullback will be a sign of accumulating upward momentum. Gold still has the trend of hitting the 3400 integer mark.
Trading strategy:
Go long near 3370, stop loss at 3360, profit range 3380-3390-3400.
Short near 3400, stop loss at 3410, profit range 3375-3365-3355.

Strike with precision and win in the gold trading market!Gold continues to fluctuate in an upward structure, with lows gradually rising, showing that the bulls are still in a dominant position. The current key support has moved up to the 3360 line. Before this position is effectively broken, the overall idea is to maintain a low-long strategy. It should be noted that the current market has been consolidating at a high level for three consecutive days, and has the basis for further strengthening. It is not advisable to wait for a sharp pullback at this time, but to pay attention to the continuity opportunities of direct pull-ups. It is recommended to seize the strong continuation opportunities in the current period in terms of operations, and strategically postpone it to the European and American trading sessions for simultaneous execution. Specifically pay attention to the long order layout opportunities in the support area of 3375-3360, and the upper resistance is around 3390-3405. Overall, we should flexibly participate in the high-altitude and low-long rhythm in this range. It is recommended to wait and see in the middle position, chase orders cautiously, and wait patiently for key points to enter the market.

XAUUSD Chart Analysis – Smart Money Concepts (SMC) Based🔍 XAUUSD Chart Analysis – Smart Money Concepts (SMC) Based
1. Market Structure Overview:
The chart clearly shows a bullish market structure forming after a sequence of Breaks of Structure (BOS) and Change of Character (CHoCH) events.
The market has consistently made Higher Lows, indicating strength from the bulls and institutional order flow to the upside.
2. Key Zones Identified:
✅ Strong Support Zone (Demand Area):
Around $3,260–$3,280, this level has been respected multiple times.
It is marked with BOS, CHoCH, and a Bullish Fair Value Gap (FVG) indicating institutional accumulation and unfilled orders.
The area also contains a Weak Low, which gives price a reason to stay above if bullish sentiment continues.
❌ Strong Resistance Zone (Supply Area):
Around $3,420–$3,460, this area shows signs of Level Rejection and is labeled with Buy-Side Liquidity.
This is where price previously reversed after grabbing liquidity—indicating distribution and possible shorting interest from smart money.
3. Liquidity Zones:
Buy-Side Liquidity: Above recent swing highs near $3,420–$3,440. Price tapped this level and sharply rejected.
Sell-Side Liquidity (Target Area): Currently aiming for the zone around $3,350, which aligns with a recent imbalance (FVG) and a clean liquidity pool below short-term higher lows.
4. Fair Value Gaps (FVGs):
A Bullish FVG is seen mid-chart, where price was rapidly driven up, leaving a gap—price later returned to this zone, respected it, and pushed higher again.
This is a strong sign of institutional entry and provides excellent long entries.
5. Trend Confirmation:
BOS + CHoCH + Higher Lows = Bullish Bias.
Each low is forming higher than the previous, with strong rejections from demand zones.
6. Entry & Target Insight:
Entry Point: After price reacted from support and printed another Higher Low.
Target: Currently price is targeting $3,350 (short-term retracement or pullback target).
This target is likely an internal liquidity sweep before potential continuation to retest the resistance zone again.
7. Educational Takeaways:
Market Structure is King: Observe BOS/CHoCH for directional bias.
Liquidity Matters: Understand where liquidity is resting—price seeks it.
FVG as Entry Tool: Fair Value Gaps provide high-probability trade setups when aligned with structure.
Patience at Key Zones: Wait for confirmations at resistance/support rather than impulsive trades.
✅ Summary:
Bias: Bullish, until structure breaks.
Short-Term Target: $3,350 (as per the chart).
Long-Term View: If price maintains higher lows, potential revisit to the resistance zone ($3,420–$3,460) is likely.
Invalidation Level: Break and close below strong support ($3,260) would shift bias.

XAUUSDHaving some SMC tecs counting with, Also with a harmonic pattern present, we'd say that it's time for the trend ends up.

XAU/USD 07 August 2025 Intraday AnalysisH4 Analysis:
-> Swing: Bullish.
-> Internal: Bullish.
You will note that price has targeted weak internal high on three separate occasions which has now formed a triple top, this is a bearish reversal pattern and proving this zone is a strong supply level. This is in-line with HTF bearish pullback phase.
Remainder of analysis and bias remains the same as analysis dated 23 April 2025.
Price has now printed a bearish CHoCH according to my analysis yesterday.
Price is now trading within an established internal range.
Intraday Expectation:
Price to trade down to either discount of internal 50% EQ, or H4 demand zone before targeting weak internal high priced at 3,500.200.
Note:
The Federal Reserve’s sustained dovish stance, coupled with ongoing geopolitical uncertainties, is likely to prolong heightened volatility in the gold market. Given this elevated risk environment, traders should exercise caution and recalibrate risk management strategies to navigate potential price fluctuations effectively.
Additionally, gold pricing remains sensitive to broader macroeconomic developments, including policy decisions under President Trump. Shifts in geopolitical strategy and economic directives could further amplify uncertainty, contributing to market repricing dynamics.
H4 Chart:
M15 Analysis:
-> Swing: Bullish.
-> Internal: Bullish.
H4 Timeframe - Price has failed to target weak internal high, therefore, it would not be unrealistic if price printed a bearish iBOS.
The remainder of my analysis shall remain the same as analysis dated 13 June 2025, apart from target price.
As per my analysis dated 22 May 2025 whereby I mentioned price can be seen to be reacting at discount of 50% EQ on H4 timeframe, therefore, it is a viable alternative that price could potentially print a bullish iBOS on M15 timeframe despite internal structure being bearish.
Price has printed a bullish iBOS followed by a bearish CHoCH, which indicates, but does not confirm, bearish pullback phase initiation. I will however continue to monitor, with respect to depth of pullback.
Intraday Expectation:
Price to continue bearish, react at either M15 supply zone, or discount of 50% internal EQ before targeting weak internal high priced at 3,451.375.
Note:
Gold remains highly volatile amid the Federal Reserve's continued dovish stance, persistent and escalating geopolitical uncertainties. Traders should implement robust risk management strategies and remain vigilant, as price swings may become more pronounced in this elevated volatility environment.
Additionally, President Trump’s recent tariff announcements are expected to further amplify market turbulence, potentially triggering sharp price fluctuations and whipsaws.
M15 Chart:

The bullish trend remains unchanged, seize the opportunityAfter today's opening, gold continued the bullish trend of yesterday. Judging from the daily line, gold has continued to rise, and it may only be a matter of time before it reaches a higher level. Judging from the 4H chart, the technical indicators are dead cross and shrinking, and the flexible indicators are repairing upward. The short-term middle track support is around 3372, and the upper side pays attention to the short-term pressure of 3395-3405. If the European session fails to effectively break through the short-term resistance, it will give the opportunity to test the 3380-3370 support again. If it is not broken, you can consider continuing to go long.
OANDA:XAUUSD

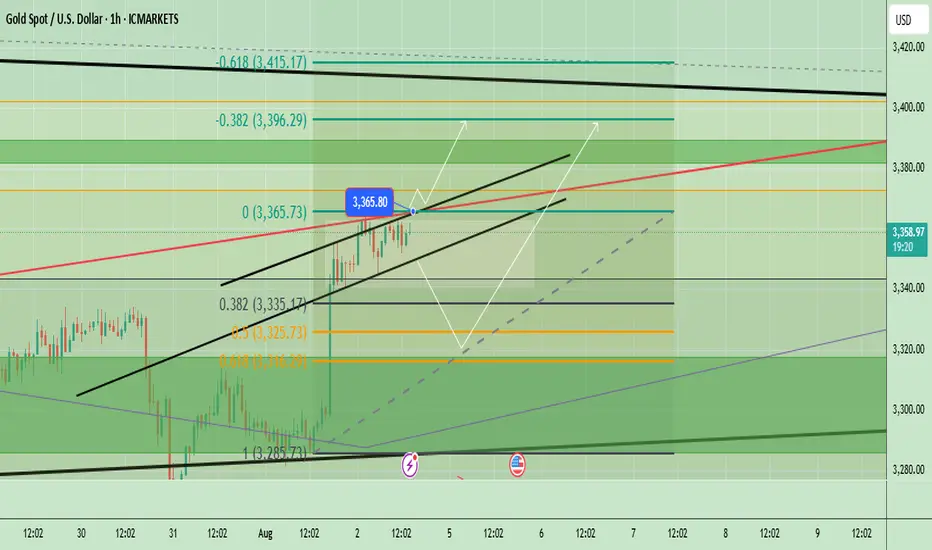
Gold Technical Analysis - Testing Key ResistanceGold has been showing a short-term bullish momentum after bouncing from the 3285 support zone, forming an ascending channel visible on the chart. The price is currently trading near 3361, close to the upper boundary of the channel and a key horizontal resistance level at 3365–3370. If the bullish momentum continues and price breaks above 3365–3370, we could see further upside toward 3396 and potentially 3400+. However, a failure to hold above this level could trigger a short-term retracement toward 3335–3325 support.
📈 Potential Scenarios:
- Bullish: If price sustains above $3,365, we could see an upside push toward $3,396 and possibly higher to $3,410 resistance.
- Bearish: A rejection near the channel top or $3,365 may lead to a pullback toward $3,325 (Fib 0.5) and then $3,285 support.
🔑 Key levels to watch:
- Upside: $3,365 → $3,396 → $3,410
- Downside: $3,335 → $3,325 → $3,285
- Trend Bias: Short-term bullish as long as price stays above 3325
Note
Please risk management in trading is a Key so use your money accordingly. If you like the idea then please like and boost. Thank you and Good Luck!
XAUUSD rises due to tariff wars and weak economic dataXAUUSD rises due to tariff wars and weak economic data
Gold climbed to 3,380.00 level on August 7, hitting a two-week high, as renewed U.S. tariff threats and expectations of Federal Reserve rate cuts in September and December boosted its appeal. President Trump announced 100% tariffs on imported semiconductors (excluding U.S.-made), 25% on Indian imports, and 50% on select Brazilian goods. Additionally, Weak U.S. economic data and a cooling labor market further support gold’s rise.
Technically, price has formed the Pennant chart pattern right below the local resistance of 3,380.00. Further breakout of the level and ascending towards 3,440.00 level is expected in short-term.

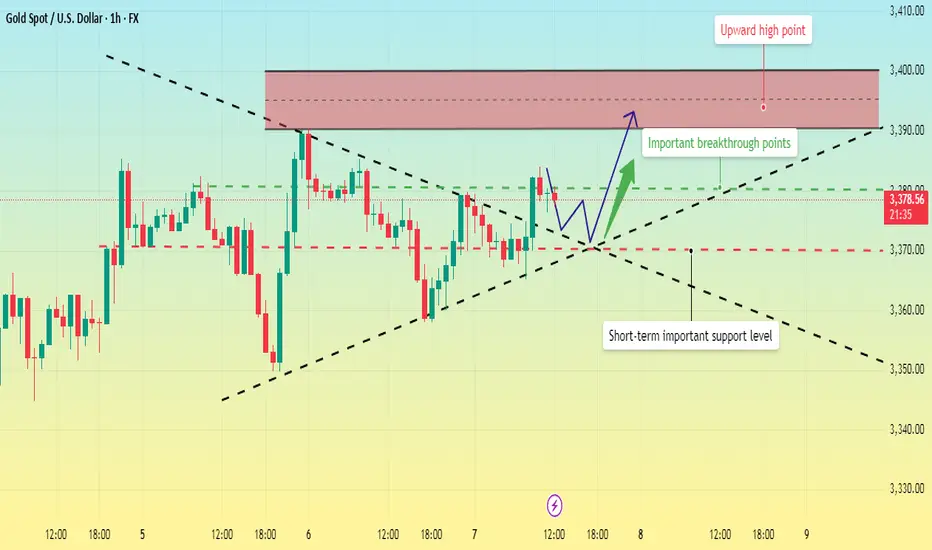
Gold Technical Analysis - Bullish Momentum or Pullback Ahead?Gold (XAU/USD) is trading around $3,371, showing a bullish bias within an ascending channel. Price is consolidating below key resistance at $3,384, and a breakout above this level could lead to a rally toward $3,400–$3,429. On the downside, support lies at $3,340 and $3,312; a break below these could trigger a deeper pullback toward $3,268. The trend remains bullish above $3,340, with buy interest expected on dips, while a confirmed breakdown below $3,268 would shift momentum in favor of bears.
🔑 Key Levels to Watch:
- Resistance: $3,384 → $3,396 → $3,429
- Support: $3,360 → $3,340 → $3,320
📈 Potential Scenarios:
- Bullish: If gold holds above $3,340 and breaks above $3,384, it may rally toward $3,400–$3,429, with potential to reach $3,450+. This keeps the uptrend intact.
- Bearish: If rejected from $3,384, gold could dip to $3,340–$3,312 for a healthy correction before possibly bouncing again. Trend remains bullish unless lower supports break.
📊 Trend Outlook:
- Short-Term Trend: Bullish while inside or above the rising channel
- Medium-Term Trend: Neutral to Bullish; watch for breakout confirmation above $3,384
- Momentum: Consolidating, with potential for a breakout after current sideways structure
Note
Please risk management in trading is a Key so use your money accordingly. If you like the idea then please like and boost. Thank you and Good Luck!

Daily Gold Mapping (XAUUSD) — 7 August 2025
Market Bias: Bullish with Short-Term Rejection Possibility
Key Levels to Watch:
Resistance Zone (H4 Fresh Supply)
3383 - 3386
- Price is approaching a fresh H4 resistance area.
- We are eyeing this zone for a potential short-term rejection or pullback, suitable for scalping short entries.
- However, this zone is not a confirmed reversal unless price gives clear bearish structure.
Support Zone (H4 Demand + Double Bottom)
3362.5 - 3359.5
- A solid H4 support base has formed here.
- Double bottom structure hints at strong bullish sentiment from buyers defending this area.
- If price returns to this zone, we anticipate potential buy entries as continuation of bullish trend.

Gold – Bulls Hold the Line, Pressure Builds for Upside BreakoutIn yesterday’s analysis, I argued that following Tuesday’s reversal — which printed a strong continuation bullish Pin Bar — buyers had regained control despite the intraday pullback.
For this reason, I suggested looking to buy dips, as the structure remained constructive.
And once again, during yesterday’s session, the scenario repeated itself.
The drop toward the 3360 zone was met with renewed buying interest, keeping the bullish structure intact.
________________________________________
🔍 Technical Context – Higher Lows Building Pressure
At the time of writing, Gold is trading around 3380, a short-term resistance area that has capped gains so far.
However, the technical picture remains bullish:
Starting with Monday’s low at 3340, which came after a strong impulsive leg up, price has printed a clear succession of higher lows.
This behavior strongly suggests increasing buying pressure and builds the case for a potential breakout to the upside.
________________________________________
🎯 Trading Bias – Holding My Long Position
My bias remains bullish.
In fact, I’m currently holding a long position, entered yesterday, which is now running with a 150 pips unrealized profit.
I’m sticking with the trade, anticipating that a confirmed break above 3380–3390 could trigger upside acceleration toward my final target — a 750 pips profit objective.
________________________________________
🔄 What to Watch Next
• Daily close: A close above 3380=3385 zone would add confirmation to the bullish thesis.
• Key support: The zone around 3360 is now support.
• Breakout trigger: A move above 3380–3385 could unleash momentum buying and open the path to higher levels.
________________________________________
Let’s stay patient and let the market confirm the breakout.
Until then, the structure favors the bulls. 🚀
Disclosure: I am part of TradeNation's Influencer program and receive a monthly fee for using their TradingView charts in my analyses and educational articles.

Gold Consolidates at High Levels. Waiting for a New Trend?Gold barely held the 3360 level on Wednesday and will remain in the 3360-3380 consolidation range outlined by Quaid.
Quaid considers Thursday to be a more important day. From a timing perspective, today may impact whether gold can continue its upward trend. However, it is possible that the market could continue its consolidation today. One thing is that the daily line must close above 3360, then the subsequent rise in gold will continue.
On the contrary, if it closes below 3360, then the rise will definitely not be able to continue in the short term. In the short term, gold may remain above 3370 today.
We can see that 3375-3370 is an important support, but the daily line has not yet stabilized above 3380, so the upward space has not yet been opened. If the daily chart can stabilize above 3380, then a test of 3400-3410 is in the cards.
Trading strategy:
Buy between 3365-3370, stop loss at 3355, profit range 3380-3390-3400.
Institutional Gold Strategy Note – August 7, 2025🔍 Executive Summary
Gold (XAU/USD) continues to hold firm above the $3,370 handle, supported by a bullish macro narrative and confirmed technical structure on the 4-hour chart. Amid dovish expectations from the Fed and soft labor market data out of the U.S., bullion maintains its premium as a hedge, attracting institutional flow in line with the rate-cut narrative for Q3–Q4.
Today’s market profile suggests a high-probability long setup, anchored in a fresh demand structure just below current price, supported by unmitigated institutional order flow, premium discount levels, and clear liquidity sweeps.
🎯 Directional Bias: Bullish–Transitional
While price is consolidating around $3,378, the underlying structure favors a bullish continuation. A Change of Character (CHoCH) has been confirmed on the 4H chart, suggesting a shift from corrective to impulsive intent. Liquidity remains stacked below recent equal lows, and the premium-to-discount array strongly favors buy-side execution.
🟩 Primary Buy Zone (GOLDEN ZONE)
Entry: $3,350–$3,355 | Stop-Loss: < $3,340 | Targets: $3,400 / $3,430
This zone represents the highest institutional quality setup of the day. It aligns with:
A fresh unmitigated Rally-Base-Rally Demand Zone
A refined Bullish Order Block within optimal trade entry (OTE) discount range
A Fair Value Gap (FVG) aligned with internal BOS leg
Equal Lows (EQL) sweep below $3,355, targeting liquidity
Overlap with volume imbalance, suggesting a clean institutional leg
Clear CHoCH confirming bullish structure
Kill Zone Alignment: Asia–London overlap, pre-London accumulation
This zone is statistically favored for execution by both Smart Money and legacy institutions, given its confluence density and asymmetrical risk profile.
🟥 Primary Sell Zone
Entry: $3,385–$3,390 | Stop-Loss: > $3,400 | Targets: $3,350 / $3,320
A valid counter-trend liquidity sweep opportunity, located above short-term equal highs near the psychological $3,400 level. Key confluences include:
Drop-Base-Drop Supply Zone
Overlapping FVG + OB in premium zone
Alignment with OTE premium retracement
Liquidity cluster near recent EQH
Structural resistance + round-number magnetism
Execution window during London–NY overlap
This zone is valid only for short-duration scalps or short-term reversal positioning.
🟢 Fallback Buy Zone (If Primary is invalidated)
Entry: $3,320–$3,325 | SL: < $3,310 | TPs: $3,400 / $3,430
A deeper mitigation zone with reduced confluence but adequate historical support. This zone captures:
A mitigated OB inside Demand
0.618 Fib retracement from internal BOS
Liquidity sweep potential of a broader EQL stack
Minor structure support
Use only if the market sweeps the primary zone and rebalances deeper.
🔻 Fallback Sell Zone (If Primary Sell fails)
Entry: $3,410–$3,415 | SL: > $3,420 | TP: $3,350
Set well above prior resistance, this extended zone aligns with:
Extended Supply + Unmitigated OB
FVG inside premium OTE zone
Recent accumulation liquidity trap (potential fakeout zone)
Session mispricing during NY–Asia rollover
Use only if price impulsively breaches the $3,400 psychological barrier and stalls near the top of an exhaustion leg.
🌐 Institutional Cross-Validation
Citi Group has upgraded its 3-month Gold forecast to $3,500, citing weakening U.S. macro data and elevated inflation expectations as bullish catalysts.
Reuters and FXStreet confirm Gold's hold near 1-week highs with sentiment strongly skewed toward continued demand amid Fed rate-cut odds exceeding 90%.
TradingView pro charts show confluence with OB/FVG zones at both $3,355 and $3,390, validating both primary zones technically.
📌 Final Notes
Action Bias:
Aggressively long from $3,350–$3,355 with tight structure-defined invalidation.
Hold shorts only from $3,385–$3,390 under strict reversal logic.
Risk Reminder:
All zones are built from 4H structural flow only. Intraday volatility outside kill zones may distort price behavior — wait for displacements and internal breaks before entering. Manage partials at 1.272 extension and hold runners toward 1.618 only if structure confirms.
XAUUSD LONG SETUPhere we go again⏰
Analysis
>Monday price closed in breakout off previous week Friday's high making it day 2 of breakout.(friday was day 1 of breakout)
>Tuesday price closed as a fake out high.
>Wed price closed inside Tuesday price range (inside bar/day) 💰
>The fib retracement is based off Tues range and shifted to have its center at tues high.The values are based off hipoplaka's goldbach values with a little twist
anticipating the continuation of the bull trend: previous month high or all time high?

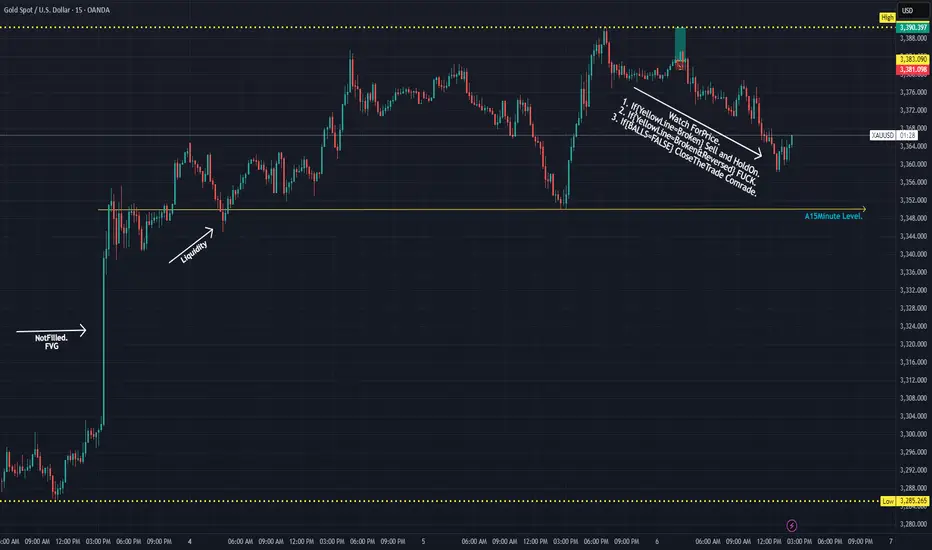
GOLD 15MInute PLan. Enjoy..So the Image is Simple as it is.
Currently @15$ gonna keep trading it.
Started @10$ Last Night.
Gold Bulls Unshaken, 3400 in FocusGold prices retreated from a high of 3385 today, currently hitting a low near 3358. How far will gold fall? Are the bears back in control? I'm not worried about a gold pullback, but rather a lack of one, because only a pullback can provide a good entry opportunity. Clearly, I remain bullish on gold and optimistic about it reaching the 3400 mark.
Because gold fell all the way to around 3358, some voices in the market began to tout the strong return of the bears, but I remained unmoved. When many people were once in self-doubt, I was quietly taking advantage of the gold pullback to accumulate funds in batches and pick up bargains. We can clearly see that gold did not destroy the bullish structure during the decline, and as gold rebounded, the 3360-3350 area has become a dense trading area, indicating strong buying support. After the technical top and bottom conversion, it has become a relatively solid support area. It may be difficult for gold to fall below this support area in the short term.
So, why has gold repeatedly encountered resistance and retreated? I believe that gold has encountered resistance and retreated in the 3385-3390 area many times in order to repeatedly test the effectiveness of support and consolidate the strength of support. It is also to increase liquidity during the retreat period, thereby accumulating more upward momentum so that gold can rise further and break through the 3400 mark.
So I still hold a long position in gold, and I have not lost confidence in the gold bulls. On the contrary, I still expect that gold will be able to hit 3400 in one fell swoop after repeatedly testing the support, or even continue to rise to the 3420-3430 area.

Gold Price Trend Analysis and Trading Guidance (Exclusive)📣📣📣A technical analysis of gold's recent performance reveals that it has formed a four-day winning streak, demonstrating the strength of the upward trend and indicating that short-term upside potential has not yet been exhausted. Of note, the upper Bollinger Band at 3430 on the daily chart is acting as a key resistance level, and this level is likely to be tested this week. However, when it comes to a sharp rise in the market, there is no clear signal at present. We need to wait for the opening pattern of the daily Bollinger band to be confirmed before we can open up a new round of upward space.🧐🧐🧐🤔🤔🤔
Switching to the H4 cycle for observation, the unilateral upward trend continues to consolidate, the moving average system shows a perfect upward divergent arrangement, the Bollinger Bands simultaneously maintain an open state, and a short-term high pressure is formed near the upper rail of 3415. Based on this, the bullish logic for gold remains unchanged on Wednesday, with the intraday high range likely to be between 3415 and 3430. There's no need to overestimate whether the price will break through previous highs at this point, and trading strategies should be adjusted dynamically based on real-time market performance. From a short-term perspective, intraday support should focus on two key levels: 3360 and 3350.
👊👊👊On the operational level, it is recommended to adopt a strategy of placing long orders in batches when the price falls back to the 3365-3360 range, relying on the support level to seize the opportunity of trend continuation.⭐️⭐️⭐️
⚠️⚠️⚠️The market is risky, so participate rationally. If you need real-time trading references and trading advice, please leave a message to Charlie.🛫🛫🛫 FOREXCOM:XAUUSD VELOCITY:GOLD PEPPERSTONE:XAUUSD CMCMARKETS:GOLD ICMARKETS:XAUUSD CMCMARKETS:GOLD FXOPEN:XAUUSD
Gold Price Analysis August 6In the Tokyo session this morning, gold recorded some selling pressure after strong buying pressure in the US session yesterday promoted profit-taking sentiment. It is expected that prices may continue to correct during the Asia-Europe session today before potential buying pressure returns in the London session.
Trading plan:
Scalping SELL: 3375
Support zone to watch for BUY: 3346 – 3333 – 3315 (priority when there is a clear price rejection signal)
Upside target: 3420

Prices are suppressed. Will they rise amidst volatility?Information Summary:
Trump's upcoming appointment of Federal Reserve officials has the market on the sidelines, leading to a pullback in gold prices, but bullish sentiment remains.
Quaid believes that most investors are closely watching the White House's upcoming Federal Reserve appointments and any trade-related news, which could have a significant impact on market sentiment.
Furthermore, market expectations for a September rate cut are high. After last week's weak jobs report, investors are pricing in an 87% chance of a September rate cut, according to the CME FedWatch tool. Following the release of the report, Trump fired the director of the Bureau of Labor Statistics, further exacerbating policy uncertainty.
As a traditional safe-haven asset, gold generally performs better in environments with increased political and economic uncertainty and low interest rates.
Market Analysis:
Gold prices retreated slightly on Wednesday, but Quaid believes there is still room for further gains, with a short-term target of 3,400. Supporting factors include: continued tariff friction; slowing economic growth and inflation concerns; and a weak US dollar.
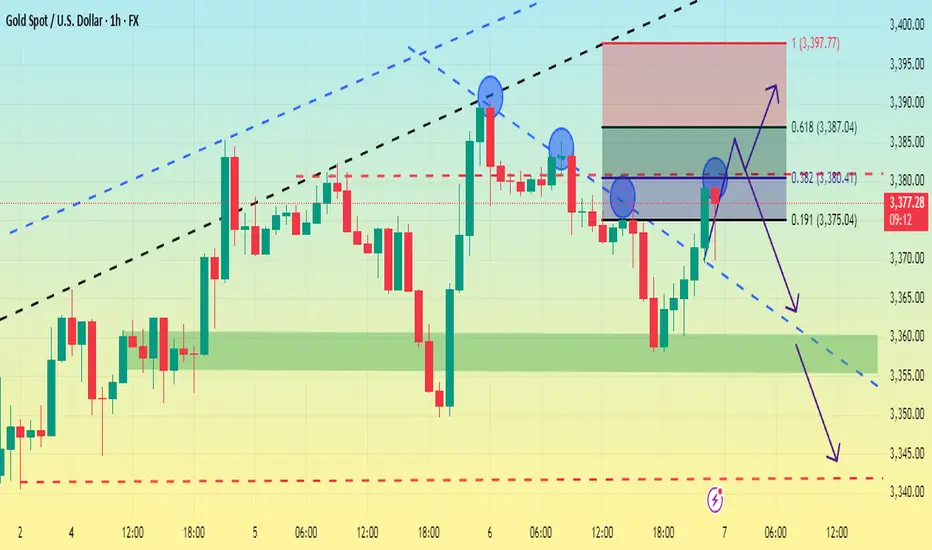
Looking at the hourly chart, the Fibonacci 0.382 position is right around 3380. Moreover, the top of the trend line of gold's bottoming rebound is also at this position, so if the pressure of 3380 cannot be broken through, we need to be alert to the possibility of a pullback.
Next, keep an eye on 3360. If gold can't break through 3380, it may consolidate between 3360 and 3380.
If bears continue to push down the price below 3360, a test of 3340 is possible.
XAUUSD – Bears Gave It a Shot, But Bulls Still in Control1. Quick recap of yesterday
In yesterday’s analysis, I highlighted the possibility of a short-term correction on Gold and noted that, although risky, a short trade could be justified. Acting on that conviction, I took a short with a sniper entry, capturing over 250 pips in floating profit. However, Gold found strong support around 3350 and reversed aggressively. I closed the trade with a more modest +140 pips gain.
2. Key development: NY session reversal
Despite early signs of weakness, the New York session flipped the script, sending Gold back toward the top of the daily range. The daily close near highs tells us one thing:
➡️ The bulls aren’t done just yet.
3. Technical outlook
• Resistance remains firm at 3375–3380+ zone
• A clear breakout above this zone opens the door for 3400+, with a likely magnet at 3430
• As long as the market holds above this week’s low, dips are buyable opportunities
4. Trading plan
For now, the bias shifts back to the long side. I’m watching for intraday dips to build longs, with invalidation below this week’s low. The structure favors continuation — but only if 3380 gives way we have confirmation.
5. Final thoughts
Gold may have teased the bears, but the real power still lies with the bulls. If momentum kicks in above 3380, we could be on our way to test 3430 soon. 🏹
Disclosure: I am part of TradeNation's Influencer program and receive a monthly fee for using their TradingView charts in my analyses and educational articles.

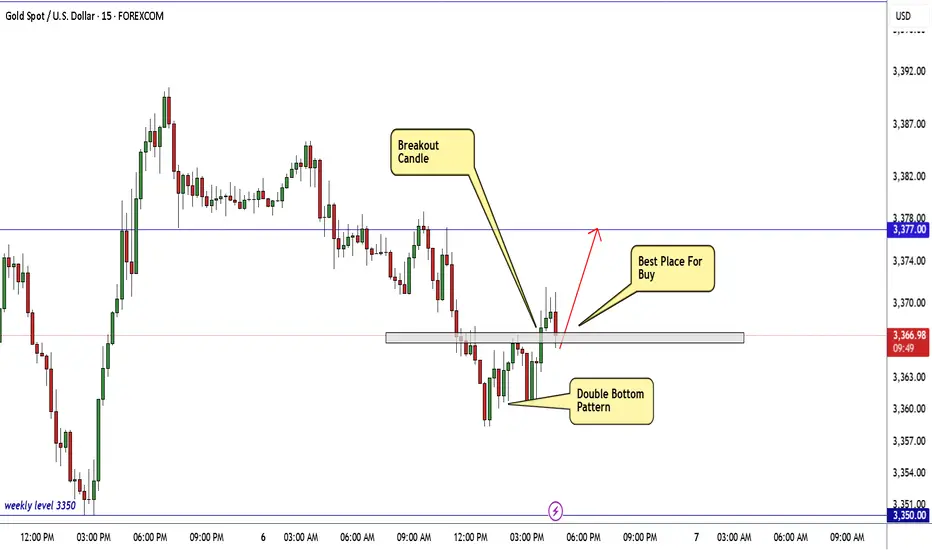
GOLD Ready To Go Up From Current Price , 150 Pips WaitingHere is My 15 Mins Gold Chart , and here is my opinion , we finally above 3365.00 and we have a 30 Mins Candle closure above it And Perfect Breakout , so we have a good confirmation now to can buy it and we can targeting 100 to 150 pips .
Reasons To Enter :
1- New Support Created .
2- Bullish Price Action .
3- Bigger T.F Giving Good Bullish P.A .
4- Clean Breakout .
5- Reversal Pattern .