7.9 Latest gold trend analysis and operation layout📰 News information:
1. Federal Reserve meeting minutes
📈 Technical Analysis:
Our decision to close our positions at 3305 yesterday was undoubtedly a very strategic one. After reaching a high of around 3310 last night, it began to fall. At the same time, I also gave VIP members the news that it might fall back to around 3300. Since the opening, the lowest point has reached around 3285. The overall trend is still under our control.
At present, gold will still usher in technical corrections in the short term. The current price of 3293-3290 support can be considered for long positions. If the European session continues to fall below the low, you can try to go short during the NY session. If the European session continues to maintain sideways consolidation, you can consider retreating and going long during the NY session. As long as the key support of 3250 below is held, gold will maintain its consolidation trend in short-term trading. On the contrary, once it falls below 3250, gold may directly touch the 3200 mark. Focus on the minutes of the Federal Reserve meeting, which may further influence the trend of gold.
🎯 Trading Points:
BUY 3293-3290-3285
TP 3305-3310-3320
In addition to investment, life also includes poetry, distant places, and Allen. Facing the market is actually facing yourself, correcting your shortcomings, facing your mistakes, and exercising strict self-discipline. I share free trading strategies and analysis ideas every day for reference by brothers. I hope my analysis can help you.
Xauusdanalysis

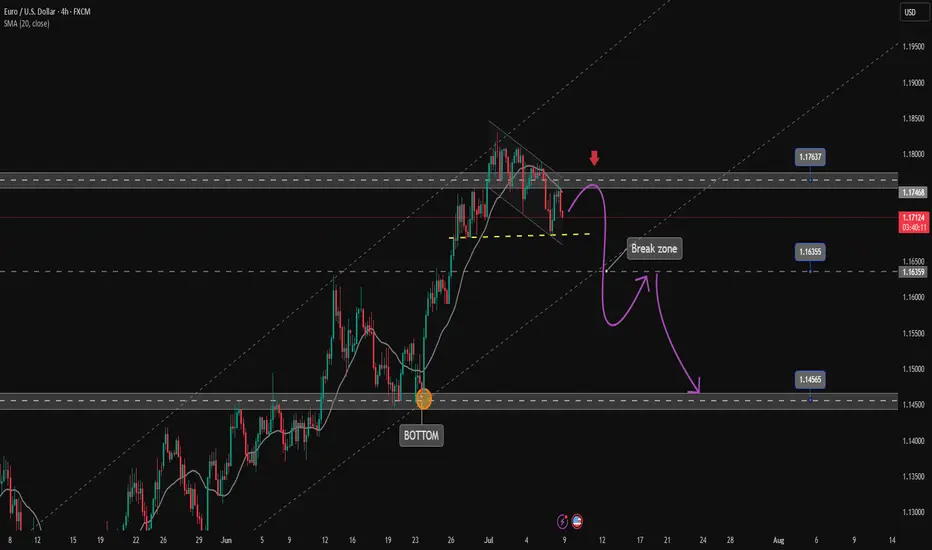
Confirming EURUSD corrective downtrend✏️EURUSD is trading in a downtrend channel. SELL signal is triggered at the current price around 1.172 as the H4 candle failed to break 1.176 and confirmed the Sellers' entry into the market clearly. Target for the downtrend is at 1.145, the Sellers' strength needs to overcome the Break out zone of 1.163 first.
📈 Key level
Support 1.163-1.146
Resistance 1.176
SELL DCA Trigger: Break 1.163
BUY Trigger: The price trades about 1.163.
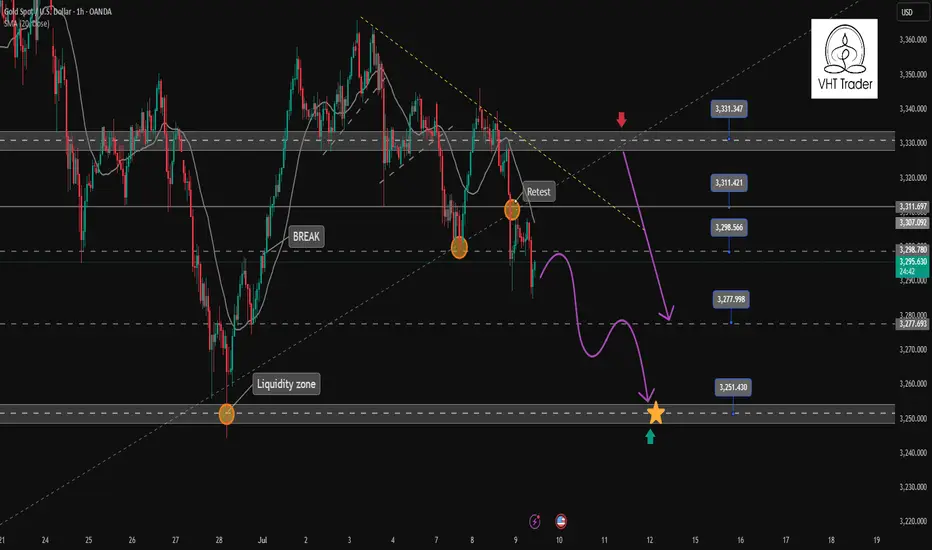
Gold continues downtrend today✏️#GOLD view
Yesterday's D1 candle confirmed the decline in gold prices when the selling pressure returned below the liquidity candle wick. The extension of the downtrend will continue today.
Yesterday's strong support zone 3297 has become today's resistance zone, this is the SELL point today when there is confirmation from the selling side in this zone.
3310 The confluence resistance zone between the trendline and the US Session Resistance is noted in today's SELL strategy. The previous SELL Target 3352 orders pay attention to the reaction at 3377.
📈Key Level
SUPPORT 3277-3250
RESISTANCE 3297-3310-3328
SELL Trigger: Price cannot break 3297
SELL DCA Trigger: Break 3276
Target: 3250
BUY Trigger:PriceTrading above 3276
Leave your comments on the idea. I am happy to read your views.
XAUUSD - UniverseMetta - Signal#XAUUSD - UniverseMetta - Signal
H4 - Rebound from the channel border towards the formation of a potential 3rd wave on D1. Stop behind the local minimum.
Entry: 3297.457
TP: 3330.716 - 3390.419 - 3439.762 - 3487.197
Stop: 3279.737

GOLD - at resistance ? Holds or not??#GOLD.. .market perfect dropped below our area that was around 3320
Now market bounced back and just near to his resistance area 3295 96
That will be market final area and only holdings of that region means another drop expected.
Note: we will plan for cut n reverse above that region.
Good luck
Trade wisely
Gold price drops to 3250Today's daily line is in the negative, rebounding in the morning, and the high point yesterday morning was 3310, and the bearish point is also at this point. It is higher than the 382 line of yesterday's decline and rebound, 3307. After the morning rebound, the current decline formed a morning downward trend. The watershed is 3308-10, today's short stop loss position. The market fell in the morning, and the strength of the rebound should not be strong. The top and bottom conversion position is 3297-98. The European session broke the bottom, and the US session continued to fall. The next double bottom support is around 3275. If the rebound is in place, it is still bearish, and the decline continues. 3258-60 line.

XAUUSD Trade Setup Short📉 Trade Idea: Sell XAU/USD
Entry Zone: 3290–3293
Stop Loss (SL): 3300 (tight risk cap above resistance)
Take Profit (TP): 3270 (next support level)
🔍 Explanation:
🟠 Trade Logic:
Expecting price to reject 3290–3293, possibly a minor resistance zone or lower high in a downtrend.
A break below 3290 signals weakness continuation, with sellers in control.
TP at 3270 targets the next meaningful support area, offering a decent reward.

Big day for xauusd (gold)today fed (fomc ) will change the game , so i provide the level on chart. please check that levels . chart say #xauusd touch the level 3264 on negative news that level for buy and positive news for #gold 3296 and 3307 level and next t day 3328 and 3343 . so all thing on fed sir. and i am going for buy . thanks

gold on buy retrace#XAUUSD buy on 2 times breakout above 3300. The bullish needs formation there to start buying.
Buy limit 3300 on 2 times breakout, target 3316-3328, stop loss 3290.
Below 3287 holds bearish continuation if the m30-H1 closes below there target 3267.

Data is about to be released. Where will gold go?Yesterday, the market expected a trade agreement between the United States and its trading partners, which boosted risk sentiment, and the strengthening of the US dollar and the rise in US bond yields further added pressure on gold prices. Gold fell 1% during the day and once lost the $3,300 mark during the session.
After gold bottomed out and stabilized at 3,320 on Monday, it fell sharply above 3,320 again on Tuesday and has now completely fallen below 3,320. The position of 3,320 is very important. In the 3,320-50 range, it chose to break down at 3,320 again.
Today, the Federal Open Market Committee of the United States will release the minutes of the June monetary policy meeting. Although Federal Reserve Chairman Powell remained neutral on the June interest rate decision, many Federal Reserve officials released dovish signals. Federal Reserve Board member Bowerman has turned to support the possibility of a rate cut in July.
From a technical point of view, the market has penetrated into the area around the lower support of 3,275-3,295.
The rhythm of the entire market is still a process of oscillating decline. From the perspective of pressure position, the daily MA5 average line has not fallen below, and may fall again to around 3270. Once the market falls too fast and approaches this position, there is a high probability that there will be a rebound demand.
Operation strategy:
Buy near 3375, stop loss at 3365, profit range 3315-3320.
Continue to hold position after breakthrough.

GOLD SHORT TRADE Gold Short Trade Setup !
Gold Sweep Liquidity And Make A Market Structure MSS + LIQUIDITY + FVG !
Se We Are Selling Gold At FVG Area
Giving You Signal Guys !
Gold Sell FVG ( 3315 - 3325 )
Stoploss : ( 3331 )
Target Level : 3310, 3305, 3300, 3290, 3280
Hop You Got The Signal Enjoy it See You In Another Setup !

The Federal Reserve meeting is the highlightAfter the gold price surged in the morning yesterday, it started the shock-washing mode. In the evening, the price broke through the expected range, fell below the key support of 3297, and continued to fall to the 3287 line. This trend directly destroyed the rising structure of the right shoulder in the 4-hour head and shoulders bottom pattern. The daily line finally closed in the negative, suggesting that the short-term market has signs of weakening. At present, gold has gradually left the previous shock range, and the K line is suppressed by the short-term moving average, and the weak trend is obvious. At the daily level, it is necessary to pay attention to whether there will be a second decline after the rebound is confirmed. On the 4-hour chart, although the price fluctuates in a narrow range, the rebound strength and continuity are insufficient, and the short-term decline space may not be fully released. At present, the upper resistance is 3300-3307, and the lower support is 3280-3277. It is recommended to do more on the callback and rebound high as a supplement.

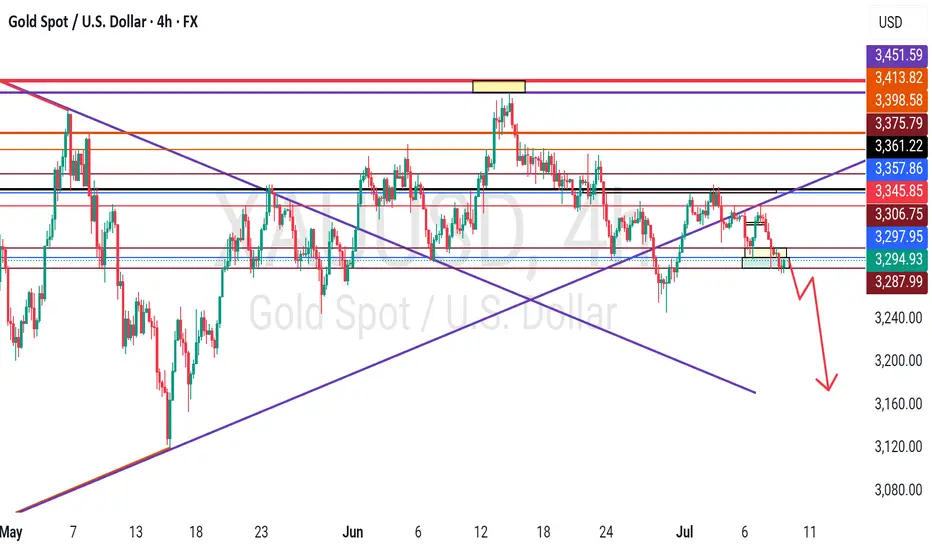
(XAU/USD – Gold vs US Dollar on 4H timeframe)(XAU/USD – Gold vs US Dollar on 4H timeframe), the analysis shows a bearish setup with a breakdown from the ascending trendline and confirmation below the Ichimoku cloud.
1. First Target: 3,220
2. Second Target: 3,180
3. Final Target Zone: 3,130 – 3,100
Note.
Price has rejected from the resistance zone (highlighted in yellow).
Break below support and cloud suggests bearish momentum.
The blue box (around 3,240–3,250) seems to be a possible retest zone before continuation downward.
📉 Bias: Bearish
If price stays below 3,250, these targets remain valid. Watch for retest failures or strong rejection candles to confirm entries.
Let me know if you want SL (stop-loss) or entry suggestion too.

XAUUSD Analysis todayHello traders, this is a complete multiple timeframe analysis of this pair. We see could find significant trading opportunities as per analysis upon price action confirmation we may take this trade. Smash the like button if you find value in this analysis and drop a comment if you have any questions or let me know which pair to cover in my next analysis.

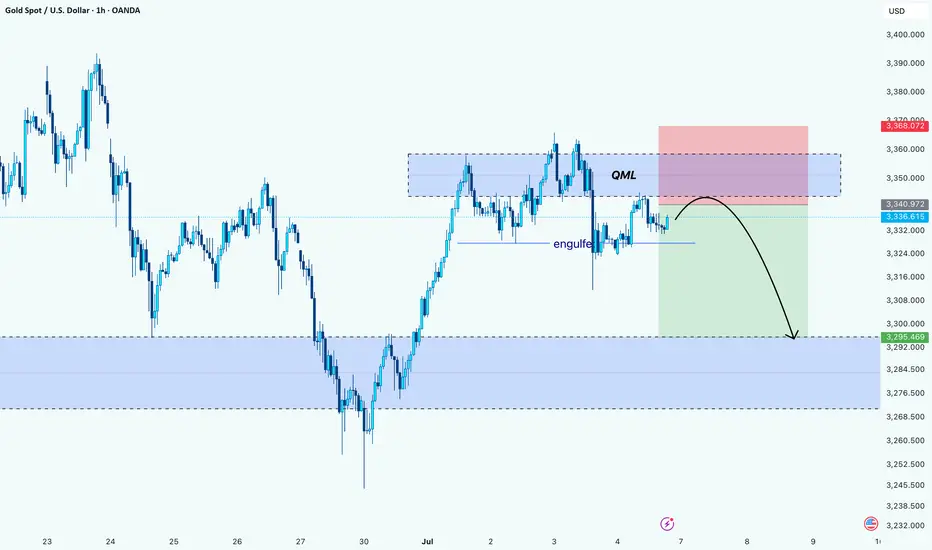
Gold’s Trap Above QML: Bearish Play UnfoldingHello Guys!
Gold appears to be forming a textbook Quasimodo reversal setup after printing a lower high into a key supply zone. Price aggressively tapped into the QML area (around 3,350–3,360), where sellers previously stepped in, and we’re now seeing signs of rejection.
The engulf zone marked earlier confirms bearish intent. It broke structure and flipped momentum. Price is currently retesting below that engulf level, likely as a last attempt to grab liquidity before heading down.
The projected move suggests a drop toward the next significant demand zone around 3,295–3,285, where the price previously found a strong bullish reaction.
Bias: Bearish below QML
Target: 3,295 zone
Invalidation: Above 3,368 (high of supply zone)
Is a Reversal on the Horizon or a Deeper Correction? 🔘Gold Faces Strong Resistance at 3300 – Is a Reversal on the Horizon or a Deeper Correction? ⭐️
Gold has recently faced a significant price correction after bouncing off key resistance levels. As geopolitical events settle and economic data comes in, the market is now testing crucial support levels. Today’s session could provide important insights into whether gold will maintain its bullish momentum or continue to correct further.
🔹Market Overview – USD Rebounds, Creating Short-Term Pressure on Gold
The US dollar has seen a strong rebound following positive developments in the global trade talks. Several key agreements between major nations, including the US, have been signed, which seem to support the USD in the short term. This has put downward pressure on gold, as traders shift their focus towards a stronger dollar and risk appetite returning to the market.
🔹US inflation data has come in lower than expected, creating room for the Fed to hold off on rate hikes, which helps the dollar further.
🔹FOMC meeting minutes later this week could reveal insights into the Fed's stance on interest rates, which could be key for market direction.
🔹Geopolitical tensions are cooling off slightly, which has reduced demand for safe-haven assets like gold.
🔹Technical Analysis – Gold in a Range-Bound Market, Testing Key Levels
On the H1 chart, gold is forming a clear downward channel between 3360 and 3290, suggesting that the price could continue its correction within this range. If the price stays within this zone, we might see a deeper pullback toward the 3250 region.
However, as always, waiting for confirmation signals before entering any trades is crucial. The false breakout risk is high when the price moves quickly and without clear confirmation from higher timeframes.
🔹Buy Bias in the Short-TermGiven the current technical structure, a buy bias seems more likely than further selling. The market may test 3320-3325 in the near term, with the potential to bounce back if the buying momentum continues to build. Additionally, the rejection wick on the D1 candle from yesterday suggests that sellers are losing control, and we may see more buying pressure in the coming sessions.
🔹Resistance and Support Levels to Watch:
🔺Key Resistance Levels: 3302 – 3310 – 3324 – 3335 – 3361
🔻Key Support Levels: 3275 – 3259 – 3248
⬜️Trading Strategy – Buy and Sell Zones
🔺BUY ZONE:3250 – 3248
🔹Stop Loss: 3244
✔️Take Profit: 3254 → 3258 → 3262 → 3266 → 3270 → 3280 → ????
🔺SELL SCALP: 3303 – 3305
🔹Stop Loss: 3310
✔️Take Profit: 3298 → 3294 → 3290 → 3286 → 3280 → 3270 → 3260
🔺SELL ZONE:3334 – 3336
🔹Stop Loss: 3340
✔️Take Profit: 3330 → 3326 → 3320 → 3315 → 3310 → 3305 → 3300 → ????
🕖Important Notes for Today: FOMC and Trade Policy Updates
With FOMC minutes and other important trade policy updates expected today, it’s crucial to stay alert for any sudden changes in market sentiment. Always ensure that you are adhering to your TP/SL levels to safeguard your account.

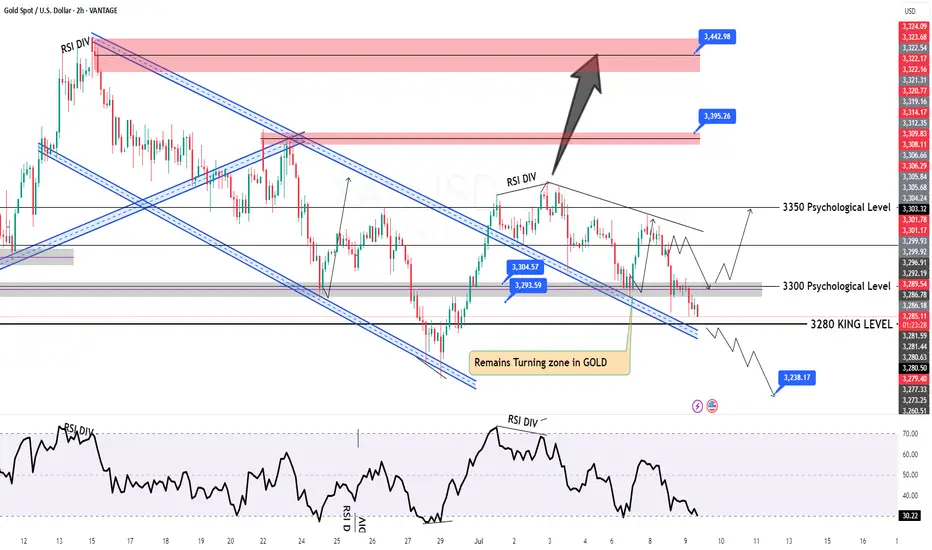
GOLD Intraday H2 Chart update for 9 July 2025Hello Traders
as you can see that we have strong resistance on 3310 level only break above that level will consider bullish move
Below 3300 Psychological level market remains Bearish and move towards 3245 level
FOMC Meeting minutes dues today
Disclaimer: Forex is Risky
XAUUSD Loses Short-Term Support – Deeper Decline May FollowGold (XAUUSD) is showing clear signs of short-term weakness after losing a key support zone around 3,287 USD – which previously aligned with the rising trendline and the 61.8% Fibonacci retracement level (3,295.20 USD) of the prior downward move.
1. Price Structure and Current Pattern:
Price has formed a descending triangle and just broke below its lower boundary with strong bearish candles.
Consecutive bearish candles with short lower wicks indicate strong selling pressure with little buying interest.
After being rejected at 3,304.25 USD – the most recent swing high – price has dropped toward the 0.0% Fibonacci level at 3,280.57 USD.
2. Fibonacci and Key Price Zones:
The 3,295.20 area (Fibo 0.618) has now become a strong resistance after a failed recovery attempt.
The 3,280 – 3,275 zone is the next target for bears if no strong reversal appears in upcoming sessions.
A break below 3,275.73 may open the path for further downside toward 3,268 – 3,260.
3. Trendlines and Candle Behavior:
The short-term rising trendline (in red) has been broken alongside increasing sell volume.
The upper descending trendline (in light blue) remains intact, confirming that the overall structure is still bearish.
Suggested Trading Strategy:
Sell on rallies: Prefer short entries around 3,290 – 3,293, with a stop loss above 3,296.
Short-term target: Look for potential take-profit zones at 3,275 – 3,268.
Avoid bottom fishing unless there’s a strong bullish reversal signal such as an engulfing or hammer candle backed by volume.
Conclusion:
Gold is under visible downside pressure below key technical resistance. If the price fails to hold above 3,280, the downtrend could extend further. Traders should remain cautious of weak pullbacks and look to enter in line with the dominant bearish trend.

XAU/USD 09 July 2025 Intraday AnalysisH4 Analysis:
-> Swing: Bullish.
-> Internal: Bullish.
You will note that price has targeted weak internal high on two separate occasions forming a double top which is a bearish reversal pattern. This is in-line with HTF bearish pullback phase.
Remainder of analysis and bias remains the same as analysis dated 23 April 2025.
Price has now printed a bearish CHoCH according to my analysis yesterday.
Price is now trading within an established internal range.
Intraday Expectation:
Price to trade down to either discount of internal 50% EQ, or H4 demand zone before targeting weak internal high priced at 3,500.200.
Note:
The Federal Reserve’s sustained dovish stance, coupled with ongoing geopolitical uncertainties, is likely to prolong heightened volatility in the gold market. Given this elevated risk environment, traders should exercise caution and recalibrate risk management strategies to navigate potential price fluctuations effectively.
Additionally, gold pricing remains sensitive to broader macroeconomic developments, including policy decisions under President Trump. Shifts in geopolitical strategy and economic directives could further amplify uncertainty, contributing to market repricing dynamics.
H4 Chart:
M15 Analysis:
-> Swing: Bullish.
-> Internal: Bullish.
H4 Timeframe - Price has failed to target weak internal high, therefore, it would not be unrealistic if price printed a bearish iBOS.
The remainder of my analysis shall remain the same as analysis dated 13 June 2025, apart from target price.
As per my analysis dated 22 May 2025 whereby I mentioned price can be seen to be reacting at discount of 50% EQ on H4 timeframe, therefore, it is a viable alternative that price could potentially print a bullish iBOS on M15 timeframe despite internal structure being bearish.
Price has printed a bullish iBOS followed by a bearish CHoCH, which indicates, but does not confirm, bearish pullback phase initiation. I will however continue to monitor, with respect to depth of pullback.
Intraday Expectation:
Price to continue bearish, react at either M15 supply zone, or discount of 50% internal EQ before targeting weak internal high priced at 3,451.375.
Note:
Gold remains highly volatile amid the Federal Reserve's continued dovish stance, persistent and escalating geopolitical uncertainties. Traders should implement robust risk management strategies and remain vigilant, as price swings may become more pronounced in this elevated volatility environment.
Additionally, President Trump’s recent tariff announcements are expected to further amplify market turbulence, potentially triggering sharp price fluctuations and whipsaws.
M15 Chart:

XAUUSD SELL ANALYSIS SETUP READ (CAPTION)hi trader's. what do you think about gold
current price: 3293
gold is breakout low 3289 in (H1) candle pettran and now gold resistance zone 3295 and 3308 and gold is reject this area and create sell candle then gold fall down
resistance zone: 3295-3308
target : 3270-3250
stop loss: : 3310
please don't forget to like comment and follow thank you

XAUUSD 15Min – Bullish Reaction from Demand Zone | SMC AnalysisSmart Money Concept (SMC) Analysis
Price has tapped into a clearly defined 4H Demand Zone (highlighted in green) with multiple rejections. Prior liquidity was swept below the 3288 region, trapping early sellers and grabbing institutional interest. This is a classic liquidity grab + demand zone confluence.
🔹 Entry: 3290 – Inside Demand Zone
🔹 SL: 3282 – Below Liquidity Sweep
🔹 TP: 3320 – Targeting Last Broken Structure (Break of Structure)
🧠 Smart Money Clues:
Liquidity grab under the lows ✅
Clean rejection wick ✅
BOS (Break of Structure) above needed for confirmation
Anticipating move back to 3320.57 (blue line) – previous SMC mitigation level
🟢 If price breaks above 3300 with strong volume, more upside is likely.
#XAUUSD #GoldAnalysis #SmartMoney #SMC #DemandZone #LiquidityGrab #TradingView #ForexSignals

Focus on the Fed meeting minutesFrom a technical perspective, the trend of gold is obviously weak. In the morning trading yesterday, the price of gold failed to continue the previous day's rise, and the rebound high kept moving down. After breaking the key support level during the US trading session, it accelerated downward, and the daily line closed with a big negative line, and the short-selling force had the upper hand. Today's closing situation is crucial. If it continues to close with a negative line, the short-term downward trend may be established. The minutes of the Federal Reserve meeting will also bring new variables to the gold market. The policy direction may further affect the trend of gold prices. At present, the upper resistance is 3303-3308, and the lower support is 3284-3278. It is recommended to do more on the callback.
Operation strategy: It is recommended to do more on the callback of 3280-3275, with a target of 3295-3307 and a stop loss of 3370.

Buy Gold! The short-term bottom may have appeared!Gold continued to retreat yesterday and hit a recent low, reaching around 3287. Then gold gradually rebounded to above 3300. Relatively speaking, the rebound momentum was weak. It is expected that the long and short sides will fight fiercely around 3300. However, from the recent characteristics of gold operation, it can be seen that although the short position of gold is strong, it is difficult to continue in the short term, and I think the short-term decline of gold is basically in place, so at this stage, in terms of short-term trading, I do not advocate shorting gold directly;
As gold did not continue to fall after reaching around 3287, on the contrary, it gradually rebounded to above 3300, which may strengthen the market's consensus on the short-term bottom, thereby attracting the favor of off-site funds; from the current gold structure, if gold can maintain above 3300-3295, it may be combined with the 3287 low to build a "W" double bottom structure, which is conducive to supporting the rebound of gold.
However, as gold fell below 3300 again, the bearish trend is relatively strong, so we need to moderately lower our expectations for a gold rebound. In the short term, gold is under pressure in the 3315-3325 area, so we can temporarily look to this area for the rebound target. Therefore, in short-term trading, I do not advocate shorting gold directly, and you can first consider going long on gold in the 3300-3295 area, TP: 3310-3320-3330.
