Gold Price Setup: Bullish Continuation or Rejection? 🧠 Chart Analysis (XAU/USD – 1H):
Key Structure Highlights:
CHoCH (Change of Character) zones marked both up and down indicate a battle between bulls and bears.
Recent bullish CHoCH followed by a fair value gap (FVG) retest suggests potential continuation to the upside.
Price recently bounced strongly from demand zone, shown by the green arrows and strong candle reaction.
Ichimoku Cloud:
Price is trying to break back above the Kumo (cloud), a sign of bullish momentum building.
However, resistance is still present with the Kijun and Tenkan lines converging.
FVG (Fair Value Gap):
The current price is attempting to fill and break above the FVG zone.
A successful breakout above this area confirms bullish intention.
Fibonacci Levels:
Price is hovering around the 0.5 - 0.618 retracement zone, often a strong reversal or continuation point.
Upside targets lie near the 0.786 retracement (3352) and ultimate target at 3391, a major resistance level.
Risk Management:
Trade setup shows an excellent Risk:Reward ratio.
Stop-loss placed just below the last structure low.
Potential downside to 3290–3258 if breakout fails.
🟢 Possible Next Move:
Bullish Scenario: If price clears the FVG and breaks above 3353, expect continuation to 3391.
Bearish Rejection: If rejected at FVG/0.618 level, watch for a drop back to 3290 or even 3259.
Xauusdanalysis

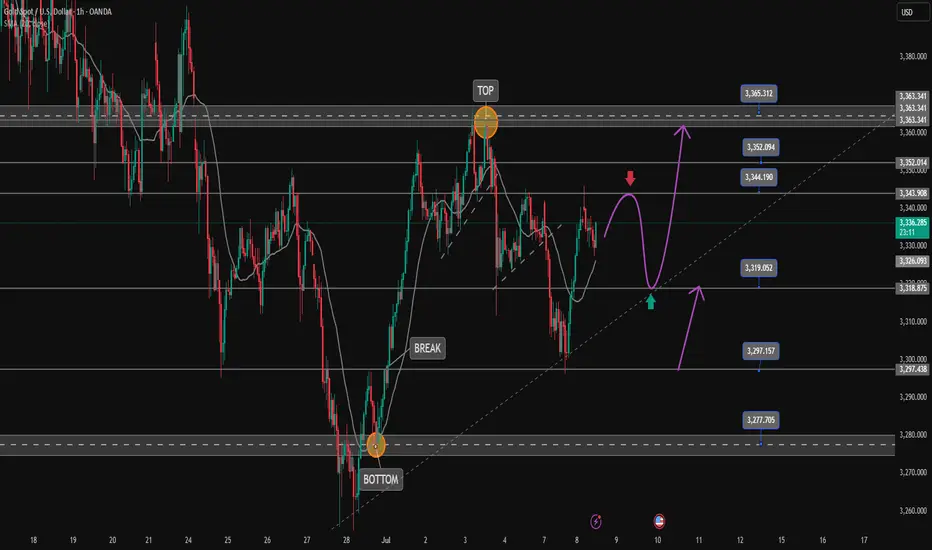
Gold is bullish and needs more momentum at 3320The buying pressure in the US session pushed the price up and formed a bullish hammer candle on D1. Today's bearish recovery is seen as a buying opportunity to head towards the uptrend again.
3344 is the immediate resistance zone in the European session that Gold faces. Breaking this resistance zone will head towards 3365. According to the wave structure, it would be great to have a retest of 3320 to find some buying momentum and then break 3344.
SUPPORT: 3320-3297
RESISTANCE: 3345-3352-3365
SELL Trigger: Break 3320 ( Trendline & break zone)
Do you have any comments on the trading plan? I would love to hear your views.
The shock continues, and the retracement continues to go long📊 Gold Day Trading Strategy (Recommendation index ⭐️⭐️⭐️⭐️⭐️)
📰 News information:
1. The lasting impact of new tariffs
2. The impact of geopolitical conflicts
3. The Fed’s interest rate cut
📈 Technical Analysis:
From the hourly chart, gold has formed a head and shoulders bottom. At present, 3320 below has formed a certain support in the short term. For now, the daily line still cannot close below 3320. If the daily line closes below 3320, the decline may open further. On the contrary, the current upper suppression position of gold is near 3350. If the daily line stands above 3350 again, it will be a bull-dominated trend and may test 3380-3390 above. In the short term, pay attention to the support line of 3325-3315 below. If it retreats to the support level, you can consider going long. Look to the resistance range of 3340-3350 above, and pay special attention to the suppression line of 3365-3370. At the same time, if the European session is always suppressed below 3345 and sideways, there is no performance, so you should consider selling it, and there may be further retreat in the evening.
🎯 Trading Points:
BUY 3330-3325-3315
TP 3340-3350-3365
In addition to investment, life also includes poetry, distant places, and Allen. Facing the market is actually facing yourself, correcting your shortcomings, facing your mistakes, and exercising strict self-discipline. I share free trading strategies and analysis ideas every day for reference by brothers. I hope my analysis can help you.
TVC:GOLD OANDA:XAUUSD FXOPEN:XAUUSD FX:XAUUSD FOREXCOM:XAUUSD PEPPERSTONE:XAUUSD

Gold Finds Supports – Is the Rebound About to Begin?Gold ( OANDA:XAUUSD ) declined to the Support zone($3,312-$3,290) and Support lines as I expected in the previous idea .
Gold is currently trading in the Support zone($3,312-$3,290) and near a set of support lines .
In terms of Elliott Wave theory , it seems that Gold has completed the Zigzag Correction(ABC/5-3-5 ) and we should wait for the next 5 impulse waves . One of the confirmation signs of the end of these corrective waves could be the break of the resistance line .
I expect Gold to trend higher in the coming hours and rise to at least $3,343 AFTER breaking the Resistance line .
Second Target: $3,364
Note: Stop Loss (SL) = $3,287
Gold Analyze (XAUUSD), 1-hour time frame.
Be sure to follow the updated ideas.
Do not forget to put a Stop loss for your positions (For every position you want to open).
Please follow your strategy; this is just my idea, and I will gladly see your ideas in this post.
Please do not forget the ✅ ' like ' ✅ button 🙏😊 & Share it with your friends; thanks, and Trade safe.

Gold Spot / U.S. Dollar (XAUUSD) 4-Hour Chart - OANDA4-hour chart from OANDA displays the price movement of Gold Spot (XAUUSD) against the U.S. Dollar. The current price is $3,805.780, reflecting a decrease of $30.660 (-0.92%). Key levels include a sell price of $3,305.390 and a buy price of $3,305.940. The chart highlights recent volatility with a shaded area indicating a potential support or resistance zone around $3,344.320. The time frame spans from late June to early July 2025, with the latest data point at 02:41:15 on July 8, 2025.

Setupsfx_ | XAUUSD(Gold):07/07/2025 Update | Gold dropped nicely when the market opened last night, dropping around 600 pips. However, it couldn’t hold on to the gains and came right back to the selling zone. There are two entry points and two potential targets.
Good luck and trade safely!
Team Setupsfx_

XAUUSD Breakout Done , Long Entry Valid Now To Get 150 Pips !Here is my opinion on Gold On 15 Mins , we have a very good closure with breakout candle and now the price retest the broken res and new support and we can enter a buy trade as a scalping , if we have a 4H Closure Below 3326.00 this idea will be not valid anymore.

GOLD ON BUY FROM 3316#XAUUSD price we expect drop till 3316 for bullish range to form.
Buy limit 3316-3315.5, target 3330, stop loss 3310.
Below 3306 holds bearish continuation, target 3290-3280.
Bullish range can form above 3330 on 2 times breakout, target 3345

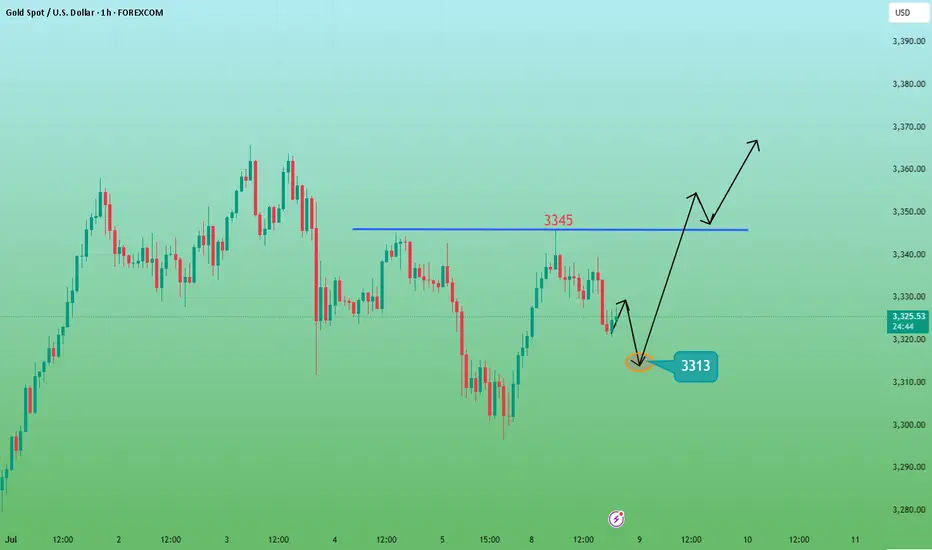
Gold price falls today and then looks bullish!Today, gold rose and fell back to 3345, which was the high point on Friday. It was suppressed and fell sideways.
From a technical point of view, the US market rose yesterday, and today's decline must continue to be bullish, but the position should not be too high or too low; if it is too high, there may be further decline, and if it is too low, there may be no reach.
The bullish position should be in line with the overall running rhythm of gold. Personally, I suggest that you can buy around 3320-3321, defend 3310, and target 3340-3345.
Focus on the rise of the European market. If the European market breaks through 3345 strongly, then you can continue to be bullish to 3360-3365; if the European market is always suppressed below 3345 and goes sideways, there is no performance, so you should consider selling, or there may be further retracement.
Put your thoughts in the comments section

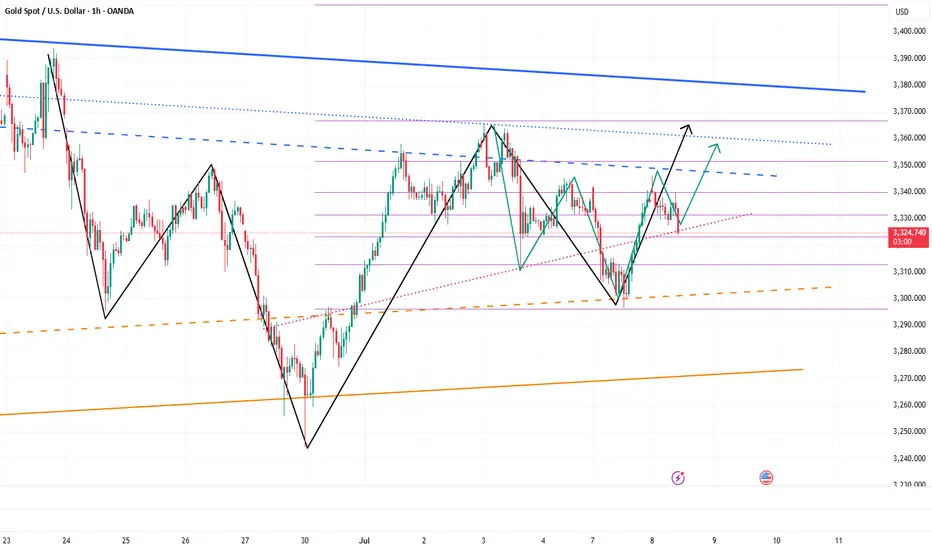
Gold is expected to regain bullish momentum and continue to 3360Yesterday, gold rebounded from 3296 and was able to reach around 3345. Although the process was rather painful, we have to admit that gold bulls still have the energy to wrestle with bears, and the gold market is not one-sidedly dominated by bears. As gold gradually tested and confirmed the effectiveness of support during the retracement process and then rebounded effectively, the short-term structure of gold gradually changed and began to favor bulls.
After gold hit bottom and rebounded yesterday, we can clearly see from the short-term structure that gold has successfully constructed a head and shoulders bottom structure in the three areas of 3295-3244-3296 in the short term, thus playing an absolute supporting role in the structure; and in the process of repeated testing of gold, there are signs of constructing a head and shoulders bottom structure in the three areas of 3310-3296-3325 locally again. Under the effect of the structural support resonance of the head and shoulders bottom, gold may not go below 3320 again, and may even regain the bullish trend and continue to the 3345-3355 area.
So I think there is a lot of profit potential in going long on gold. We can go long on gold with the 3330-3320 area as support and look towards the target area: 3340-3350-3360
Will gold continue to fall?Judging from the current trend of gold, it is weak in the early trading and continues to break lows in the European trading. Then there will be a second bottoming action in the US trading. Pay attention to the 3330 and 3335 areas for short selling before the US trading. Pay attention to the two support levels of 3318-3315 below. The market changes in real time, and it is recommended to operate in real time according to my prompts before the trading!
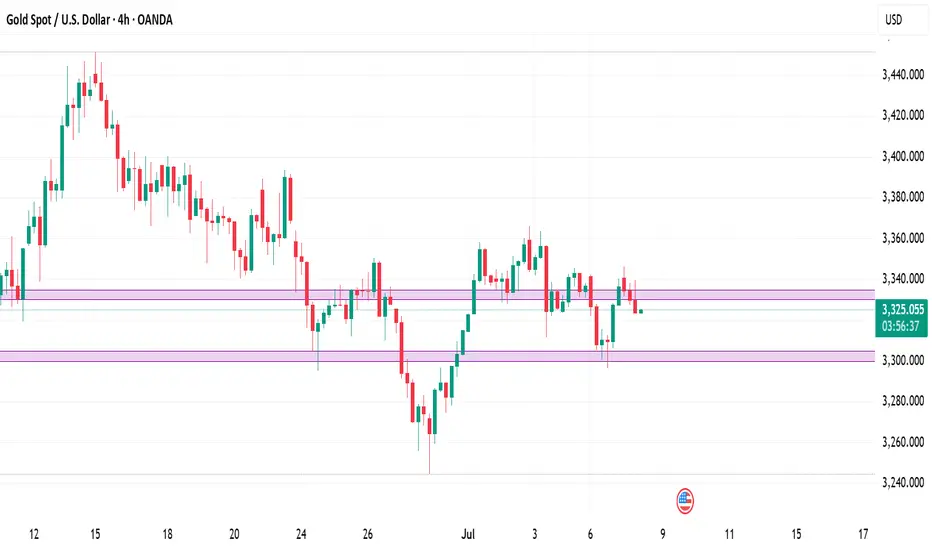
Gold Spot / U.S. Dollar (XAU/USD) 4-Hour Chart4-hour chart from OANDA displays the recent price movement of Gold Spot (XAU/USD) against the U.S. Dollar. The current price is $3,325.120, reflecting a decrease of $11.320 (-0.34%). The chart highlights a recent upward trend with a buy signal at $3,325.410 and a sell signal at $3,324.830, indicating a potential trading range. A shaded area suggests a possible price target or support/resistance zone around $3,355.478, with historical price levels marked on the right side. The timeframe covers the period around July 7-8, 2025.

XAUUSD Trading Strategy – July 8, 2025Gold (XAUUSD) is trading around 3,331 USD as global markets react to a series of critical economic data releases. The recent rally has brought prices back to a key resistance zone, but selling pressure remains strong due to the following factors:
- The Dollar Index (DXY) TVC:DXY holds steady near 97, its highest level in five weeks. A strong USD continues to weigh on gold, a non-yielding asset.
- U.S. 10-year Treasury yields remain stable at 4.35%, reinforcing expectations that the Federal Reserve will maintain higher interest rates for longer to tame inflation.
- Robust U.S. labor market data and June’s Core PCE figures staying above the Fed’s 2% target further reduce the likelihood of a rate cut in Q3 or Q4.
- Geopolitical tensions remain muted, with no significant escalations in the Russia–Ukraine conflict or Middle East unrest, weakening gold’s safe-haven appeal.
➡ Collectively, these factors suggest that gold’s recent rebound could be a technical pullback within a broader downtrend, unless a new catalyst drives a breakout.
1. XAUUSD Technical Analysis – Daily Chart (D1)
Price is currently testing the 3,331 – 3,340 USD resistance zone, which includes:
A previous supply zone that has rejected multiple rallies.
- Fibonacci retracement 0.5–0.618 from the recent high at 3,405 USD.
- A key Change of Character (CHoCH) area, where trend reversals have previously occurred.
- EMA20 and EMA50 remain aligned downward, confirming the dominant bearish trend.
- RSI hovers around 50 with signs of mild bearish divergence, reflecting weakening bullish momentum.
➡ The current price action fits a classic “sell on rally” setup, with repeated rejections at technical resistance zones.
2. Key Price Levels to Watch
Technical Significance
- 3,340 – 3,331 Confluence resistance (Fibo 0.5–0.618 + supply + CHoCH)
- 3,310 – 3,300 Nearest support – role reversal zone
- 3,275 – 3,260 Short-term target support – June’s low
- 3,223 – 3,205 Strong medium-term support – April’s low + extended Fibo
3. Suggested XAUUSD OANDA:XAUUSD Trading Strategy
Primary Strategy: SELL if price rejects 3,340 – 3,345
Entry: 3,340 – 3,345
Stop Loss: 3,356
Take Profit 1: 3,335
Take Profit 2: 3,330
Take Profit 3: 3,325
Ps : Gold is trading at a critical price zone. If XAUUSD fails to break above the 3,340 USD resistance, there’s a high probability of a pullback toward the lower support levels. Selling at resistance and targeting support remains the preferred approach in the current macro environment, which continues to favor bearish momentum.
This strategy will be updated regularly – save it and follow to avoid missing upcoming opportunities.
Analysis by @Henrybillion

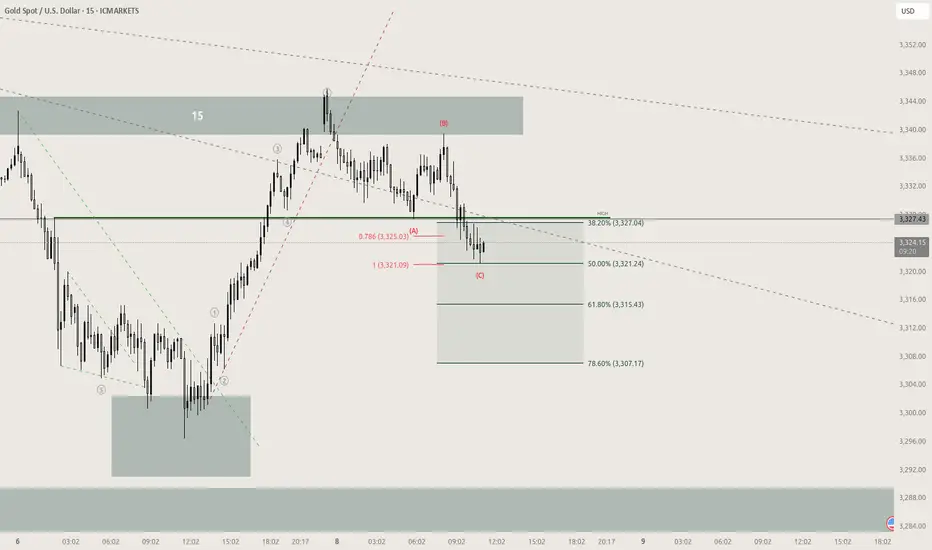
XAUUSD Short-Term Correction From the Top ZoneOn the 15-minute chart, XAUUSD showed a strong upward momentum starting below the 3,300 USD mark, reaching a peak near 3,346 USD. This rally was supported by a clear bullish structure and an ascending trendline.
However, once the price hit resistance at the top, selling pressure intensified, pushing the price into a downward correction. A clear pullback zone has formed between 3,346 USD and the support area around 3,318 USD — currently acting as a buy-side liquidity pocket.
Crucially, the price broke below the previous uptrend line and is now being capped by a descending resistance trendline, indicating a short-term bearish bias. Multiple failed attempts to break above the 3,332 – 3,335 USD area confirm that sellers still have the upper hand.
Additionally, the price action within this correction zone hints at a potential distribution pattern. Without strong buying interest to reclaim the 3,335 USD level, further downside remains possible.
Suggested Trading Strategy:
In the short term, traders may consider a “Sell on Rally” approach if price continues to fail at the 3,332 – 3,335 USD resistance zone.
Conversely, if a clear breakout occurs above the descending trendline and especially above the 3,336 – 3,338 USD area, the bullish trend may resume.
Conclusion:
XAUUSD is undergoing a technical pullback after a sharp rise. The market is currently in a tug-of-war between profit-taking pressure and recovery attempts. How price reacts at the current resistance will determine the next key move.

Gold falls back to 18-24 and goes longFrom the 4-hour analysis, pay attention to the short-term support of 3318-3324 below, pay attention to the short-term resistance of 3345-50 above, and focus on the suppression of 3365-70. The overall high-altitude low-multiple cycle participation theme remains unchanged. In the middle position, watch more and do less, and follow orders cautiously, and keep the main theme of participation in the trend. Be patient and wait for key points to participate. I will prompt the specific operation strategy in the link, please pay attention in time.
Gold operation strategy:
1. Go long at 3318-3324, stop loss at 3312, target at 3345-50, and continue to hold if it breaks;
2. Go short at 3345-50 when gold rebounds, stop loss at 3357, target at 3318-24, and continue to hold if it breaks;

Can the gold bulls reverse?From the technical perspective of gold, the lowest price fell to 3295 on Monday and stopped falling. There is a lot of room for the rise, and the highest rose to around 3345. The overall trend was a "V" reversal of falling first and then rising. Therefore, it can be determined that the adjustment of gold has been completed, and the bullish force has emerged. The market outlook will continue to see room for growth. The upper side will maintain around 3365 to 3400, and the effective target of the rise this week is 3400. In the 4-hour chart, the technical pattern is also three consecutive positive days at a low level, and the Bollinger band is closing. Standing firmly above the middle track of the Bollinger band is absolutely strong. If it continues to rise, it will be around 3365. 3365 is the high point last week. If this point breaks and the Bollinger band opens, there is a possibility of a big rise to 3400 this week. Today's key point is the 3345 line above. Before the intraday breakout and stabilization at 3345, the rebound is an opportunity to go short. If it stabilizes above 3345, it means the formation of the bottom pattern, and the bulls will start to pull up. At that time, the bears can no longer hold on. The small cycle support is around 3320. Don't chase the long position in the Asia-Europe session, wait for it to fall back to the key support point and then go long.
Gold operation strategy: It is recommended to go long at 3320-3322, stop loss at 3314, and target 3330-3340; it is recommended to go short at 3342-3340 on the rebound, stop loss at 3350, and target 3330-3320;

GOLD continuation setupGold reached the 100% extension for a C wave correction after a 5 wave move to the upside, additionally 50% retracement of that 5 wave move 2 very good confluences for a continuation buy
GOLD BUY ZONES Gold Buy Zone We Have
Bullish Engulfing Area ( 3317 - 3311 )
Order Block Area ( 3304 - 3295 )
Target We Are Expect Previous High Lets Gooo

4‑Hour Technical Framework- 8th July 2025Current Price: ~$3,330
Timeframe Focus: 4‑Hour and 1‑Hour
Directional Bias: Neutral-to-Bearish
Methodologies Used:
✅ Price Action, Fibonacci Levels, Support & Resistance
✅ Supply & Demand Zones
✅ ICT / Smart Money Concepts (BOS, CHoCH, Liquidity, OB, FVG)
4‑Hour Market Structure Analysis
Gold has shifted into a neutral-to-bearish regime on the 4‑hour timeframe, after a decisive Break of Structure (BOS) below prior swing lows at ~$3,345 and a clear Change of Character (CHoCH) as bulls failed to sustain above the ~$3,350 level. Price currently hovers around ~$3,330, consolidating within a bearish Fair Value Gap (FVG) left by the recent impulsive drop.
Key Observations:
A liquidity grab above $3,349 (stop sweep) preceded a sharp reversal, validating this as a sell-side liquidity zone.
The 4H supply zone / bearish Order Block (OB) at $3,345–$3,350 remains unmitigated and likely to attract sellers.
Immediate downside is cushioned by a 4H demand zone & FVG at $3,300–$3,305, which has acted as support during the prior dip.
A deeper daily demand zone rests around $3,280–$3,290, which aligns with historical support and unmitigated buy‑side liquidity.
Key 4‑Hour Levels to Watch
Price Level Type Notes
$3,360–$3,365 Supply / Fib 61.8% Strong resistance
$3,345–$3,350 Supply / OB + 50% Fib Primary sell zone
$3,330–$3,334 Bearish FVG Active imbalance
$3,300–$3,305 Demand / FVG Primary buy zone
$3,280–$3,290 Demand (daily OB) Secondary buy zone
The neutral-to-bearish bias is reinforced by the fact that price has failed to reclaim prior support and continues to respect supply zones.
1‑Hour Intraday Trade Ideas
Zooming into the 1‑hour chart, we align intraday setups with the broader 4H directional bias: selling into supply and covering into demand.
Setup 1: Short at 4H Imbalance
Entry: ~$3,332–$3,334 (inside active FVG)
Stop-Loss: Above $3,335
Targets:
TP1: $3,305
TP2: $3,280
Confluences: BOS + CHoCH, 4H FVG, sell‑side liquidity above.
Setup 2: Short on Retracement
Entry: ~$3,345–$3,350 (50% Fib + OB)
Stop-Loss: Above $3,352
Targets: Same as Setup 1.
Setup 3: Aggressive Long (Countertrend)
Entry: ~$3,300–$3,305 (demand + FVG)
Stop-Loss: Below $3,295
Target: $3,327
Note: Only valid if strong bullish reaction occurs in demand.
The Golden Setup
Sell at ~$3,332–$3,334 (active 4H imbalance) with a target of $3,300.
This setup offers maximum confluence — bearish FVG, BOS, and supply rejection — with tight risk parameters and favorable reward/risk ratio.
Summary Table
Bias Levels of Interest
Directional Bias Neutral-to-Bearish
Strong Sell Zones $3,330–$3,334 and $3,345–$3,350
Strong Buy Zones $3,300–$3,305 and $3,280–$3,290
Closing Notes
Gold continues to respect Smart Money footprints on the 4‑hour chart, suggesting more downside unless bulls reclaim $3,350 decisively. Today’s focus remains on short opportunities at premium levels into supply and imbalances, targeting well‑defined demand areas below.
Watch price action closely in the $3,332–$3,334 zone for the highest‑probability short entry of the session — The Golden Setup.
XAUUSD Outlook: How Risk Sentiment Could Shape the Next MoveI’m currently analysing XAUUSD (Gold) 🟡, which has come under bearish pressure 📉, showing signs of downside momentum. In the video 🎥, we also explore the inverse correlation between Gold and risk assets like the NASDAQ 📊.
Keep a close eye on NASDAQ movements—if risk assets break bullish 🚀, we may see further weakness in Gold. On the other hand, if risk sentiment shifts and risk assets break bearish 🛑, Gold could attract safe-haven demand and gain strength 💪.
We also dive into the price action, market structure, and pull up the volume profile 🧩. Gold is currently trading around the Point of Control (POC) ⚖️—a key level where significant volume has accumulated. A clean break above or below this area could act as a technical trigger for the next move 📈📉.
As always, this is not financial advice ⚠️—just my market view.

GOLD H2 Intraday Chart Update for 8 July 2025Hello Traders
Gold is still in a range between 3300 - 3350 Psychological level, all eyes on breakout of both mentioned psychological levels for now
Intraday Strong support zone is located 3290-3300
Intraday Strong Resistance zone is located 3350-3360
US TARIFF WAR remains agenda for now
Disclaimer: Forex is Risky

XAUUSDHello traders,
Today we're taking advantage of a great buying opportunity on the XAUUSD pair. This setup is ideal for both medium- and long-term positions. I anticipate that the price will rise toward the 3392.82 USD level in the coming weeks.
That’s why I’ve positioned this trade as a medium-term opportunity.

Below 3360, short sellers still have profit potential!Although gold has steadily rebounded to around 3345, compared with yesterday's gold falling below 3330 again, the rebound in the short term is not strong; overall, gold is still in a weak and volatile pattern, with pressure from the upper side at 3350-3360; and there is technical buying support in the lower 3300-3290 area. It is under the influence of the resistance area and the support area that gold lacks continuity.
So before gold breaks through effectively, I think both the long and short sides of gold have profit potential, so for the current short-term trading, we can temporarily maintain the high-sell-low-dregs trading within the range.
1. Consider shorting gold in batches with 3345-3365 as resistance, TP: 3330-3320-3310;
2. Consider going long gold in batches with 3325-3305 as support, TP: 3345-3355-3365
