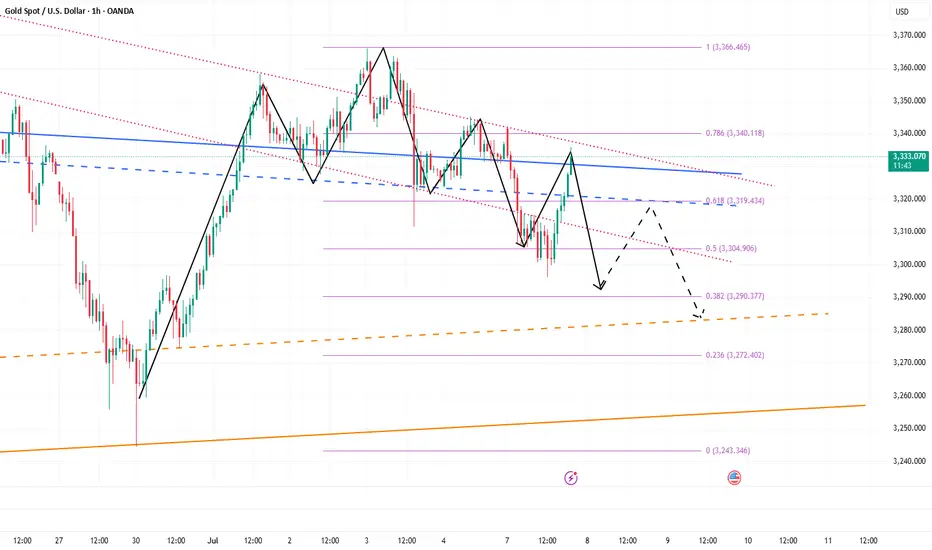
Gold Trade Setup – Bullish Flag Pattern🧠 Gold Trade Setup – Bullish Flag Pattern
📍 Pattern: Bullish Flag
📉 EMA 50: Acting as dynamic support
💰 Current Price: $3,333
📈 Bias: Bullish continuation
🟢 Trade Plan: Long Position
🔼 Entry: Around $3,333 (confirmed breakout from flag)
🎯 Target: $3,365
🛑 Stop Loss: $3,323
📊 Risk–Reward Ratio: ~1:3.2 → favorable setup
🔍 This Works:
Price breaks out of a bullish flag, a strong continuation pattern.
EMA 50 supports the trend, confirming momentum.
Room to run up to $3,365 resistance zone if momentum holds.
Xauusdanalysis

Gold Reverses with a Pin Bar – Is the Drop Over?📈 What happened yesterday on Gold (XAU/USD)?
Gold had a tricky session – during the early hours it dipped just below 3300, testing support. But by the New York session, bulls stepped in strongly, pushing price back up and closing near the daily highs. The result? A strong daily Pin Bar with a long tail, signaling possible bullish reversal.
________________________________________
❓ Is the drop over, or will the market fake out again?
That's the big question now. Yesterday’s close definitely leans bullish, but we need to see confirmation.
________________________________________
📌 Why a continuation to the upside is possible:
• Price rejected sub-3300 levels pretty strongly.
• A daily Pin Bar formed, signaling buyer strength.
• A break above yesterday’s high would confirm bullish intent.
• 3390–3400 is the next key resistance zone on the radar.
________________________________________
🧠 My trading plan:
I closed my short near break-even – no need to fight the price action. Now I'm patiently waiting for a clean break above yesterday’s high to enter long trades, aiming for the 3390–3400 resistance area.
Disclosure: I am part of TradeNation's Influencer program and receive a monthly fee for using their TradingView charts in my analyses and educational articles.

Gold fluctuates. Beware of highs.On Monday, the U.S. dollar index rose sharply, reaching an intraday high of 97.65 as Trump announced that he would impose new tariffs on a series of countries including Japan and South Korea on August 1.
Spot gold fell first and then rose. It once fell below the $3,300 mark during the session, but then rebounded strongly in a V-shaped manner by nearly $40. As of now, it has stabilized above 3,330.
From the current daily line:
3,320 is the absolute support position for gold at present. Although it fell below 3,320 yesterday, Monday, it then reversed and stabilized above 3,320. For now, the daily line still cannot close below 3,320. If it closes below 3,320, the decline may open further. On the contrary, the current upper suppression position of gold is around 3,350. That is to say, it is basically maintained at 3,320-50 for rectification.
If the daily line stabilizes at 3350 again, the bulls may rise again.
From the 4-hour chart, gold currently shows signs of a head and shoulders bottom. If the 4-hour chart stabilizes above 3340 again, the suppression level of 3350 may be directly broken. Next, it may directly touch the high level of 3380-90. Therefore, in terms of operation, I suggest that you can maintain long positions at 3320-30.
The first target is 3340-50. As long as the 4-hour chart stabilizes above 3340, you can continue to look at 3380-90.

XAUUSD Short Term Possibility AnalysisGold has an are between 3324 to 3328. It hold for a while there and target back to one hour OB which is residing on 3355 to 3365. Previous day gold move shows intense buying which is sign of potential buying in gold. As weekly candles show strong uptrend the possible move for gold will be in uptrend therefore two scenarios are shared here. If gold breaks 3324 to 3328 support it will possibly target the daily low which is residing on 3295.

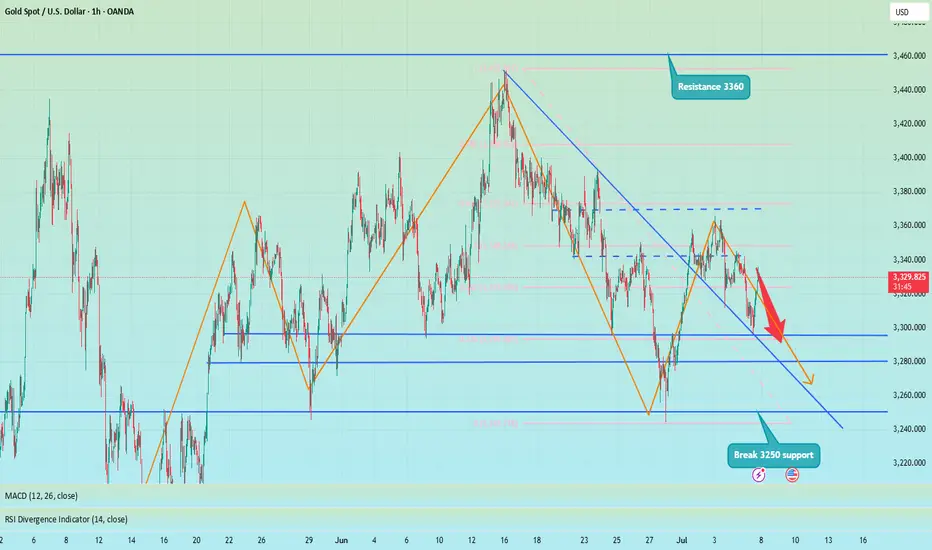
XAU/USD Eyes Key Resistance Amid Fresh Tariff Fears🟡 TVC:GOLD Gold Price Forecast: XAU/USD Eyes Key Resistance Amid Fresh Tariff Fears
OANDA:XAUUSD Spot gold (XAU/USD) is recovering from intraday lows near $3,296, now trading around $3,330 as fears over renewed U.S. tariffs fuel safe-haven demand. President Trump has begun issuing formal letters announcing fresh import tariffs—25% on South Korea, additional measures on Japan, and a 10% universal tariff on countries aligning with BRICS. With the 90-day tariff pause expiring August 1 and no trade progress in sight, geopolitical and economic uncertainty continue to support gold’s floor.
📉 Technical Structure
XAU/USD remains within a descending channel on the 1H chart, with price currently approaching the $3,338–$3,340 Resistance Zone 1. A clean breakout above the upper channel boundary could trigger a move toward the broader $3,364 Resistance Zone 2. Conversely, failure to break above Resistance Zone 1 would keep the bearish channel intact, with downside targets toward the $3,302–$3,305 support zone.
📌 Key Technical Zones
Resistance Zone 1: $3,338–$3,340
Resistance Zone 2: $3,364
Support Zone: $3,302–$3,305
Channel Structure: Bearish unless broken to the upside
📘 Strategy Summary
XAU/USD is showing signs of short-term recovery, but remains technically capped unless it breaks through $3,340 resistance. As long as the descending channel holds, rallies may be sold into. A confirmed break above $3,340 could shift bias toward $3,364, while rejection may reopen the path to $3,305 and potentially lower.
⚠️ Disclaimer
This analysis is for informational purposes only and does not constitute investment advice. Please consult a licensed financial advisor before making trading decisions.

maintain bullish, break H1 trend⭐️GOLDEN INFORMATION:
Gold prices (XAU/USD) trade in the red near $3,330 during Tuesday’s Asian session, weighed down by a stronger US Dollar (USD). The precious metal loses ground amid easing trade tensions, following US President Donald Trump’s announcement of a tariff deadline extension and his openness to further negotiations.
Market anxiety subsided after Trump signaled flexibility around the August 1 tariff deadline, describing it as “not 100% firm” and suggesting room for continued adjustments. This renewed optimism over trade policy has strengthened the Greenback, thereby pressuring USD-denominated assets like Gold, which becomes more expensive for holders of other currencies.
⭐️Personal comments NOVA:
Gold price accumulates waiting for news of new tariff information, breaking H1 trend. Good buying power
⭐️SET UP GOLD PRICE:
🔥SELL GOLD zone: 3364- 3366 SL 3371
TP1: $3350
TP2: $3340
TP3: $3330
🔥BUY GOLD zone: $3300-$3298 SL $3293
TP1: $3310
TP2: $3325
TP3: $3340
⭐️Technical analysis:
Based on technical indicators EMA 34, EMA89 and support resistance areas to set up a reasonable BUY order.
⭐️NOTE:
Note: Nova wishes traders to manage their capital well
- take the number of lots that match your capital
- Takeprofit equal to 4-6% of capital account
- Stoplose equal to 2-3% of capital account

Trend Continuation After NonfarmToday's D1 candle started to continue the trend of NF with a decrease to 3306 in the Asian session this morning.
The bearish structure of Gold Price will continue in today's trading session towards important support zones.
The downtrend of Gold was only broken with a candle closing back above 3324. And the downtrend may reach support 3275 today.
Support 3297-3275
Resistance 3324-3343-3364
SELL Trigger: Break support 3296


Shorts trapped? No, the head and shoulders top is still downOver the weekend, I gave a trading strategy for going long at 3315-3305. Today, I updated and optimized the long order trading, maintained the high-short-low-long trading strategy, and began to rebound near the 3300 line, and successfully touched the long TP 3333. At present, I am executing short trades again according to the trading strategy and holding short orders.
Although gold has only retreated to around 3330, I am not worried about losses and failures in short trades. As I wrote in today's post, the daily K-line chart has a head and shoulders top pattern. As long as the bulls fail to recover 3360, it is still a short trend. Therefore, in the short term, I still think that the rebound is a good opportunity for us to go short.
At present, the short-term bullish momentum of gold has been consumed and the downward trend continues. Therefore, I still insist on holding short orders in the short term.
In addition to investment, life also includes poetry, distant places, and Allen. Facing the market is actually facing yourself, correcting your shortcomings, facing your mistakes, and being strict with yourself. I share free trading strategies and analysis ideas every day for reference by brothers. I hope my analysis can help you.
FXOPEN:XAUUSD PEPPERSTONE:XAUUSD FOREXCOM:XAUUSD FX:XAUUSD FXOPEN:XAUUSD OANDA:XAUUSD TVC:GOLD
Gold (XAUUSD) – July 8 Analysis | Decision Day at H4 Supply Zone
Gold is currently trading inside a key H4 supply zone (3342–3345) , and today’s session could act as a pivotal turning point for the ongoing structure.
We are now in a region where the H4 may either complete its pullback and resume the uptrend — or allow price to drop deeper toward 3280 before any bullish continuation.
Market Structure Overview
• H4 Trend: Still in a pullback
• M15 Trend: Gave a Change of Character (ChoCh) in the previous session
• Break of Structure (BoS): Not yet confirmed on M15
This puts us in a state of unconfirmed reversal . Without a clean BoS, this could still be a liquidity grab .
Key Levels & Current Setup
📍 H4 Supply Zone: 3342–3345
→ This is where price is currently reacting
→ Sellers may step in here if the broader pullback continues
📍 M15 Structure Status:
→ ChoCh already occurred
→ Price is in a retracement phase
→ BoS is needed to confirm a shift and signal the end of H4 pullback
What Today’s Session Will Decide
🔸 If M15 breaks structure upward (BoS):
→ H4 pullback may be complete
→ Bias turns bullish
→ We’ll plan long setups from M15 POIs with M1 confirmation
🔸 If M15 fails to break and reverses:
→ This could be a liquidity grab
→ Sellers may push price lower
→ Next downside target: 3280 H4 order block , still valid
⚠️ Reminder: Be Prepared for Both Scenarios
• No M15 BoS = No bias
• Wait for structure, not emotion
• Do not force long trades without confirmation
• 3280 remains a high-probability target if rejection confirms
Final Thoughts
This is a structure-led market — we don’t predict, we prepare.
Today’s price action may bring directional clarity.
Structure over speculation.
Let price show intent.
Then act with process, not impulse.
📘 Shared by @ChartIsMirror

The short position is losing money. What should we do?Gold hit the intraday low of around 3296 and then began to rebound. We can see that the rebound of gold is not strong, but it is relatively sustained, so gold has rebounded to around 3335. To be honest, I did short gold according to my plan and still hold a short position.
Although gold has rebounded to around 3330, I don’t think my short gold trade has failed. As I said in the previous point of view, gold is facing technical suppression of the head and shoulders in the short term, which will suppress the rebound limit within the 3335-3340 area. So before gold stabilizes at 3340, I think the gold shorts still have the upper hand. So as long as gold stays below 3340, I think the gold rebound is a good opportunity to short gold.
At present, gold is facing the resistance area of 3335-3340 and begins to show signs of stagflation. After consuming a certain amount of bullish momentum, the gold shorts may counterattack strongly again and stimulate gold to fall rapidly. Therefore, before gold breaks upward through the 3335-3345 area, we can still consider shorting gold, or continue to hold a short position in gold!
Gold is still in rangeGold, the general trend is as described in the continuous analysis. The price has fallen from the historical high of 3500 to 3120 in the first round this year. After rising to 3452, it is currently in the second round of downward cycle. The mid-term top idea is maintained, and the operating target is 3120;
The non-agricultural data at the end of last week was under pressure at 3365, and it dropped to 3296 on Monday and rebounded. It broke the high overnight, and the daily chart closed positive. The K-line combination is in a volatile arrangement. In the short term, it will maintain consolidation below 3365; short-term support is 3330-3326, and strong support is 3320-3316; short-term resistance is 3350-3358, and strong resistance is 3365;

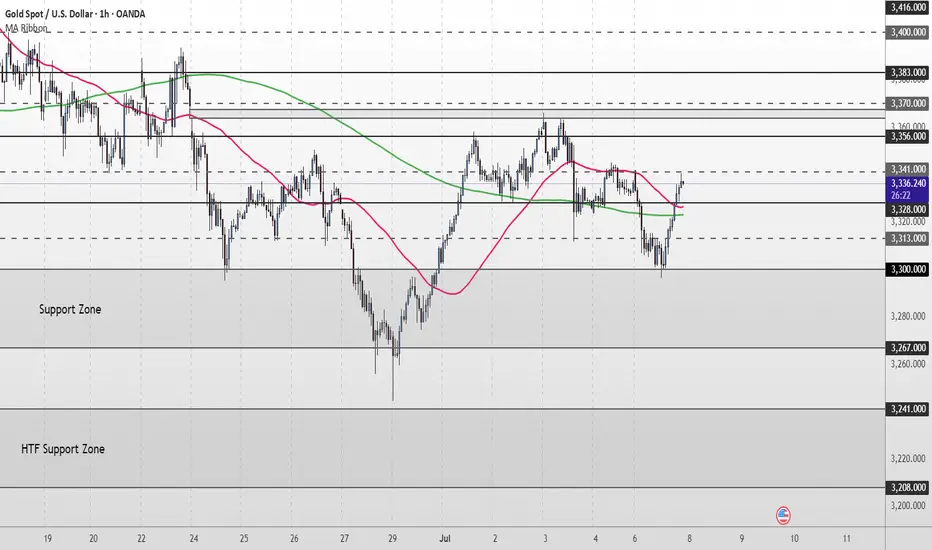
Gold Short Term OutlookGold dipped earlier in the session as the $3,328 support level failed, pushing price into the upper boundary of the broader Support Zone. From there, we’ve seen a strong bounce, with price now trending around the $3,341 minor resistance.
Price has reclaimed both the 50MA and 200MA, suggesting bullish momentum may be returning. A clean break and hold above $3,356 would likely open the path toward higher resistance levels, including $3,370 and $3,383.
However, failure to break and hold above $3,356 could lead to another pullback toward the Support Zone. If that zone fails to hold, we may see a deeper move into the higher timeframe (HTF) support area below $3,300.
📌 Key Levels to watch:
Resistance:
$3,356 ‣ $3,383 ‣ $3,400 ‣ $3,416
Support:
$3,328 ‣ $3,300 ‣ $3,267 ‣ $3,241 ‣ $3,208 (HTF Support)
Tuesday Outlook on Gold (XAU/USD)
After Monday’s move into the 4H Fair Value Gap and rejection near the trendline and Asia High, I’m expecting a corrective move to start Tuesday.
I’m currently watching two possible downside targets:
🔸 Scenario 1: A short-term drop into the upper part of the 4H FVG (around 3320–3310) – this zone could act as intraday demand and cause a quick bounce.
🔸 Scenario 2: A deeper retracement toward the unfilled imbalance around 3290–3280, lining up with the London Low and completing the 4H FVG.
This would be a more significant liquidity sweep before a potential bullish reaction.
From both zones, I’ll be looking for price action to confirm a possible long setup back toward the trendline and above.
Let’s see how Tuesday plays out.

90-day tariffs expire, how to position gold next week📰 News information:
1. 90-day tariffs are about to expire
📈 Technical Analysis:
With the Trump administration's massive tax cut and spending bill officially implemented, the U.S. Treasury may start a "supply flood" of short-term Treasury bonds to make up for the trillions of dollars in fiscal deficits in the future. Concerns about the oversupply of short-term Treasury bonds have been directly reflected in prices. The yield of 1-month short-term Treasury bonds has risen significantly since Monday this week. Slowing wage growth, falling total work hours, stagnant wage income growth and concerns about consumer spending are all signs that support gold.
From a technical perspective, Friday's closing long shadow small candle body, the price closed at a high of 3345 and a low of 3224. The overall idea for next week is to follow the trend and rely on the first short-term support of 3323 below to participate in long positions. Secondly, 3315-3305 is given below. If the support point is lost, then 3300 below is also in danger, and there is no need to overly insist on continuing to do more at low levels in the short-term rhythm. The key pressure above is 3340-3350, and the limit is the pressure of 3360 above.
🎯 Trading Points:
BUY 3325-3323
TP 3333-3340-3350
BUY 3315-3305
TP 3325-3333-3340
In addition to investment, life also includes poetry, distant places, and Allen. Facing the market is actually facing yourself, correcting your shortcomings, confronting your mistakes, and strictly disciplining yourself. I hope my analysis can help you🌐.
FXOPEN:XAUUSD PEPPERSTONE:XAUUSD FOREXCOM:XAUUSD FX:XAUUSD OANDA:XAUUSD TVC:GOLD

Gold rebounded from the bottom. Is the decline over?Gold prices faced selling pressure in today's Asian market. The price fell from 3343 to around 3320 in the early Asian session. The European price continued to fall, reaching a low of around 3296, and then rebounded upward. The current price is fluctuating around 3320.
Most investors will focus on the minutes of the Federal Open Market Committee (FOMC) meeting to be released on Wednesday to get guidance on the trend.
From the hourly chart, the upper pressure position is constantly being corrected. The current average pressure value is around 3330-3335. At the same time, this position is also the watershed between long and short positions in the previous dense area. The price may rebound to this position again. The lower support level is in the range of 3300-3290.
Quaid believes that the current market is still showing a downward trend, and the price may fall back below 3300 again.
Operation strategy:
Short around 3330, stop loss 3340, profit range 3310-3300, sustainable ownership after breakthrough.

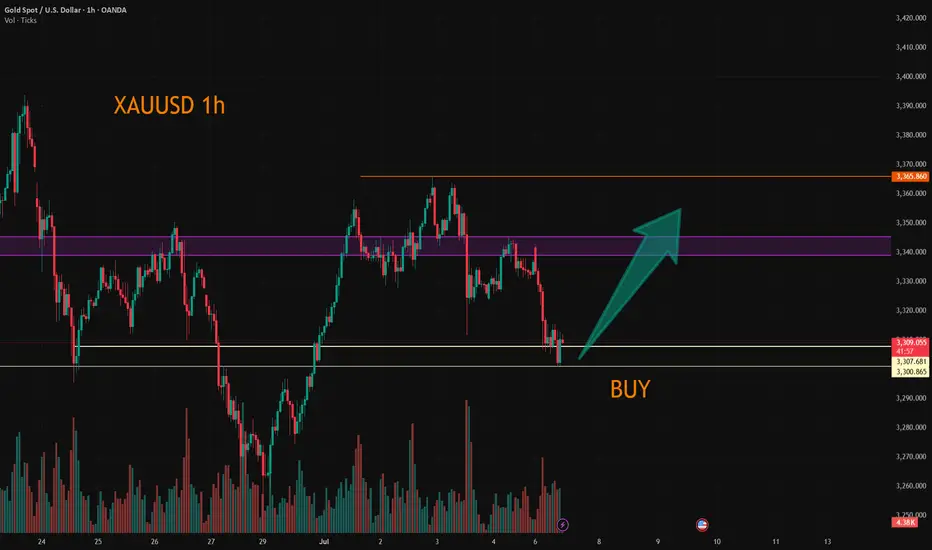
XAUUSD:Go long
Gold prices fell back in Asian trading on Monday, as they digested Friday's negative data. The short term may be partial shock, but the medium and long term news surface uncertainty or to provide support for gold prices, so trading ideas, retracement to do long can.
Trading Strategy:
Both 3300 and 3308 can be used to enter the long position, short-term traders can look at 3325-30, followed by 50 around.
For intermediate traders, the target sees 3365-70 unchanged, and the retracting of 3300/3310/3330 is an opportunity to go long.
More detailed strategies and trading will be notified here ↗↗↗
Keep updated, come to "get" ↗↗↗
7/7: Key Zone – 3320 to 3350Good morning, everyone!
Due to the U.S. market closure on Friday, price movement remained relatively subdued, and the week concluded with modest gains. As of this morning, gold opened higher but has since pulled back, and the price remains in a consolidation phase.
Key technical levels for today:
Resistance: around 3350
Support: near 3321
Short-term traders may focus on range-bound strategies between these levels. If a breakout occurs, follow the trend accordingly:
If price breaks above and stabilizes above 3338, the market may shift its focus toward the 3400 psychological level;
If price drops below and holds under 3332, there’s potential for a retest of the 3260 support zone.
In terms of broader trend analysis, the MA20 and MA60 on the daily chart should be watched closely, as they currently serve as key dynamic resistance and support levels.
Lastly, stay alert to any developments related to trade tariffs, as such news may significantly impact market sentiment and gold price direction.

Gold fluctuates, beware of rebound caused by new tariffs📊 Gold Day Trading Strategy (Recommendation index ⭐️⭐️⭐️⭐️⭐️)
📰 News information:
1. 90-day tariffs are about to expire
2. New unilateral tariffs
3. Geopolitical situation
📈 Technical Analysis:
As I said this morning, shorting gold is divided into two times, the first time is near 3324, and the second time is at 3340 or 3345. If there is a short-term retracement after breaking through 24, you can follow up with a long order to look at 3335-3340. If gold is in a very weak state, you can consider shorting near 3315 and look at 3300. Because during the European session, 3300 has strong support, and the European session repeatedly tests this support. If it falls below 3300, we will go to 3295-3285, or even 3250. But at the same time, we need to pay attention to the rebound of gold that may be caused by tariff policies and geopolitical situations.
🎯 Trading Points:
SELL 3315-3325-3335
TP 3305-3295-3285
BUY 3290-3285
TP 3300-3310-3320
In addition to investment, life also includes poetry, distant places, and Allen. Facing the market is actually facing yourself, correcting your shortcomings, facing your mistakes, and being strict with yourself. I share free trading strategies and analysis ideas every day for reference by brothers. I hope my analysis can help you.
TVC:GOLD OANDA:XAUUSD FX:XAUUSD FOREXCOM:XAUUSD PEPPERSTONE:XAUUSD FXOPEN:XAUUSD

The bears will take the 3290-3280 area stronglyGold started to fall from 3342 during the day and fell below 3300 at one point. Gold is in an obvious short position, and during the London market, gold continued its downward momentum without any decent rebound. Gold is in an extremely weak state. In the absence of a rebound in the London market, I think New York is very likely to continue to fall.
According to the current structure, gold is facing technical suppression of the head and shoulders in the short term, which greatly limits the rebound space of gold and suppresses the rebound limit within 3335. As the center of gravity of gold moves down, the resistance in the short term moves down to the 3315-3325 area. After breaking through 3330, the downward space has been opened up to a certain extent. So don’t be fooled by the false bullish candle that appear near 3330. Gold will inevitably continue to fall to the 3290-3280 area.
The 3290-3280 area is bound to be won, so shorting gold is still the first choice for short-term trading. You can consider shorting gold with the 3315-3325-3335 area as resistance, and look to the target area: 3295-3285-3275.

Gold bottomed out and rebounded to fluctuateGold, the price opened at 3342 in the morning and then fell back. The article emphasizes the bearish structure of the 4H chart, and the bearish trend continued to 3311-3295 in the afternoon; the actual price fell to 3296 and then rebounded in the evening, and the 4H chart closed at 22:00 and turned into a big positive, and it will rebound and fluctuate at night;
Short-term support 3306-3300, strong support 3296; short-term resistance 3322-3326, strong resistance 3330-3340;

Gold falls below 3300, will it rebound or continue to fall?Gold opened lower in the morning today and then rebounded and fell again. This kind of jump market fluctuates quickly but is mostly short-term. I usually remind you to avoid chasing orders to prevent being washed. Gold rebounded weakly and failed to touch 3320 and began to fall continuously. This weak signal alerted me - it failed to rebound strongly after the gap and instead remained at a low level, suggesting that the downward momentum was very strong and fully released, and there was a risk of further weakening. In the afternoon, the gold price was still hovering around 3312-3307, confirming its weak pattern. Combined with the repeated pressure on the key support 3300, I judged that the trend has clearly turned to short.
Gold recommendation: short in the 3312-3315 range, stop loss 3320, target 3280

New tariffs are coming. How should gold respond?📰 News information:
1. 90-day tariffs are about to expire
2. New unilateral tariffs
3. Geopolitical situation
📈 Technical Analysis:
On July 4th local time, there were constant turmoil in American politics and trade. Trump declared that the US government would send letters to trading partners that day to set new unilateral tariff rates, which would most likely take effect on August 1. He also revealed that the new tariff rates could soar to 70%. At the same time, Japan-US trade negotiations encountered obstacles, India planned to impose retaliatory tariffs on the United States, and the China-EU tariff war had also begun. At present, the news seems to be more favorable to the bulls.
From a technical point of view, gold closed higher last week, showing that there is still upward momentum this week. In the short term, we need to pay attention to the pressure in the 3365 and 3375 - 3380 areas, and the 3400 mark is a key position where bulls and bears are fighting fiercely. Before breaking through this position, we must be alert to the risk of falling back after a high rise. Pay attention to the support of 3310-3305 and 3295-3285 below. If effective support is obtained, we can consider going long. If it breaks, it may go to 3270-3260. Gold jumped to 3342 at the opening of the Asian session and then fell back. 3345 is the key in the short term. The news may affect its subsequent trend. In the short term, pay attention to the suppression of 3345 on the upper side, and further to the strong resistance area of 3365-3380. If there is resistance and pressure, you can short at a high level. The impact of recent news is erratic, so enter the market with caution and be sure to set TP and SL strictly.
🎯 Trading Points:
SELL 3330-3345
TP 3320-3310-3295
BUY 3310-3305
TP 3320-3330-3345
In addition to investment, life also includes poetry, distant places, and Allen. Facing the market is actually facing yourself, correcting your shortcomings, confronting your mistakes, and strictly disciplining yourself. I hope my analysis can help you🌐.
TVC:GOLD OANDA:XAUUSD FX:XAUUSD FOREXCOM:XAUUSD PEPPERSTONE:XAUUSD FXOPEN:XAUUSD
