Gold shock pattern breaksGold prices rose rapidly at the opening of the morning, reaching a high of 3342 before falling back. This early morning sharp pull-up market needs special attention, because from the perspective of short-term trading, this is the trend pattern that needs the most vigilance. Looking back at the trend of last Thursday, there was also a situation where the early morning surge could not continue. Historical data shows that this kind of morning pull-up often lacks sustained momentum and has limited room for subsequent increases. Combined with the recent trend, although the price rebounded on Monday and Tuesday, it basically maintained a volatile pattern in the following trading days, but the fluctuation range changed. After repeated struggles in the 3345-3322 range on Friday, the gold price rose again in this trading day and fell below the key support level of 3322. This important change means: 1. The original 3322-3345 oscillation range has been broken; 2. After the range moves down, 3322 changes from a support level to a resistance level; 3. The short-term trend weakens, and it is recommended to adopt a high-sell strategy. It is recommended to short at highs near 3322, and focus on the 3295-3293 support area below.
Xauusdanalysis

Gold fluctuates downward. Do not short blindly.Today, gold is in a consolidation downward trend, with the lowest point reaching around 3296; it has rebounded slightly to around 3310. From the overall market, gold is indeed in a short trend. However, do not continue to short, which is very dangerous.
Because from the hourly chart, although the low point of gold is constantly refreshing, the key hourly chart support range position has not yet broken.
So, here I may think that gold may still be tempting to short in the short term. There is still a possibility of a pullback here on the hourly chart. From the current point of view, there is still a probability of a pullback to 3320-30 before the range is broken. In terms of the next operation, I suggest that you can pay attention to 3320-30.
However, if it really pulls up again, as long as it does not stand above 3330 again. Then, we can short here at 3320-30. On the contrary, if the rebound directly breaks above 3340, then be careful. The rebound may turn into a trend reversal, and it is very likely to replicate the rhythm at the beginning of last week.

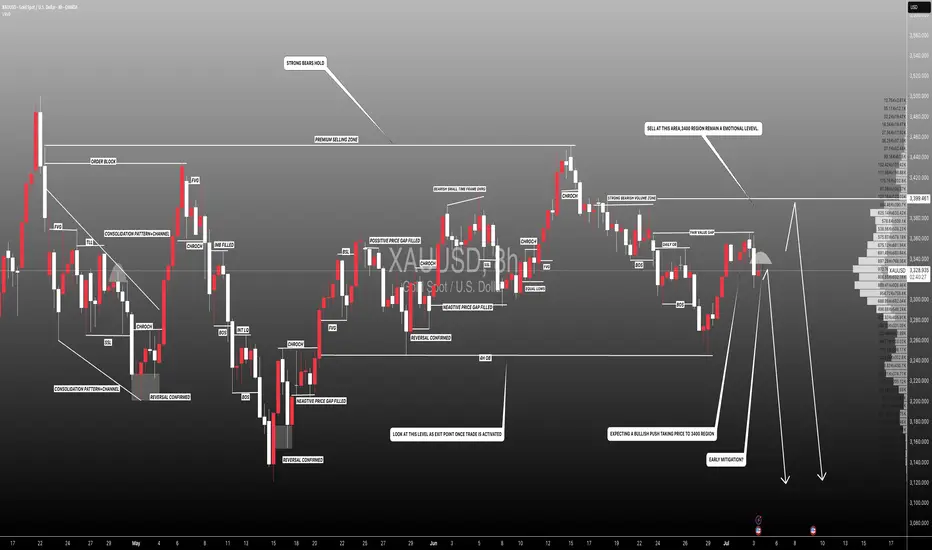
#XAUUSD: Early Mitigation Or Sellers Trap! Let's See Gold dropped after touching 3365 taking price to 3318.Currently ranging market showing confusion over how gold would react to NFP data which is coming out tomorrow. At this moment we are quite certain that price would drop tomorrow either from entry one or entry two. Please use accurate risk management while trading.
Good luck and trade!
Team Setupsfx_
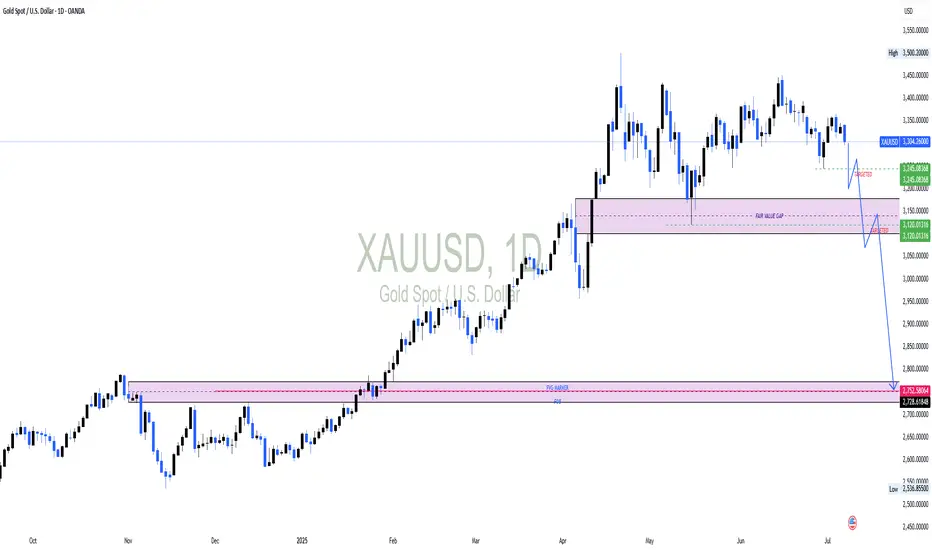
Could Gold slide below 3000?Could Gold slide below 3000?
On the monthly charts, price action shows an imbalance when Gold surged to 3500. Equilibrium must be restored and price action suggests, Gold has to correct by mitigating demand at 2700 price levels. On the weekly and daily charts, there are signs of price weakening suggesting a reversal is not so far. On the daily chart, Gold has mitigated a short term FVG and formed an intermediate low. Once this low is broken, it will confirm our reversal of Gold targeting the monthly FVG at 2760
GOLD - at immediate resistance? Holds or not??#GOLD.. market perfectly deop below our area that was 3343-44 as we discussed in morning analysis.
Now we have 3312-13 as immediate resistance area so keep close and don't buy until market holds
Good luck
trade wisley

XAUUSDGold continued to fall at the opening today, currently hitting the lowest level of 3300, with a high and low range of 40 US dollars, but the overall market is still volatile, so don't chase shorts at low points
Short-term needs to wait for a rebound before shorting, pay attention to the 3318/3323 resistance

Gold shorts may continue to 3280 or even 3255Gold started to fall from around 3342 in the Asian session, and currently hit a low of around 3305. This is completely consistent with my prediction: "Before gold stabilizes at 3340, it is still in a short trend. Gold shorts may counterattack at any time and look at the target area in turn: 3315-3305." Currently, gold has reached the target area as expected.
There is no doubt that gold is still in an obvious short arrangement at present, and gold shorts may have just begun. For the next short-term trading, we still focus on shorting gold, so what we are most concerned about now is where gold can rebound and where is the most suitable short entry? ! From the current structure of gold, gold is under pressure from the short-term head and shoulders technical structure. This resistance structure compresses the rebound limit in the short term to the 3335-3340 area; and the short-term resistance area is located in the 3320-3330 area; once gold is under pressure and falls again, I think it is very likely that gold will fall to the 3295-3285 area again, and may even extend to the 3365-3355 area.
Therefore, I think shorting gold is still the first choice for short-term trading; you can consider shorting gold in the 3320-3340 area, looking at the target area of 3290-3280-3270
Gold Under Pressure After NFP Beat – More Downside Ahead?Moments ago, the US Non-Farm Payrolls surprised to the upside at 147K (vs 111K forecast), while the Unemployment Rate dropped to 4.1% (vs 4.3% expected) .
This stronger-than-expected labor market data reinforces the idea that the Fed has no immediate reason to cut rates. As a result, the USD( TVC:DXY ) strengthened, and gold came under renewed selling pressure.
If the dollar momentum continues, Gold ( OANDA:XAUUSD ) may face further downside in the short term.
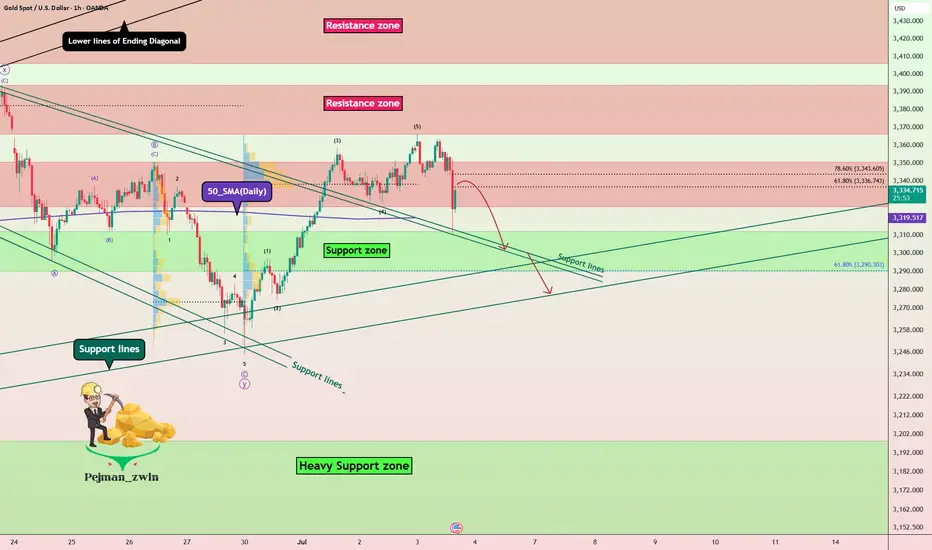
In terms of Technical Analysis , Gold fell below the Resistance zone($3,350-$3,326) again after the announcement of US indices and is currently moving near the Support lines and 50_SMA(Daily) .
In terms of Elliott wave theory , it seems that Gold has completed 5 impulsive waves in the one-hour time frame, and we should now wait for corrective waves .
I expect Gold to fall again after the upward correction , and the Support zone($3,312-$3,290) could be the target.
Note: Stop Loss (SL) = $3,365
Gold Analyze (XAUUSD), 1-hour time frame.
Be sure to follow the updated ideas.
Do not forget to put a Stop loss for your positions (For every position you want to open).
Please follow your strategy; this is just my idea, and I will gladly see your ideas in this post.
Please do not forget the ✅ ' like ' ✅ button 🙏😊 & Share it with your friends; thanks, and Trade safe.
GOLD H2 Intraday Chart Update For 7 July 2025Welcome to the new week traders
as we have FOMC meeting minutes report due this week so firs market is fell down from 3350 Psychological level now is testing 3300 psychological level
all eyes on breakout of 3300 level for now if market breaks 3300 level then it will move towards 3280 then 3350
only clear breakout of 3335 will clear path for towards 3368 level
Disclaimer: Forex is Risky

Gold price plunges by $30 at openingGold fell sharply at the opening of the morning session, with the intraday high and low price difference exceeding 30 US dollars. The positive factors over the weekend failed to reverse the bullish trend, and the bearish forces prevailed. Gold fell sharply in the last week of June, and bottomed out and rebounded in the first week of July. The market is in fierce competition between bulls and bears, and the volatile pattern has not changed. At present, gold has fallen below the non-agricultural low of 3311, and the market is weak. There is a high probability of a high and fall in the future. The short-term resistance is in the 3325-27 area, which is the intraday strength and weakness watershed; the 3343-45 area is the key boundary between bulls and bears. If it is not broken, it will fall back. If it breaks through, it is expected to hit 3365, 3380 or even 3400. The current support below is 3295-3290, and the resistance above is 3317-3323. It is recommended to do more in the callback.

Where will the price of gold go under such strong pressure?From the 4-hour analysis, the support line of 3295-3301 is concerned below, the short-term resistance above is concerned about 3316, and the suppression line of 3345-50 is focused on. The overall main tone of high-altitude low-multiple cycle participation remains unchanged. In the middle position, watch more and do less, and follow orders cautiously, and maintain the main tone of participation in the trend. Wait patiently for key points to participate.

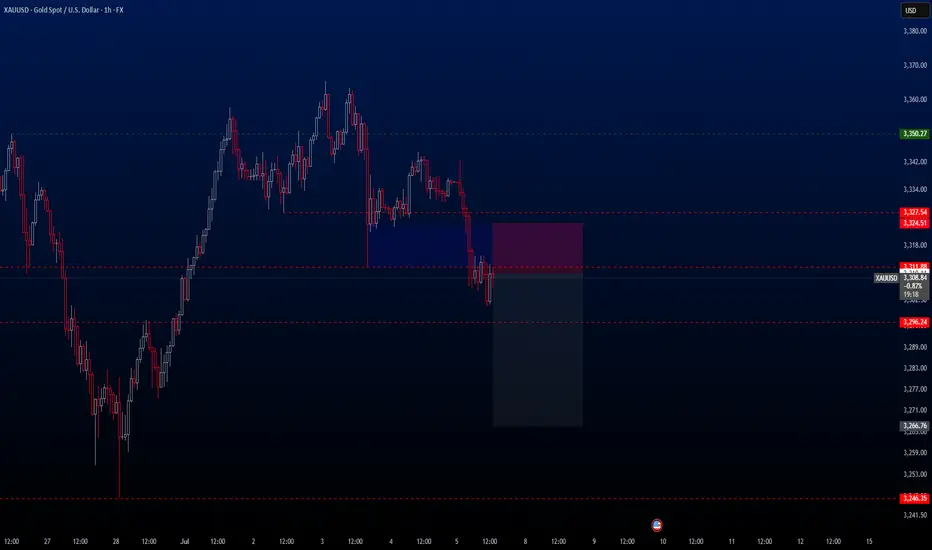
XAUUSD – Fresh Bearish Setup After TP HitWelcome to Velatrix Capital.
Last week’s short position on Gold has just hit Take Profit.
Based on current structure and momentum, we remain bearish-biased and have already entered a fresh short trade from a key resistance level.
This setup aligns with our internal system’s confluence logic and is now active.
🔍 Trade Parameters
• Timeframe: 1H
• Direction: Sell
• Entry: 3310.11
• Take Profit: 3266.76
• Stop Loss: 3324.51
• Risk/Reward: 1:3
Note: This is not financial advice. This is a real trade taken by our team based on a structured, repeatable trading model.
Use it as insight. Not as instruction.
🔔 Follow Us
We don’t chase hype.
We build edge.
Follow for raw setups, structured strategies, and institutional-grade breakdowns.

XAUUSDHello traders,
The Gold trade I shared last week has just hit TP. Based on current market conditions, I believe gold may continue its downward movement for a while. Therefore, I’m still holding a bearish bias and have just activated a new sell trade, which I’d like to share with you as well.
🔍 Trade Details
✔️ Timeframe: 1-Hour (H1)
✔️ Risk-to-Reward Ratio: 1:3
✔️ Trade Direction: Sell
✔️ Entry Price: 3310.11
✔️ Take Profit: 3266.76
✔️ Stop Loss: 3324.51
🔔 Disclaimer: This is not financial advice. I’m simply sharing a trade I’ve taken based on my personal trading system, strictly for educational and illustrative purposes.
📌 Interested in a systematic, data-driven trading approach?
💡 Follow the page and turn on notifications to stay updated on future trade setups and advanced market insights.
XAUUSD Below 3300 – Buying Opportunity or Trap? Gold Breaks Below 3300 – A Buying Opportunity or Sign of Deeper Correction?
🧭 Weekly Kickoff: Is the Sell-off Really That Dangerous?
At the start of the week, gold experienced a sharp drop to 3306 USD, breaking through the psychological 3300 support level and testing the 329x region. However, this isn't necessarily a sign of a sustainable downtrend — it's more likely a liquidity sweep before the market consolidates again for a bigger move.
🌐 Macro Updates Impacting Gold:
US inflation continues to ease, providing space for the Fed to loosen policy if needed.
FOMC minutes due soon — markets will be closely watching for clues about possible rate cuts.
Tensions in Gaza de-escalate temporarily, leading to a slight reduction in demand for safe-haven assets.
Trump's new tax bill has been passed, adding pressure to US public debt.
US–China trade war may be delayed — reducing short-term geopolitical pressure.
In summary, we are in a consolidation phase, with a high probability of a breakout in the coming days.
📉 Technical Analysis – CP Pattern in Focus
We are seeing a Continuation Pattern (CP), which generally signals that the current correction is a pause before the trend continues.
After rejecting resistance at 3336, gold fell, breaking through the 3323 support and quickly testing the 3303 zone, a key short-term support.
If gold breaks below 3293, the next target will be the 3278 USD liquidity zone, where strong buying could emerge.
📌 Key Trading Plan – 04 July
🔵 BUY ZONE
3294 – 3292
Stop Loss: 3288
Take Profit: 3298 → 3302 → 3306 → 3310 → 3315 → 3320 → 3330
🔴 SELL SCALP
3324 – 3326
Stop Loss: 3330
Take Profit: 3320 → 3316 → 3312 → 3308 → 3304 → 3300
🔴 SELL ZONE
3350 – 3352
Stop Loss: 3356
Take Profit: 3346 → 3340 → 3335 → 3330 → 3320
🧠 Market Sentiment Today
The market is currently in a consolidation phase, likely trading sideways between 3320 and 3340. A breakout seems likely once the liquidity from the US holiday subsides.
✅ Primary Bias: Look to buy dips into support zones.
⚠️ Alternative View: Only consider selling if price clearly rejects key resistance levels.
💬 What’s Your View on Gold Today?
Do you think gold will break through 3390 soon, or is there more room for a deeper correction towards 3270?
👇 Share your thoughts and analysis in the comments below!
XAUUSD – High-Precision Sell Setup with 1:2.70 R/RGreetings, traders.
After a brief tactical pause, we’ve identified a **high-conviction short setup** on **XAUUSD**.
Despite the U.S. Independence Day holiday, structural momentum suggests there’s still room for meaningful movement in gold during today’s session. The risk-to-reward profile on this setup is exceptional — clocking in at **1:8.70**, it meets our highest-tier execution standards.
If momentum stalls or price consolidates excessively, the trade will be manually closed by **23:00 (UTC+4)**, regardless of outcome.
🧠 Trade Parameters:
• **Timeframe:** 1-Hour (H1)
• **Direction:** Sell
• **Entry:** 3337.09
• **Take Profit:** 3312.16
• **Stop Loss:** 3345.63
• **Risk/Reward Ratio:** 1:2,70
• **Trade Management Note:** Will be closed manually by 23:00 (UTC+4) if momentum conditions are not met.
🔗 Signal Source
All trade setups are published directly by Velatrix Capital — a high-discipline trading desk focused on FX, crypto, and global indices.
No opinions. No hype. Just statistically-grounded execution.
All signals are posted via our TradingView desk:
👉 (www.tradingview.com)
📈 **We don’t chase hype. We build edge.**
🔔 **Subscribe for future setups and institutional-grade trade intelligence.**
**Velatrix Capital**

Continue to short gold, bears will exert force againAffected by the NFP market, gold fell precipitously, almost giving back 50% of the gains in the previous wave, and the short-selling performance was particularly strong; technically, gold successfully built a double-top structural resistance in the 3365-3363 area in the short term, which played a technical suppression role in the short term. As gold fell, the current short-term resistance moved down to the 3340-3350 area;
On the other hand, although gold began to rebound after falling to around 3312, it clearly showed the characteristics of weak rebound, and it did not even stand above 3340 once, and the long forces were insufficient; and technically, a single lower shadow line was not enough to support the continued rebound of gold, so gold still had the need to retrace the support below from a technical perspective; and once gold fell again, it was very likely to test the 3305-3295 area again.
So I think we can take advantage of the rebound of gold to short gold again. We can still short gold with the 3340-3350 area as resistance and look at the target area: 3315-3305-3295.
Consolidating Below Trendline Resistance, Bearish Bias IntactTechnical Structure:
OANDA:XAUUSD Gold (XAU/USD) continues to trade below the descending trendline TL1, having failed multiple times to breach the $3,338–$3,345 resistance zone. After retesting Support Zone 1 ($3,303–$3,310), the price is showing signs of a short-term bounce. However, the broader structure remains bearish unless the price can break above TL1.
Key Technical Levels:
Resistance Zone: $3,338 – $3,345
Support Zone 1: $3,303 – $3,310
Support Zone 2: $3,260 – $3,253
Trendline: TL1 continues to act as dynamic resistance
Strategy Insight:
If TVC:GOLD gold remains below the descending TL1, bearish pressure is likely to resume. A short opportunity may arise if the price retests the resistance area and stalls. A confirmed break below Support Zone 1 would expose targets at $3,260 and $3,253.
Disclaimer:
This analysis is for educational purposes only and does not constitute investment advice. Please consult a qualified financial advisor before making trading decisions.

XAUUSD – Gold at a Key AreaGold is now in a crucial zone with short potential.
If the market provides a valid bearish signal, I’ll take the short.
But if this zone breaks and confirms with a pullback, I’ll switch bias and go long.
💡 Remember:
We don’t control the market — we just try to profit using structure, setups, and solid risk management.
📌 Always risk max 1% per trade.
If the market goes against your bias, you only lose 1% — not your whole account.
🧠 One trade won’t make you rich,
But one reckless trade can destroy everything.
No gambling.
Just discipline, structure, and smart execution.

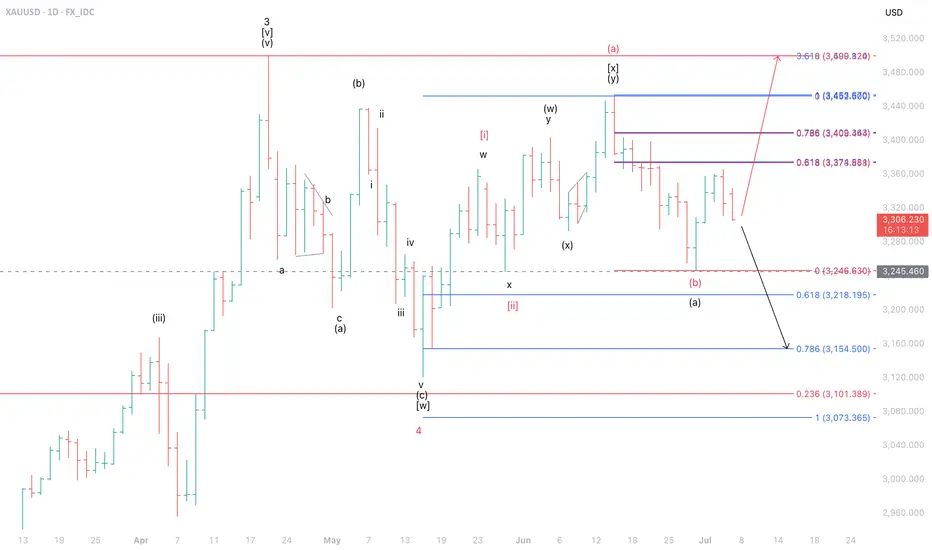
XAUUSD at a CrossroadsOn the daily timeframe, we identify two possible scenarios for XAUUSD. Under the red label, as long as XAUUSD remains above the 3,245 level—serving as a stop-loss—there is potential for further upside to test the 3,378–3,500 area.
However, in the worst-case scenario illustrated by the black label, if XAUUSD breaks below its key support, the next downside target would be in the 3,154–3,218.
The bill was introduced; the price did not rise but fell.Due to the implementation of the US bill, most traders in the market are bullish on gold and believe that gold will soar on Monday. As a result, it jumped up and fell sharply this morning. This is the uncertainty of the market. Although the short position given near 3340 last Friday was late, it fell to the low point of 3306 at the opening of the Asian market today.
In addition, the key to this sharp drop is the high point before the rebound, that is, the starting point or the position of the top and bottom conversion. Once it is broken, you have to change your mindset. The volatile market is like this, just get used to it. The turmoil caused by Trump's bill will not appear for a while. It takes a process and cannot be unilaterally considered as bullish or bearish.
In the early Asian market, the price fell all the way from 3342 US dollars to 3306. How to judge the end of the decline? It is to stare at the high point of the rebound before the last decline of 3320 US dollars. The loss of 3300 US dollars in the early trading indicates that the gap-up opening is a lure for more.
Today, I think that 3325 above 3320 can be used as the dividing point between long and short positions. You can short with a light position near 3315, and pay attention to the 3295-3290 line below. After the upward breakthrough is confirmed, consider adjusting the position and making other arrangements. For the time being, we will look at the weak adjustment during the day.

XAUUSD – Breakdown Watch: Key Demand Zone Re-tested AgainOverview
Price is once again pressing into the 3,291–3,301 key demand zone, which has already been tested multiple times. This latest move is coming after a clean lower high rejection and a developing descending trendline, hinting at weakening demand and possible bearish breakout ahead.
Key Technical Observations
Timeframe: 2H
Structure: Compression into demand with descending highs
Support Zone: 3,291 – 3,301 (major intraday demand)
Trendline: Bearish descending line from prior swing high → consistent supply pressure
Volume: Lower on this retest, but increasing slightly on recent red bars = subtle distribution
Bias: Bearish if 3,291 breaks, neutral-bullish only on strong bounce above descending line
TLDR
Gold is compressing against key 3,291 support with descending highs. Watch closely — a breakdown could accelerate toward 3,255. Only a reclaim above 3,330 would ease selling pressure.
Descending Triangle Behavior: Lower highs + flat base → bearish pattern often leads to breakdown
Previous Bounces: Each time weaker; this push lacks strong rejection wick so far
Watch For: Either a clean engulfing bounce → long trigger OR 2H close below 3,290 → short setup
Disclaimer
This is for educational purposes only. Not financial advice.

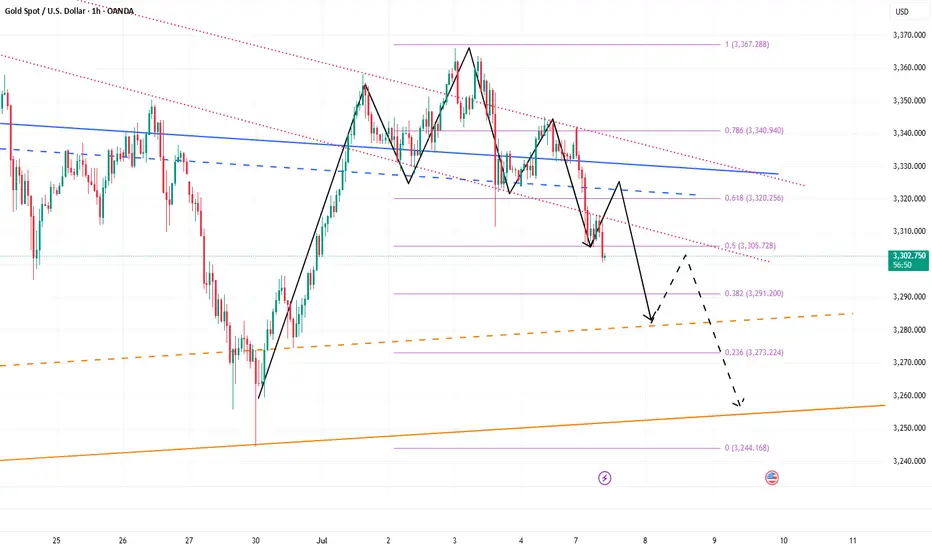
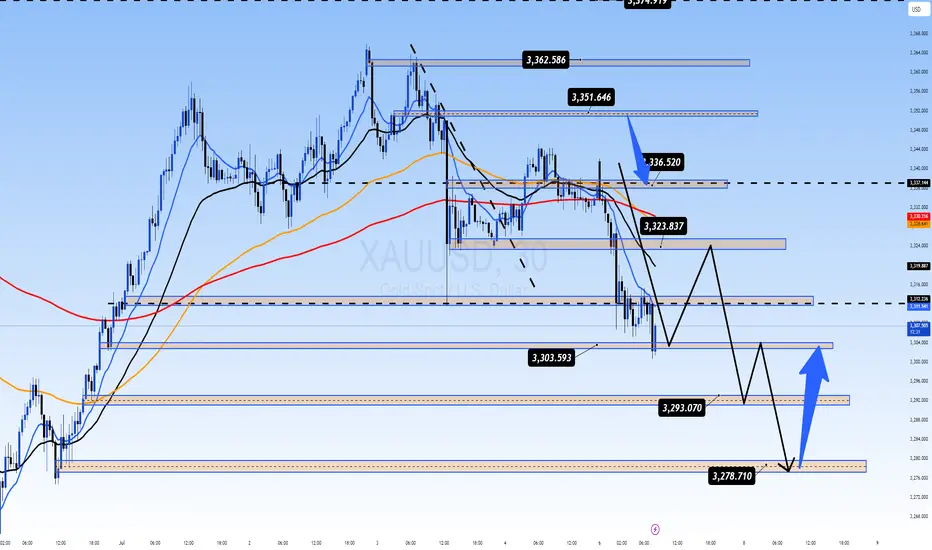
Monday Outlook on Gold (XAU/USD)My outlook for Monday is bearish at the start of the session, with price likely to drop toward the 3310–3300 area. This level aligns with a key discount zone inside the Gann box, and also overlaps with a 4H Fair Value Gap (FVG), making it a strong area of interest for potential long setups.
From that zone, I expect a bullish reaction, leading to a move back up to the trendline.
If the momentum continues, I anticipate a break of the trendline, followed by a retest, and then the beginning of a bullish trend.
I’ll be looking for confirmations around 3300 to position for the move higher.
Let’s see how Monday opens.

Monday Outlook on Gold (XAU/USD)In my opinion, we can expect a drop at the beginning of the week, with price potentially falling to the 3310–3300 zone. This area may act as a demand zone or liquidity pool, from where I expect a bullish reaction. After reaching that level, I anticipate the price to climb back up toward the trendline.
I’ll be watching for confirmations around 3300 for possible long entries.
Let’s see how the market opens on Monday.
