Gold Short Term OutlookIn yesterday’s analysis, we highlighted that the $3,327–$3,328 support zone needed to hold for bulls to maintain momentum. Price respected that level, bouncing off intraday support and is now attempting a recovery.
Currently, the 50MA is acting as dynamic resistance, and we need to see a clean break above the $3,352–$3,356 resistance zone for bulls to challenge higher levels.
However, if price fails to break above this resistance cluster, we may see a pullback toward the $3,327 support once again. A break below that would likely expose price to a deeper retracement toward $3,298.
📌 Key Resistance:
‣ $3,352
‣ $3,356
‣ $3,364
‣ $3,383
📌 Key Support:
‣ $3,328
‣ $3,298
‣ $3,270
🧠 Fundamental Focus:
With U.S. markets partially closed today, expect low liquidity and increased volatility.
Xauusdanalysis

Gold Market Analysis Current Price: 3341.58
Market Behavior:
The price is ranging sideways, trading in a tight consolidation zone just below the resistance zone (around 3344).
Key Resistance Levels:
3344 → Immediate resistance
3348 – 3352 → Next minor supply zone
3357 – 3360 → Strong resistance ahead (if breakout occurs)
Key Support Levels:
3332 – 3330 → Short-term demand
3324 – 3320 → Stronger support zone
📌 Trader Insight:
"Gold is in a consolidation phase between 3330 and 3344. Wait for a confirmed breakout above 3344 for bullish momentum toward 3357+. If rejected again, expect a retest of support near 3332 or deeper."
✅ Trade Setup (Example):
Buy Scenario (Breakout):
Entry: Above 3345
Target: 3357
Stop Loss: Below 3338
Sell Scenario (Rejection):
Entry: Near 3344 resistance, if rejected
Target: 3332 / 3324
Stop Loss: Above 3348

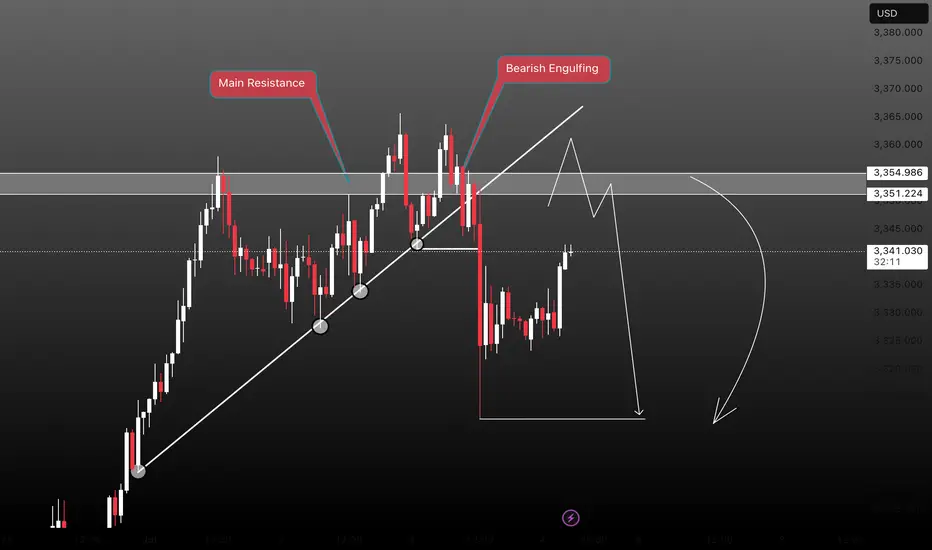
GOLD SHORT TRADEH1 TIMRFAME
1st Zone GOLD SHORT TRADE AT MAIN RESISTANCE AND ENGULFING ZONE
2nd Zone GOLD SHORT TRADE TLBP PULLBACK SELL AT SELL TRENDLINE
1st Signal : GOLD SELL MAIN RESISTANCE 3351- 3355
Stoploss : 3360
TP Level - 3345, 3340, 3335, 3330
2nd Signal : GOLD SELL TLBP PB TL 3360 - 3366
Stoploss : 3372
TP Levels - 3355, 3350, 3345, 3340, 3335, 3330
Manage Your Trade Properly
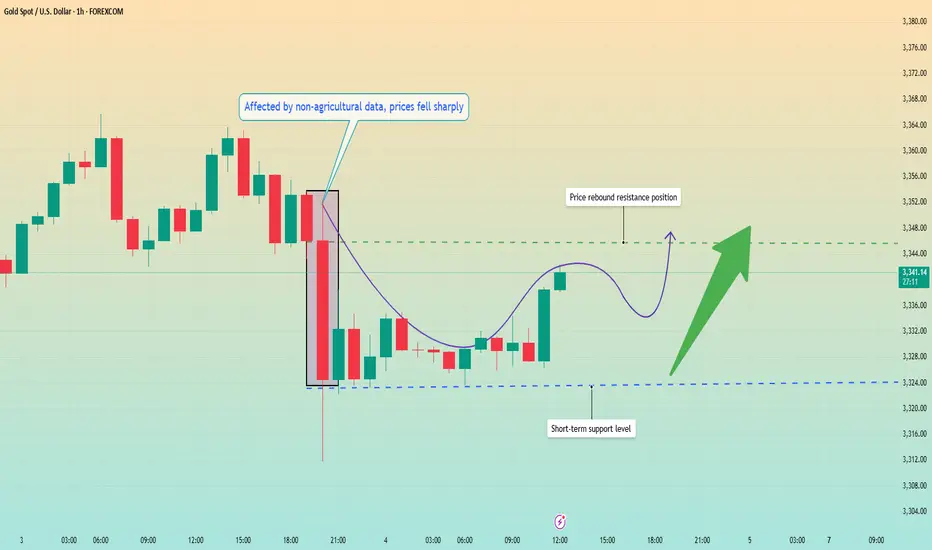
Non-farm data exceeded expectations. Will prices fall temporarilInformation summary:
Affected by the US Independence Day, the June non-farm data was released in advance. This non-farm data surprised the market, far below expectations and previous values, with a significant increase in employment exceeding expectations and previous values, and a sharp drop in unemployment to 4.1%.
The market bet that the July rate cut plan would be directly scrapped. After the employment data was released, the gold price quickly plummeted to $3,312, but the sharp drop in the market had poor continuity and ultimately did not form a unilateral decline.
Market analysis:
Due to the US Independence Day holiday, the US market was closed. In fact, the only thing left for us is the Asian and European markets. And today is the last trading day of this week, and the market is likely to maintain a state of consolidation.
From the 1-hour chart, the price fell after testing the 3,360 high twice. The negative impact of the non-farm data accelerated the decline, and the decline did not continue, and a new support level was formed near 3,323 after the decline. At present, the price is impacting around 3,345, and the bulls are expected to rebound upward and return to the upward trend.
I think the current market continues to rebound, with the lower low of 3323 as the dividing point, and high sell and low buy operations in the consolidation area of 3320-3350.
This is the last trading day of this week. I wish all traders a perfect ending and a perfect weekend.
GOLD H2 Intraday Chart Update For 4 July 2025As you can see that GOLD is still in consolidation range above 3300 Psychological Level
Currently prices are still standing @ 3340 nearby Psychological Level, only if market breaks 3368 clearly then it will consider Bullish other below 3368 market still in Bearish Move
Reminder: Today is US Bank Holiday
Disclaimer: Forex is Risky

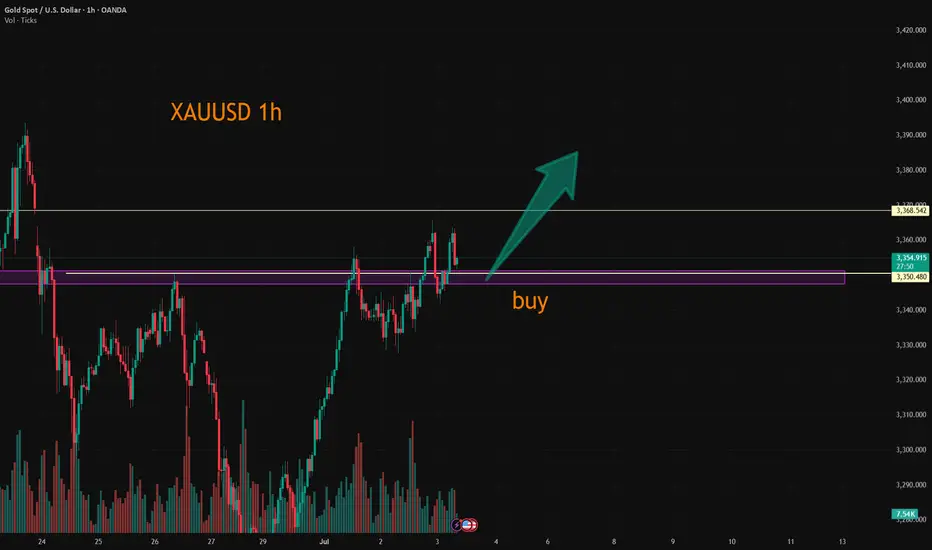
Gold/USD Bullish Breakout Toward Target Zone Gold/USD Bullish Breakout Analysis 🚀🟢
The chart illustrates a strong bullish breakout from a consolidation zone, signaling upward momentum:
🔍 Key Technical Observations:
Support Zone: The price respected the support area around 3,325 – 3,330 USD, forming a solid base for reversal.
Bullish Structure: Series of higher lows and higher highs indicate a bullish trend formation.
Breakout Confirmation: Price broke above short-term resistance with a strong bullish candle, indicating buying pressure.
Trendline Support: The ascending trendline has held well, confirming trend continuation.
Target Point 🎯: Projected target is near 3,365 USD, which aligns with a previous resistance and Fibonacci confluence zone.
✅ Conclusion:
The breakout above resistance, supported by a bullish structure and momentum, suggests further upside potential toward the 3,365 USD target zone. As long as price holds above the breakout level, bullish bias remains valid.
🛑 Watch for invalidation if price falls back

7/4: Trade Within the 3313–3346 RangeGood morning, everyone!
Yesterday’s intraday trades delivered solid profits. Since the U.S. market will be closed today, news-driven volatility is expected to be limited. Therefore, today’s trading focus will primarily revolve around technical setups.
Current structure:
Key support: 3321–3316
Immediate resistance: 3337–3342, followed by 3360
If support holds and resistance breaks, a potential inverse head-and-shoulders pattern may form on the 4H chart, with the next target near 3380
If support breaks, focus shifts to the 3303–3289 support zone
Given the likelihood of range-bound price action today, the suggested intraday range is 3313–3346, with a preference for selling near resistance and buying near support.
If an upside breakout occurs, consider using the MA20 on the 30-minute chart as a guide for pullback entries.

XAUUSD (GOLD): Sell setupXAUUSD (GOLD): Sell setup. It is ready for a sell, it will open in Asian session, and also market is complex now, but here is my plan.
Cheers

Will the NFP impact cause the bear market to dominate?📰 News information:
1. Initial jobless claims and NFP data
2. The final decision of the Federal Reserve
📈 Technical Analysis:
In the previous post, I have stated that if the hourly line closes above 3320, gold will fall into high consolidation in the short term. Currently, gold fluctuates narrowly in the short term. I think now we just need to be patient and wait for key points to enter the market. The daily and weekly lines clearly show that the high point of the oscillation range is constantly moving up, and the center of gravity continues to rise. The current market is quietly accumulating momentum, and a new round of weekly and monthly lines are about to rise. Therefore, first of all, I will pay attention to the defensive point below 3320, and then refresh the point below is the previously mentioned 3315-3305. If the point below is touched to get effective support, you can consider going long. Bros who trade independently must strictly set TP and SL to avoid the impact of market fluctuations.
🎯 Trading Points:
BUY 3320-3315-3310
TP 3330-3340-3360
In addition to investment, life also includes poetry, distant places, and Allen. Facing the market is actually facing yourself, correcting your shortcomings, confronting your mistakes, and strictly disciplining yourself. I hope my analysis can help you🌐.
FXOPEN:XAUUSD PEPPERSTONE:XAUUSD FOREXCOM:XAUUSD FX:XAUUSD OANDA:XAUUSD TVC:GOLD

NFP unexpectedly broke out, where will gold go?📰 News information:
1. Initial jobless claims and NFP data
2. The final decision of the Federal Reserve
📈 Technical Analysis:
The unexpectedly negative NFP data caused a sudden plunge in gold prices, which forced me to terminate the transaction urgently. Currently, gold has not fallen below the 3,300 mark. Therefore, I will still pay attention to the closing of the hourly line. If gold closes below 3,320, the downward trend will continue. On the contrary, if it closes above 3,320, gold will consolidate at a high level in the short term. Two days ago, I gave the support level of 3315-3305 below. Please be cautious in trading at the moment.
🎯 Trading Points:
For now, let’s focus on the hourly closing situation
In addition to investment, life also includes poetry, distant places, and Allen. Facing the market is actually facing yourself, correcting your shortcomings, confronting your mistakes, and strictly disciplining yourself. I hope my analysis can help you🌐.
TVC:GOLD OANDA:XAUUSD FX:XAUUSD FOREXCOM:XAUUSD PEPPERSTONE:XAUUSD FXOPEN:XAUUSD

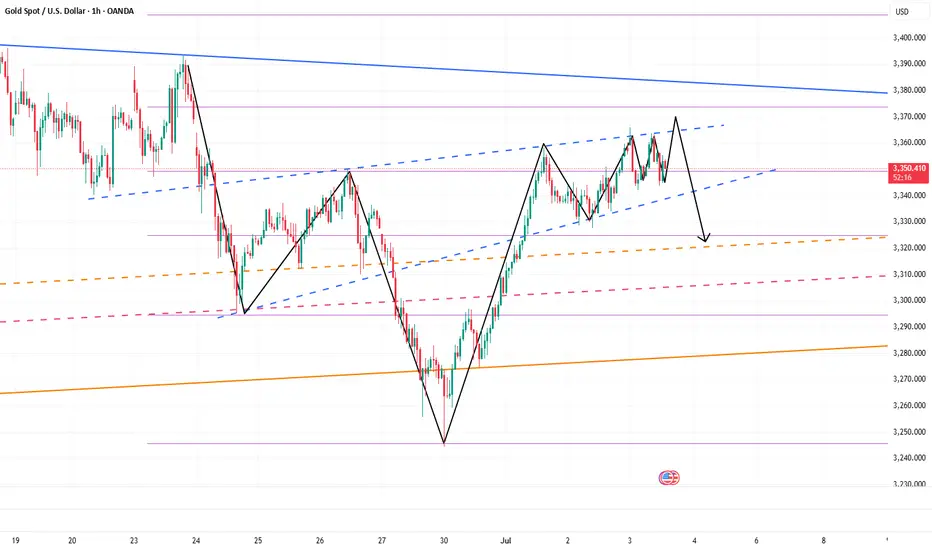
XAUUSD forecast For my forecast we see market should be make a structure .in this structure my observation is Market make today buy side liquidity 3366 and other side also make sell side liquidity 3311 but is not fixed because day was not close if market price hunt liquidity strong bearish mode than we found new lower low otherwise we saw bullish correction if market price mitigated recent FVG than target will be hunting buy side liquidity its my thought .

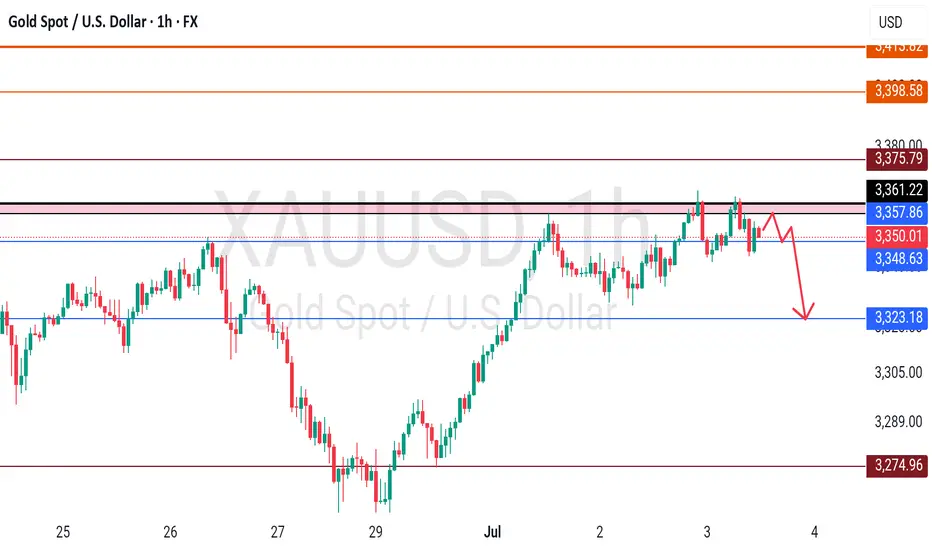
Continue to maintain the rhythm of short tradingUnder the influence of NFP, gold fell sharply as expected. What I had suggested before was proven correct by the market again. "Gold rose in advance to reserve room for the NFP market to fall." After NFP, gold fell to around 3311 and the decline narrowed. Therefore, we accurately seized the opportunity to go long on gold near 3312 and set TP: 3330. Obviously, gold successfully hit TP during the rebound and made an easy profit of 180 pips.
From the current gold structure, gold encountered resistance and retreated twice near 3365, and built a double top structure in the short-term structure. In order to eliminate the suppression of the double top structure, gold still needs to continue to fall after the rebound. After the cliff-like decline of gold, the short-term resistance is in the 3340-3345 area, and the short-term support below is in the 3320-3310 area.
So I think that gold can still continue to short gold after the rebound, and I have already shorted gold around 3336 with the 3340-3345 area as resistance. Now we just need to wait patiently for gold to hit TP. Let us wait and see!

Gold Latest Market Trend AnalysisThe data released by the U.S. Bureau of Labor Statistics showed that the U.S. seasonally adjusted non-farm payroll employment in June was 147,000, with the consensus forecast at 110,000. The previous value was revised up from 139,000 to 144,000. The annual rate of average hourly earnings in June stood at 3.7%, below the expected 3.90%, while the prior figure was revised down from 3.90% to 3.8%.
Following the release of the non-farm payroll report, interest rate futures traders abandoned their bets on a Federal Reserve rate cut in July. Currently, the market-implied probability of a Fed rate cut in September is approximately 80%, down from 98% prior to the report. On Thursday, gold exhibited a seesaw pattern, surging initially to hit resistance near $3,365 per ounce before retreating. During the U.S. session, it broke below support levels and further declined to hover around $3,311, where it staged a rebound. Gold remains in a high-range consolidation under selling pressure.
you are currently struggling with losses,or are unsure which of the numerous trading strategies to follow,You have the option to join our VIP program. I will assist you and provide you with accurate trading signals, enabling you to navigate the financial markets with greater confidence and potentially achieve optimal trading results.
Trading Strategy:
sell@3350-3355
TP:3320-3325

Revealed: Beware of a strong counterattack from gold bears!Perhaps due to the impact of the NFP market later, gold fluctuated relatively cautiously today, and neither the long nor the short side showed signs of breakthrough, and the overall trend remained volatile. However, as gold rebounded, the market bullish sentiment gradually tended to be optimistic. In the short term, the lower support area was relatively obvious, that is, the second pull-up point 3335-3325 area, followed by 3315-3305 area;
However, as gold rebounded twice and fell after touching 3365, the suppression above was also obvious. In the short term, it faced the suppression of 3375-3385 resistance. If gold cannot effectively break through this area, gold bears may make a stronger counterattack, so I don’t think gold bears have no chance at all.
Therefore, I think there is still a good profit opportunity to try to touch the top and short gold. You can consider trying to short gold in the 3365-3375-3385 area and look at the target: 3340-3330-3320.
Gold prices plunge after non-farm payrolls surpriseGold was hit by non-agricultural data and fell rapidly in the short term. All cycles showed bearish signals, and there was a slight rebound after the sharp drop. After the release of non-agricultural data, the market broke down directly, and the short-term trend has turned to decline. Data shows that gold fell by $40, the moving average formed a dead cross on the 3-hour chart, the MACD indicator formed a dead cross and increased in volume, and the gold price has fallen below the lower track of the Bollinger Band. It is recommended to continue shorting when it rebounds to the middle track position. The upper pressure level is 3342-3347. The operation is mainly based on rebound shorting.
Operation strategy:
1. It is recommended to short gold near the rebound of 3342-3347, stop loss 3355, target 3330-3320

Gold Ready to Explode Ahead of NFP and Trump’s “Super Bill”?Gold Ready to Explode Ahead of NFP and Trump’s “Super Bill”? | Global Macro Focus
🌍 MACRO UPDATE – What the World is Watching:
Gold continues its bullish trajectory as the USD weakens sharply following last night’s disappointing ADP jobs report (-33K vs expected +99K). This soft labour data has fueled further speculation that the Fed could begin rate cuts as early as September, with a 90% probability now being priced in.
In the political arena, Donald Trump’s recent statement that House Republicans are aligned to push forward a so-called “Super Bill” has triggered fresh uncertainty around US fiscal policy. This could elevate safe-haven demand for gold, especially if it leads to increased tensions over debt ceilings or government spending.
With the US Non-Farm Payrolls (NFP) due later today and the UK and US markets heading into a long weekend, traders should brace for heightened volatility and liquidity gaps.
📈 TECHNICAL OUTLOOK – What the Charts Are Saying:
Overall Trend: Bullish structure remains intact as gold breaks and holds above 3365.
EMA Setup: Price trades above EMA 13/34/89/200 – signaling strong upside momentum.
Fair Value Gap (FVG): 3374 – 3388 area remains an unfilled FVG zone; possible magnet for short-term price action.
Key Resistance Levels: 3365, 3374, 3380, 3388, 3393
Key Support Levels: 3343, 3335, 3325, 3316, 3304
Trendline & Structure: The ascending trendline from 3316 remains unbroken, providing a potential bounce point if price corrects.
🎯 TRADE SETUPS – Strategic Zones to Watch:
🔵 Buy (Short-Term Scalp):
Entry: 3335 – 3333
SL: 3329
TP: 3340 → 3350 → 3360 → 3370
🟢 Buy Zone (Swing Perspective):
Entry: 3316 – 3314
SL: 3310
TP: 3320 → 3336 → 3350 → 3360
🔴 Sell Scalp (Reversal Zone)
Entry: 3374 – 3376
SL: 3380
TP: 3370 → 3360 → 3350
⚠️ Sell Zone (High-Risk Rejection):
Entry: 3388 – 3390
SL: 3394
TP: 3380 → 3370 → 3360
🔎 NOTE FOR GLOBAL TRADERS:
With UK markets partially closed and US session shortened ahead of the Independence Day holiday, liquidity may be thin and volatility could spike unexpectedly. Always place stop-loss and avoid emotional entries near key resistance.
💬 Do you believe gold can break and close above the FVG zone (3388) before the weekend volatility hits full throttle? Let’s discuss.

7/3: Focus on Short Positions, Watch Support Near 3320Good morning, everyone!
Yesterday, gold tested support near 3328 but failed to break below it effectively. The price then rebounded toward the 3350 level. At today’s open, gold briefly extended to around 3365 before pulling back.
Technically:
On the daily (1D) chart, the price remains capped by the MA20, with no confirmed breakout yet.
Support levels below are relatively dense, and moving averages are increasingly converging, suggesting a breakout in either direction is approaching.
Key intraday support lies in the 3321–3316 zone.
On the 2-hour chart, we are seeing the first signs of a bearish divergence, indicating a need for technical correction. Much like Tuesday’s setup, there are two possible scenarios:
If 3342–3334 holds, the price may extend slightly higher, intensifying divergence before pulling back;
If 3337 breaks, we could see a drop toward 3320, where correction would occur through a direct decline.
From a fundamental perspective, several high-impact U.S. data releases are scheduled for the New York session, which may increase volatility and make trading more challenging.
Trading suggestion:
For most traders, the safest approach is to wait for data to be released, then look for oversold rebounds or overbought corrections following sharp market reactions.
This style requires patience and strong risk control—avoid being overly aggressive or greedy, as such behavior can easily lead to trapped positions or even liquidation.

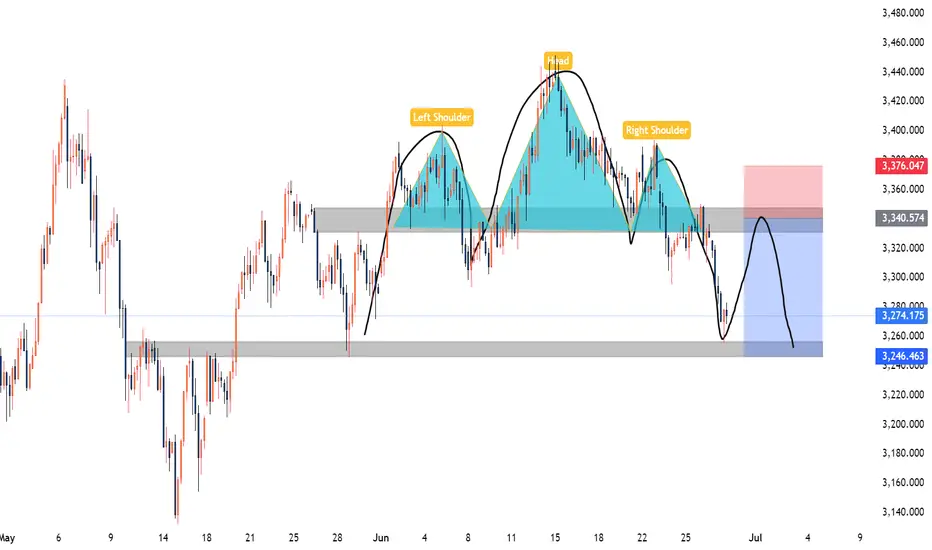
XAUUSD Weekly Analysis 30 June 4 July 2025Gold has formed a Head and Shoulders (H&S) pattern on the H4 timeframe. While the pattern is not perfectly symmetrical, it is still valid and clearly recognizable. The price has broken below the neckline, confirming a potential shift in market structure to the downside.
Analysis Insight:
The 3340–3350 area, previously a support zone, is now acting as resistance following the neckline break. A pullback to this zone may present a high-probability short opportunity for swing traders, especially if price shows rejection or bearish structure in that zone.
Trade Type: Swing
Trade Setup – Sell on Retracement:
Bias: Bearish on confirmation of retracement rejection
Entry Zone: 3340 – 3350
Stop Loss: 3376 (above right shoulder/high)
Take Profit: 3320/3300/3285/3260
Risk-Reward Ratio: Approximately 1:2
Kindly follow, share, like, support and comment.
GOLD - High placed? Short now?#GOLD... market placed 3362-64 after our last idea regarding gold buying.
And market behaved indicate us that that is a final high for now and below that a dip can be possible.
So keep close and don't buy until market holds..
Good luck
Trade wisely
Buying the Dip or Catching a Knife? My Gold Setup Explained.Entered a long position on XAU/USD from the 1H demand zone following sharp intraday selling into a key support level. With gold hovering near $3,300 and a significant testimony from Fed Chair Powell on deck, the setup aligns with both technical rebound potential and fundamental uncertainty that could fuel upside.
The goal here is to play the liquidity vacuum left after aggressive positioning was cleared, with tight invalidation and asymmetric reward.
Technicals:
• Entry aligned with prior price inefficiency and confluence of multiple demand zones
• 1H structure shows clear deviation below the range with immediate buy-side response
• EMA channel flattening, indicating potential compression ahead of expansion
• First target: $3,352
• Risk-managed with defined stop-loss below $3,260
Execution Note: This is not a “hold forever” trade. It’s an opportunistic reaction to unwind + sentiment imbalance.
Fundamentals
• Gold saw a 25% surge in 2024 due to safe-haven demand and dovish policy, but enters 2025 under pressure from:
▫️ A strong USD
▫️ Higher cost of carry
▫️ Speculators taking profit
• Fed policy remains the core variable:
▫️ A hawkish tone from Powell could weigh on price
▫️ Rate cuts would likely revive bullish momentum
• Central bank demand remains supportive
• Geopolitical tensions (Russia-Ukraine, Israel-Iran) could trigger safe-haven bids again.
Bearish headwinds:
• Waning bullish momentum per RSI divergence
• Reduced rate cut expectations post-election
• Powell’s testimony could revive volatility either way.
This is a short-term tactical long, not a macro bet. With sentiment temporarily overextended and key support defended intraday, this is a high R/R window to exploit Powell-related volatility.
Let’s see how price reacts into $3,350+. Any sustained strength there would open room toward $3,400, while failure would confirm a retest of $3,260s.
Note: Please remember to adjust this trade idea according to your individual trading conditions, including position size, broker-specific price variations, and any relevant external factors. Every trader’s situation is unique, so it’s crucial to tailor your approach to your own risk tolerance and market environment.

Gold Price Analysis July 3GOLD Technical Analysis - D1 Frame
On the D1 frame, the uptrend is still being maintained with momentum towards the price gap zone. During the European session, selling pressure started to appear around the resistance zone of 3365 - showing that this is the area where the sellers are making counter-moves.
On the chart, the gold price is accumulating and forming a triangle pattern, indicating the possibility of a strong movement phase.
If the price breaks the upper border of the triangle (above the 3363 zone), it will likely open up an opportunity to approach the next resistance at 3388.
On the contrary, if it breaks the lower border (below the 3330 zone), the correction trend may be triggered, heading towards deeper support zones.
Important Zones:
Resistance: 3363 – 3388
Support: 3330 – 3311 – 3297 – 3277
Trading Strategy:
BUY Breakout: When price breaks above 3363
SELL Breakout: When price breaks below 3330

XAUUSD:A long trading strategy
The highest gold price in the Asian session reached 3365.4, which is already our mid-line target range. If you have completed and left the market, congratulations, because I personally set the TP point of 3368, so it did not touch, the trend of the past two days is appropriate rewithdrawal after strengthening, the high is also gradually rising, the overall long trend has not changed. For today's data, the probability will make gold prices continue to rise, trading ideas or to do the main.
Trading Strategy:
BUY@3347-51
TP:3365-70
This TP range is also the target range of the median trader, for friends who do not have automatic stop profit, you can take a profit manually at that time.
More detailed strategies and trading will be notified here ↗↗↗
Keep updated, come to "get" ↗↗↗
Non-agricultural week gold long and short game!From the 4-hour trend of gold, the key position of 3300 is the core basis for judging the short-term trend. The current 4-hour watershed is in the 3300 area. The gains and losses of this position will determine the direction of the short-term trend. Before it breaks through effectively, the short-term pressure judgment is maintained; if it breaks through, it is necessary to turn to the daily resistance level. The MACD indicator crosses and the short-term momentum column continues to increase, indicating that the price has further downward momentum. The price of the 4-hour cycle runs along the downward channel. Although the MACD indicator forms a cross below the zero axis, the short-term energy column shows a shrinking trend. There is a technical oversold rebound demand in the short term.
