The bullish outlook remains unchanged, go long with the trend!Yesterday, the gold bulls refreshed the high point, and the daily line closed in the form of a medium-sized Yang line with a long lower shadow. The idea of continuing to be bullish in the short term remains unchanged, and what needs to be paid attention to is the strength of the retracement, which is similar to yesterday. The current support below is maintained at the 3355-3350 line of yesterday's rise. This position is also today's key support level, and the key suppression point above is maintained at the integer level of 3390-3400. This position may not be the end point. It was also mentioned yesterday that under the range of the previous large range of fluctuations, if either side does not break through, it will likely continue to fall into fluctuations. The current bullish trend is still relatively obvious, so we still maintain the idea of low-long operations. If your current operation is not ideal, I hope I can help your investment avoid detours. Welcome to communicate!
From the 4-hour analysis, the important support below is the 3355-3350 line. If the daily level stabilizes above this position, the bullish rhythm of falling back to lows and buying on the trend will remain unchanged. Before the daily level falls below the 3350 mark, you need to be cautious about shorting against the trend. I will provide you with the specific operation strategies at the bottom, please pay attention to them in time.
Gold operation strategy: Go long on gold when it retraces to around 3360-3350, target 3375-3385 area, and continue to hold if it breaks through.
Xauusdanalysis

gold awaiting breakout#XAUUSD we wait for breakout below 3363-61 to sell, expected target 3335.
Below 3363-61 on m15-m30 closure holds bearish continuation, target 3335, stop loss 3373.94.
Possible move above 3378 then we await for 2 times breakout to buy, target 3399.

The market trend is still there, go long on the pullback#XAUUSD
Yesterday, gold experienced a V-shaped reversal: it was blocked at the 3382 line in the morning and then fluctuated and fell, then it fell to the support near 3349 and stabilized and rebounded, then rebounded to near 3390 in the evening and closed with a doji on the daily line. Judging from the overall trend, the bullish pattern has not changed.
Gold has limited room for decline in the short term, and a sharp drop is unlikely. Today's market tends to adjust and correct first before continuing to rise. The adjustment is only short-term, and is more to give everyone enough opportunities to get on board. The focus of the market below is 3375-3360, with the target looking at yesterday's high around 3390-3395. A break is expected to extend to the 3400-3420 area.
🚀 BUY 3375-3360
🚀 TP 3390-3395

Correction first and then rise during the day, TP3400Yesterday, gold hit the bottom near 3350 and then quickly rose to break the high. It fell back slightly in the evening and closed with volatility. The daily line closed with a long lower shadow bullish line. The short-term correction process has been completed, and there is still momentum for an upward impact. The overall structure is still a bullish trend. Focus on 3365-3355 below. As long as the bullish thinking above this level remains unchanged, any decline will provide an opportunity to enter the market. The target can be around yesterday's high of 3390. Once it breaks through 3390, the gold price is expected to reach 3405-3415.
OANDA:XAUUSD

Gold Bounces from PRZ — Is a Short-Term Rally Underway?Gold ( OANDA:XAUUSD ) started to rise from the Support zone($3,307-$3,275) as I expected in the previous idea .
Gold is currently moving near the Support zone($3,350-$3,326) , Potential Reversal Zone(PRZ) , and $3,334 (Important price) .
From the Elliott wave theory , it seems that Gold has completed its 5 impulsive waves and now we should wait for corrective waves . Corrective waves can complete at the Potential Reversal Zone(PRZ) .
I expect Gold to rise to $3,383(at least) in the coming hours .
Second Target: $3,396
Note: Stop Loss (SL) = $3,321
Gold Analyze (XAUUSD), 1-hour time frame.
Be sure to follow the updated ideas.
Do not forget to put a Stop loss for your positions (For every position you want to open).
Please follow your strategy; this is just my idea, and I will gladly see your ideas in this post.
Please do not forget the ✅ ' like ' ✅ button 🙏😊 & Share it with your friends; thanks, and Trade safe.

Gold XAUUSD Analysis 06.08.2025Entry: 3373–3378 (on retracement into 1H supply zone)
Stop Loss: 3385 (above recent swing high)
Take Profit: 3352 (targeting previous low / 1H demand)
Bias: BearishRRR: ~2.5:1
Analysis:
Price showed strong rejection from the 3373–3378 supply zone. Expecting a pullback into this area before continuation lower. Bearish structure remains intact with clean lower highs. Plan is to sell the retracement, with SL above 3385. Targeting 3352, which aligns with prior demand and liquidity.
Kindly show support by following liking and commenting your favourite pair for analysis.

Gold retreats. Is it gathering upward momentum?
The 4-hour chart shows a clear market trend. On Tuesday, gold reached a high near 3390, and it's now firmly above the 4-hour trendline. The retracement reached a low near 3350, essentially completing the correction. Therefore, today's upward trend is likely to continue, aiming for new highs. The current resistance level is around 3400-3410.
From the 1-hour chart, key support lies between 3370-3360. Quaid believes that today's price must not fall below 3360. If it falls back below 3360, it's likely to retest the low of 3350.
However, as long as it remains above support, gold will remain in an upward trend. Upward resistance lies around 3400-3410.
Trading strategy:
Go long near 3360, stop loss at 3345, profit range 3380-3400.
Short near 3390, stop loss at 3410, profit range 3380-3370-3360.
Gold: Yesterday’s Surge & Today’s Session StrategyDuring yesterday’s U.S. trading session, gold surged to around 3390 🚀, driven by a series of tariff-related remarks from Trump, Fed personnel changes, and market expectations that the probability of a September rate cut has risen to 91% ⚡️. We successfully took profit near 3355 yesterday, locking in close to maximum gains 💰.
Today’s trading strategy:
Go short at highs during the Asian session 📉
Go long at lows during the European session 📈
Go short at highs again during the U.S. session 📉
⚡️⚡️⚡️ XAUUSD ⚡️⚡️⚡️
🚀 Sell@ 3390 - 3380
🚀 TP 3375 - 3366 - 3356
Daily updates bring you precise trading signals 📊 When you hit a snag in trading, these signals stand as your trustworthy compass 🧭 Don’t hesitate to take a look—sincerely hoping they’ll be a huge help to you 🌟 👇
XAU/USD Intraday Plan | Support & Resistance to WatchGold is holding above the $3,369 level after rejecting from the $3,387 resistance zone. Price action remains bullish for now, with structure supported by the rising 50MA, which is acting as dynamic support.
To extend higher, bulls need a clean break and hold above $3,387, which would open the path toward $3,422 next.
If price fails to hold above $3,369, we could see a pullback into the $3,358–$3,344 zone, which remains the first key support. Below that, the next area of interest is the Pullback Zone at $3,329–$3,313 — a former resistance turned support, and a likely area for dip-buying interest.
A break below that would shift focus to the Secondary Support Zone at $3,295–$3,281, where price last launched its breakout.
📌 Key Levels to Watch
Resistance:
‣ $3,387 ‣ $3,422
Support:
‣ $3,369 ‣ $3,358‣ $3,344‣ $3,329–$3,313‣ $3,295–$3,281
🔎Fundamental Focus:
No high-impact data today, but markets may remain reactive.

Gold is waiting to break through near the dense pressure rangeGold (XAU/USD) prices fell slightly during Wednesday's Asian trading session, retreating to around $3,370, snapping a four-day winning streak. Previously, gold prices had hit a nearly two-week high on Tuesday.
Gold's recent rally was driven by the Federal Reserve's policy outlook and safe-haven flows, but a recent shift in market sentiment toward optimism and a slight rebound in the US dollar index have put downward pressure on gold prices.
Risk assets generally rose, including a rebound in Nasdaq futures, temporarily cooling demand for safe-haven assets. Furthermore, the dollar's slight rebound also put pressure on non-interest-bearing gold.
Weak US data heightened economic concerns, supporting expectations of a rate cut this year.
Last Friday's weaker-than-expected US non-farm payroll data, coupled with Tuesday's release of the July ISM Services PMI, which fell to a multi-month low of 50.1, have fueled market concerns about the US economic outlook.
"Both the weak employment index and new orders suggest weakening momentum in the services sector, further strengthening the likelihood of a September rate cut by the Federal Reserve," analysts noted.
The market currently expects the Federal Reserve to implement a 25 basis point interest rate cut at its September policy meeting, with the possibility of a total rate cut exceeding 50 basis points this year. While this expectation has dampened dollar bullish sentiment and provided support for gold, the optimistic stock market sentiment has weakened gold's appeal as a safe-haven asset.
In trade-related news, the US President announced a new round of tariffs on imported semiconductors and pharmaceuticals, accelerating the pace of tariffs on areas such as automobiles, steel, and aluminum.
This move has heightened market concerns about global supply chain risks, maintaining cautious investor sentiment and potentially providing safe-haven support for gold in the medium term.
From a technical perspective, gold prices encountered clear resistance before reaching the $3,400 mark and failed to break through, shifting into a short-term consolidation pattern.
The 4-hour chart shows that gold found support at the 100-period simple moving average (around $3,350) and rebounded, indicating that bulls are still trying to maintain the initiative.
"Currently, hourly and daily oscillators remain positive, but if gold fails to hold above $3,400, it is likely to remain volatile in the short term," market participants noted.
Upward resistance lies at the key resistance zones of $3,400 and $3,430, respectively. A break above this would open an upward trend, targeting the all-time high of $3,500 reached in April.
Initial support lies at $3,350. A break below this would target the intermediate support of $3,322 and the $3,300 mark. A further break below this level could test the one-month low of $3,268.
Although gold prices are currently under short-term pressure, they remain supported in the medium term amidst a slowing US economy, rising expectations of interest rate cuts, and ongoing potential trade frictions. In the short term, the price is expected to fluctuate around the $3,400 level. Focus on speeches by Federal Reserve officials and next week's US CPI data, which may provide new direction for gold. OANDA:XAUUSD VELOCITY:GOLD EIGHTCAP:XAUUSD CMCMARKETS:GOLD PYTH:XAUUSD ACTIVTRADES:GOLD FX:XAUUSD

Gold is strong. Is a round number nearing its high?Information Summary:
On Tuesday, Trump made a splash. He announced four nominees for the next Federal Reserve Chair, removing Treasury Secretary Bensont from the list. He also announced tariffs on semiconductors and pharmaceuticals next week, warned of increasing tariffs on Indian goods "within the next 24 hours," and threatened to impose a 35% tariff on the EU if it failed to fulfill its obligations.
As a result, gold rose nearly $30 from its intraday low of $3,350, briefly breaking above $3,380.
Market Analysis:
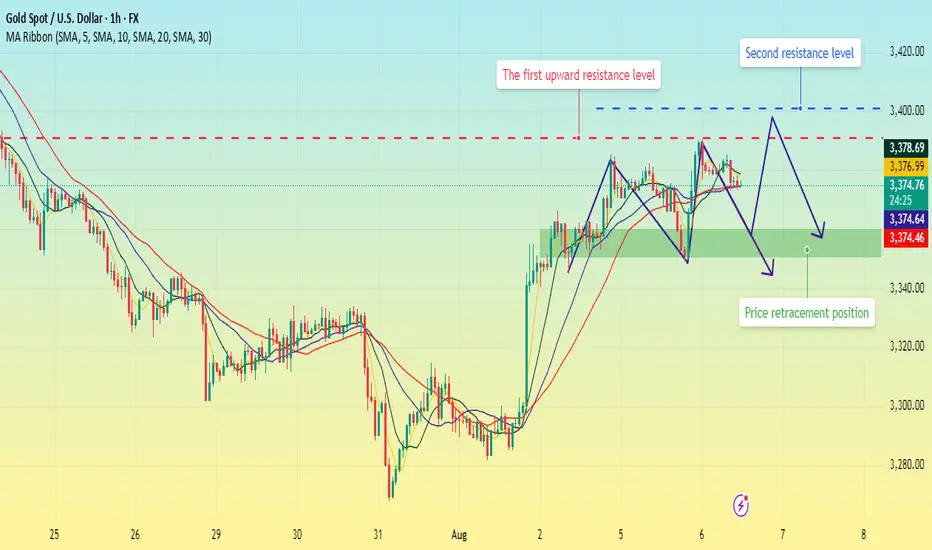
Gold has been trending upwards since the start of the week, with four consecutive daily gains, indicating a gradual buildup of bullish momentum. Judging from the 1-hour moving average indicator, the MA5 and 10 moving averages are currently turning downward, while the 20 and 30 moving averages are moving flat, which indicates that the overall short-term market trend is waiting for a price correction. Quaid believes investors should wait for the price correction to complete before entering a long position.
The key short-term trend is Tuesday's low of 3350. If gold prices hold above this level, we should maintain a positive outlook in the short term. The first resistance level above is near Tuesday’s high of 3390; the second focus is on the 3400 integer mark.
Trading strategy:
Short around 3395, stop loss at 3405, profit range 3370-3350
Long around 3350-3360, stop loss at 3340, profit range 3370-3390.
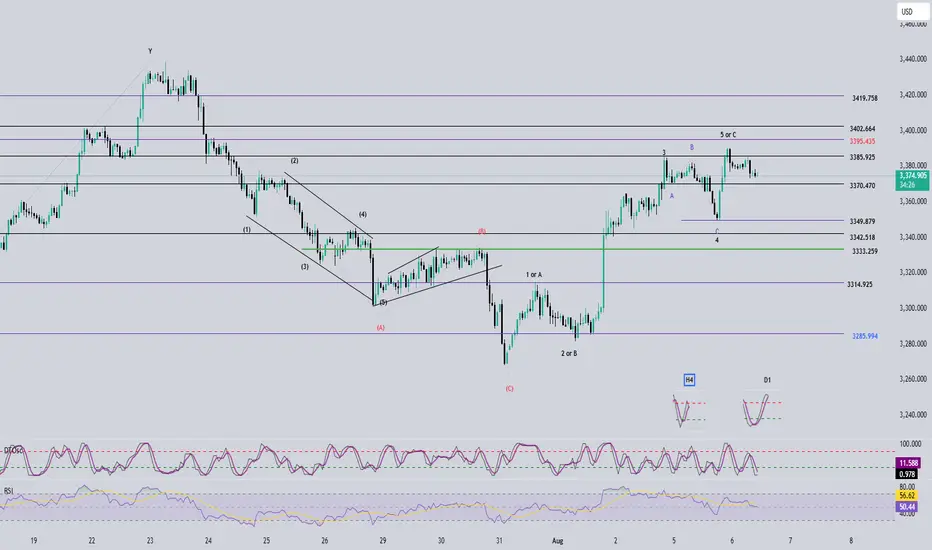
Elliott Wave Analysis – XAUUSD August 6, 2025📊
________________________________________
🔍 Momentum Analysis
• D1 Timeframe:
Daily momentum is showing signs of a potential bearish reversal. However, we need to wait for today’s candle to close to confirm the signal. While waiting for confirmation, price may still experience a minor upward move on lower timeframes, but the current bullish momentum is weak and unlikely to extend far.
• H4 Timeframe:
Momentum is also preparing to reverse. We need to observe the current H4 candle for confirmation. Notably, the reversal signal is forming just below the overbought zone, suggesting there may be one more upward push before a potential decline.
• H1 Timeframe:
Momentum is approaching the oversold zone. It may take 1–2 more bearish candles before a short-term bullish rebound occurs.
________________________________________
🌀 Elliott Wave Structure Update
Yesterday’s bullish move was disappointing — instead of pushing directly to the 3402 or 3419 target zones to complete Wave 5, price only broke slightly above 3385 before reversing. This behavior complicates wave analysis by introducing conflicting possibilities.
We currently consider two main scenarios:
Scenario 1: Wave 5 is not yet complete
• Given that D1 momentum is preparing to reverse downward, it’s unlikely that the current move is Wave 1 of Wave 5. A more likely scenario is that Wave 3 of Wave 5 has completed and price is currently in Wave 4.
• The current corrective structure has stopped at the 0.382 Fibonacci level. As long as price remains above 3370 (the 0.5 Fib level), this strengthens the case for a Wave 4 retracement before another leg up in Wave 5.
• Since bullish strength appears limited, we now focus on two main target zones for Wave 5: 3395 and 3402, instead of the previous high at 3419.
Scenario 2: Full 5-wave structure is complete – now in correction
• If the 5-wave pattern has already finished, the current decline marks the beginning of a corrective phase.
• With current momentum conditions, this is still a viable scenario. However, due to the remaining upside possibility, we recommend waiting for today’s D1 candle to confirm momentum before taking any trade.
________________________________________
📌 Trade Plan
For experienced traders:
• Wait for price to reach the 3395–3402 zones.
• Look for reversal signals in those areas to enter short positions.
Suggested trade plan for newer traders:
• Sell Zone: 3395 – 3398
• Stop Loss: 3408
• Take Profits:
o TP1: 3385
o TP2: 3370
o TP3: 3349
________________________________________
✅ Note:
This trade plan should be reassessed after today’s D1 candle closes for confirmation of the momentum shift.
Gold continues its upward trend. A strong week ahead?Gold's technical outlook on the daily chart maintains a bullish structure, with prices trading within the upper middle Bollinger Bands. The 7-day and 10-day moving averages have formed a golden cross, and the RSI indicator is trading above its mid-axis.
The short-term 1-hour chart shows prices trading within the upper middle Bollinger Bands, with the moving averages forming a golden cross and the RSI indicator pointing upwards. Quaid believes that the trading strategy for Wednesday remains unchanged, with the main focus on low-level long positions during pullbacks, supplemented by high-level short positions.
Gold initially fell before rising on Tuesday, breaking through the intraday high and touching the 3390 level. It closed with a doji with upper and lower shadows. The current bullish trend remains intact, with the moving averages in a bullish formation. However, the 4-hour chart is approaching the acceleration line, creating downward pressure. This suggests a short-term bullish risk zone, and it is advisable to avoid buying at high levels. The hourly chart showed a sideways trend, closing below the upper line. While it hasn't broken below the moving average, the indicator has turned. Therefore, based on the overall market trend today, Quaid believes there's a high probability of further upward movement after a correction.
Trading Strategy:
Long at 3355-3360, stop loss at 3345, profit range 3380-3400;
Short at 3390-3395, stop loss at 3405, profit range 3360-3350;
Key Points:
First Support Level: 3370, Second Support Level: 3360, Third Support Level: 3350
First Resistance Level: 3390, Second Resistance Level: 3400, Third Resistance Level: 3410

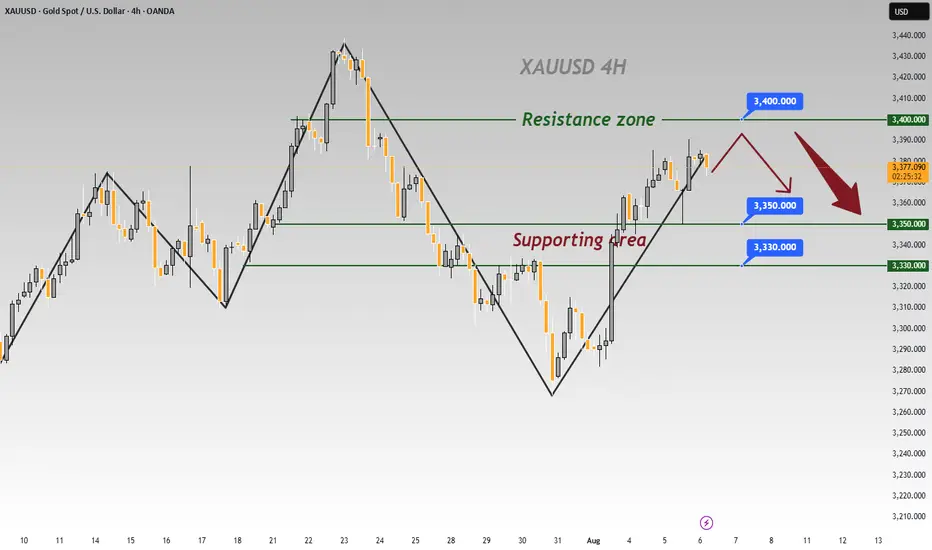
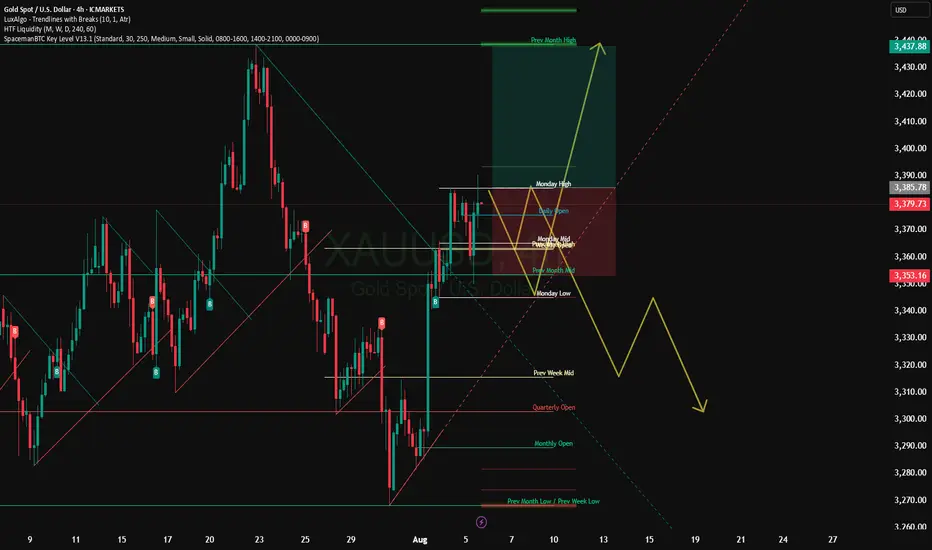
8/6: Watch for a Potential Double Top FormationGood morning, everyone!
Yesterday, gold experienced its first significant supply pressure around the 3386 level, but with support near 3350—helped by positive data—prices rebounded and climbed back toward 3390, resulting in solid overall gains.
From the 1-day chart (1D) perspective, the technical structure remains bullish, with MA20 providing firm support. Although short-term moving averages are currently converging, the overall bias remains towards a bullish divergence, suggesting further upside potential. There's a possibility for price to test the 3400–3420 zone in today’s session.
That said, the 3386–3398 region may still pose minor selling pressure, although it is not expected to be particularly strong. Key intraday support is seen in the 3378/3372–3362 range. If the market encounters another wave of heavy selling that damages the daily bullish setup, then the 3343–3348 area will become a critical battleground between bulls and bears.
📌 Trading Strategy for Today:
Maintain a sell-on-strength approach, especially if prices approach the 3418–3438 resistance area, where short opportunities become more attractive;
If a pullback occurs, monitor the aforementioned support zones for potential buy-on-dip opportunities, contingent on stability.
⚠️ Market Risk Reminder:
There will be key economic speeches during the US session, which could trigger heightened volatility. Ensure proper risk management and stop-loss settings are in place.

gold on sell#XAUUSD price third range have been broken, now we wait for reverse below 3355.
Sell from 3375-3373 on H1 closure, target 3355, SL 3384
If price touch 3371 and reverse back close, bullish range between.

"Gold on Fire! Smart Money Bulls Aiming for Final Target🟡 "Gold on Fire! Smart Money Bulls Aiming for Final Target
Overview:
The XAUUSD chart presents a clear smart money structure, showing a bullish recovery from a strong demand zone and a current move toward a significant supply (resistance) area.
🔍 Key Technical Highlights:
Strong Support Zone
The price reacted powerfully from the well-marked strong support zone (~3,260), aligned with a previous Bullish Fair Value Gap (FVG) and BOS (Break of Structure), confirming bullish intent.
Bullish Market Structure
A clean CHoCH (Change of Character) confirmed the end of the previous bearish leg.
Multiple BOS followed, solidifying the bullish shift in momentum.
Liquidity Grab & Price Expansion
Price swept equal lows (EQL) and mitigated bullish FVG, collecting sell-side liquidity before reversing.
The breakout pushed toward the current level of ~3,380, targeting the Buy-Side Liquidity zone and resistance.
Resistance & Fair Value Gap
The final target is aligned at 3,427.83, situated inside a high-probability bearish FVG and resistance zone.
This area previously rejected price (noted with the red circle), making it a critical supply zone.
Partial Target Hit
Price has already achieved half of the projected move, indicating bullish strength and proper SMC execution.
The current consolidation near the mid-level suggests accumulation or re-accumulation before a final push toward the target.
📈 Educational Notes:
Fair Value Gaps (FVG) highlight inefficiencies in price delivery. These zones often act as magnets for price and reversal points, as seen here.
Break of Structure (BOS) and Change of Character (CHoCH) are crucial for identifying trend shifts. This chart reflects a textbook bullish transition.
Liquidity concepts (EQL, Buy-Side) emphasize institutional behavior. Price often hunts liquidity before moving to new highs or lows.
✅ Conclusion:
XAUUSD is playing out a well-structured bullish smart money setup, with price currently in mid-path toward the final target. Traders should monitor reactions at the 3,427 resistance zone, which will be critical for potential reversal or continuation scenarios.

XAUUSD The beginning of large-scale growthCurrent picture and structure
The instrument is trading in a narrow range of $3,360-3,375, demonstrating low volatility - ADX is at the low of 2025, which confirms consolidation
The price is held inside a long-term ascending channel, with an increase of about 27% since the beginning of 2024
Indicators and signals
RSI (14): around 58-59, indicates moderate overbought, but remains in the bullish momentum zone
Stochastic (%K ~61%) and MACD (value ~3.8): Buy signals - short-term upward momentum is confirmed
ADX (14): around 23-24 - range, weak trend without a clear direction
Moving averages on different timeframes give a common signal indicator "Strong Buy" in daily and weekly frames
Support and resistance levels
Key support:
$3,360 — current lower stop range
$3,330–3,293 — swing low zone, critical for short-term sales
Main resistance:
$3,400–3,415 — profit acceptance zone and possible reversal pressure
$3,450 — psychological and technical barrier upon breakout of current zone
Gold rebounded near the key support level of $3,350.Spot gold edged higher during the US trading session after finding strong support near $3,350, reversing an earlier pullback. During the European trading session, gold prices briefly dipped due to improved risk appetite and a slight rise in US Treasury yields, failing to extend Monday's rebound. However, buyers stepped in near the 50-day simple moving average (SMA), pushing prices back from the day's low. The continued weakness of the US dollar, fueled by market confidence in a September Federal Reserve rate cut, supported gold's rebound.
Spot gold struggled to extend last week's rebound and is currently hovering around $3,350.
Last week, gold broke below an ascending triangle pattern, briefly hitting a one-month low, before finding support above the 100-day simple moving average (SMA), suggesting continued bearishness.
Currently, gold is trading slightly above the 50-day SMA, providing immediate support, followed by the 100-day SMA. Further declines could lead to targets near $3,275 and $3,200.
The Relative Strength Index (RSI) on the daily chart is in neutral territory around 55, indicating a lack of clear momentum. Meanwhile, the MACD indicator shows a golden cross with the DIFF crossing the DEA, and the MACD-histogram is positive, indicating accumulating bullish momentum. However, the overall reading is low, and further upward momentum is needed. A sustained golden cross and a larger candlestick pattern would be bullish.
On the upside, if bulls can reclaim the bottom of the broken triangle and decisively push above $3,380, the market could potentially move towards $3,450, or even revisit the all-time high. PEPPERSTONE:XAUUSD VELOCITY:GOLD FXOPEN:XAUUSD CMCMARKETS:GOLD VANTAGE:XAUUSD ACTIVTRADES:GOLD ACTIVTRADES:GOLD ICMARKETS:XAUUSD

XAUUSD 4H – Massive Sell Setup: Gold Crash Incoming? Gold (XAUUSD) just tapped into a key liquidity zone near the 38.2% Fibonacci retracement at $3,364, followed by a sharp rejection. This aligns with the upper channel resistance and a bearish confluence from previous supply zones.
Price has failed to break above the dynamic EMA cluster and is showing signs of exhaustion after a relief rally. If momentum follows through, this could mark the beginning of a deeper selloff targeting major downside levels.
Short Setup
Entry: Around $3,349–$3,364 (rejection zone)
SL: Above $3,379
🚨Strong bearish engulfing candle confirms seller pressure
🎯 Take Profit Targets (Fibonacci):
TP1: $3,305 (38.2%)
TP2: $3,275 (61.8%)
TP3: $3,241 (Full move – 100% Fibonacci extension)
This setup offers high risk-reward if the rejection holds and price breaks below the mid-zone structure at $3,330. A drop below $3,305 could accelerate the move as liquidity gets swept.

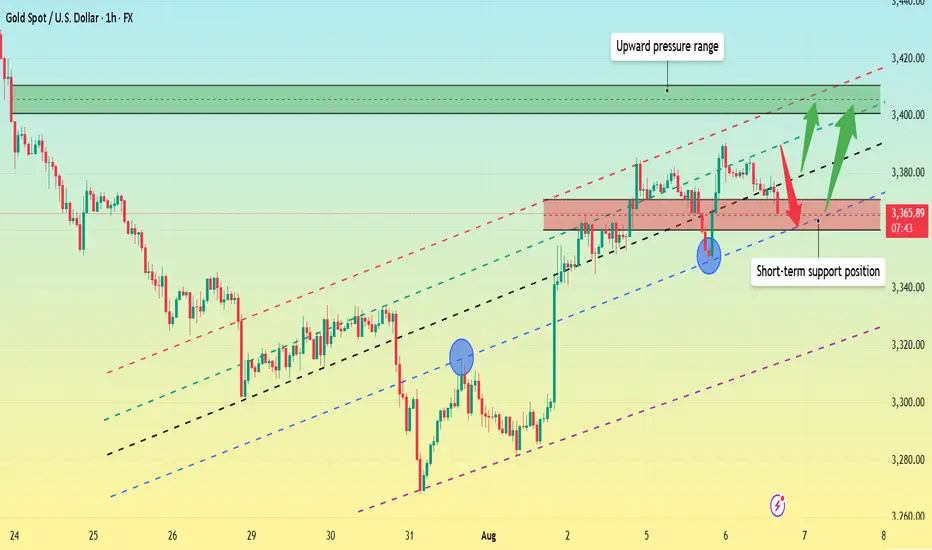
Gold has bottomed out and rebounded. Where will the high point bGold has currently hit a low near 3350, rebounding from the bottom and now rising to around 3390.
Looking at the 1-hour chart:
The most critical upward level is currently around 3390. If the price breaks through this level and stabilizes above it, the late July high of 3430 could be revisited. Conversely, if it remains below 3390, the overall range will remain between 3350 and 3390.
Secondly, looking at the 4-hour chart, we can see that the trend line resistance level is also currently around 3390. If the price stabilizes above 3390, the upper 4-hour chart could directly reach the 3400-3410 range. If the price holds above 3410 again, the next target would be around 3450.

Gold Price Analysis August 5#XAUUSD – Gold continues to increase in wave 3, BUY strategy continues to be prioritized
The D1 candle continued to close with strong increase, confirming that the uptrend is dominant and there are no clear signs of correction. Gold is currently moving in wave 3 - a period with strong amplitude and few recovery beats, so the main trading strategy is still to wait to buy at important support zones.
In the Asian session this morning, the price is reacting at the 3385 zone - an area that can act as a confirmation point for the next recovery. If the buyers maintain their position in this zone, the price will likely continue to move towards higher resistance zones.
🔹 Support zone to watch: 3363 – 3346 – 3332
🔹 Potential resistance zone: 3385 – 3407
👉 Strategy: Prioritize waiting for confirmation signals at support zones to open BUY orders in the direction of the trend. Need to carefully observe the price reaction at the 3385 zone to assess the strength of the buying force during the day.

GOLD RAID ON – Bullish Limit Orders Are LIVE! XAU/USD💰GOLD HEIST IN PROGRESS! XAU/USD BULLISH RAID BEGINS! 🏴☠️📈
Asset: XAU/USD – Gold vs U.S Dollar
📊 Plan: BULLISH ROBBERY
🎯 Target: 3460.00
🛑 Stop Loss: 3330.00
📥 Entry: ANY level – vault is wide open!
👑 THIEF MODE ACTIVATED – Time to raid GOLD like a pro. We’re stacking multiple limit orders (layering entries) just like setting traps for those greedy bears 🐻💥
🚪💼 Entry strategy:
“The vault is unlocked – grab your bag and go!”
Place buy limits at recent swing lows (15m/30m) or jump in live with your bullish crew. Use alerts to catch price at key pullback zones.
🛑 SL placed at: 3330 – Just below thief territory. Adjust based on your lot size + number of entries 🔐
🎯 Target: 3460 – Hit and run, or trail that SL and let the gold rain! ☔💸
🧠 Thief Tactics for GOLD:
Only trade Long-side – scalpers, swing traders, all aboard 🚂
Use trailing SL to protect your loot
Avoid trading during high-impact news (CPI, NFP, Fed, etc) ⚠️
Stay alert for manipulations + fake-outs at key levels – it's a trap game out here 🎭
📰 Before the Heist:
🧾 Read Fundamentals • COT Report • Sentiment • Macro Outlook
📌 Always stay updated, news can flip the market faster than a backstab 🗡️
🗣️ Boost this idea if you’re robbing with us!
💥 Smash that LIKE if you believe in the heist
🚨 Follow for more high-voltage thief trades
💎 Daily playbooks. Clean getaways. All signals, no noise.
Join the crew. Trade like a THIEF. Get rich or get smarter.
🕵️♂️💰🚀🔥🐱👤📈

Wait for a pullback and then test the previous high#XAUUSD
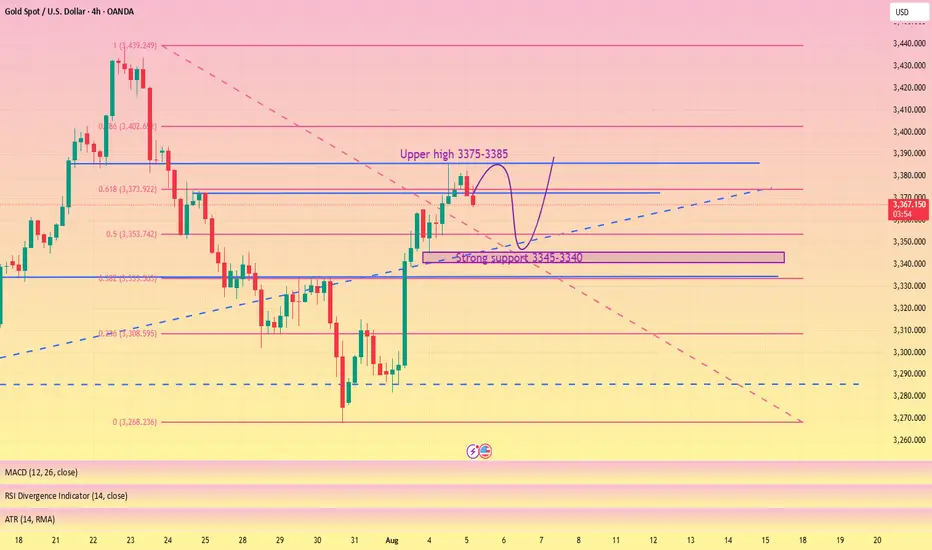
The gold market closed positively on the daily chart, with strong support near 3345-3340 below. The market trend is still dominated by bulls,🐂 but the daily moving average support is too far from the high point. It is not ruled out that it may retreat to the moving average support near 3345-3340,📊 and then rise again.🚀
From the monthly chart, 🌙although the monthly chart closed positive, the market is generally converging at a high level. Upper resistance remains, and a breakout is unlikely without breaking through this resistance level (no further discussion will be given).📉
Judging from the weekly chart, the Bollinger Bands have shrunk, and the MACD indicator has formed a death cross with large volume, indicating weak fluctuations at the weekly level.😩
Judging from the daily chart, 📊the current technical indicators are tending to the zero axis, and the rapid upward correction of the smart indicator indicates that the price fluctuation tends to rebound. The current focus is on yesterday's high around 3385. It is expected to break through 3430. The lower support Bollinger band middle track and moving average tend to stick together around 3346-3340.🌈
Judging from the hourly chart and 4H chart, 📊the overall rhythm tends to fluctuate and fall. The short-term pressure from above is around 3375-3385, and a break above will definitely lead to an increase.📈
On the whole, pay attention to yesterday's NY starting point near 3365-3360, and the strong support below is 3346-3340. The hourly and 4H charts tend to fluctuate and fall, so for short-term trading we need to short on rallies. 📉
Intraday trading suggestions are as follows:
1. Consider going long currently around 3365-3360📈, targeting 3374-3380🎯. If it breaks through, look for 3400.
2. Go long if it retraces below 3355-3340, targeting 3375-3385. Wait for further adjustments.🐂
3. If the price first reaches the resistance level of 3375-3385 and holds, consider going short with a small position and anticipate a pullback towards 3365-3355.🐻