gold on sell retrace#XAUUSD still on sell reverse, between 3347-3348 holds sell reverse. But if current H1 closes above 53 then bullish starts.
Sell limit 3347-3348, target 3320, stop loss 3356.
Above 3353 have bullish on H1 closure, target 3370
Xauusdanalysis

How do we plan before ADP and NFP?📰 News information:
1. ADP data, for reference of tomorrow's NFP data
2. Interest rate cuts and Powell's dovish comments
3. Geopolitical impact on the gold market
📈 Technical Analysis:
The market will continue to fluctuate before the ADP data, and the market will continue to rise after the adjustment. In the 4H cycle, the upper rail of the pressure is temporarily suspended, and the Bollinger Bands also close. This is why I emphasize the need to pay attention to the 3323 support line below. At present, gold rebounded, I think it will touch 3348 at most, that is, it rebounded to 50%. Therefore, before the ADP data, I still hold the position of 3340-3350 for shorting, and find support for long at 3325-3315 below. I have marked the pattern of head and shoulders bottom in the figure. I have been engaged in spot, futures, foreign exchange and other transactions for many years. My analysis ideas can be referred to by brothers
🎯 Trading Points:
SELL 3340-3350
TP 3330-3325-3315-3295
BUY 3323-3315-3305
TP 3340-3350-3360-3375
In addition to investment, life also includes poetry, distant places, and Allen. Facing the market is actually facing yourself, correcting your shortcomings, confronting your mistakes, and strictly disciplining yourself. I hope my analysis can help you🌐.
TVC:GOLD OANDA:XAUUSD FX:XAUUSD FOREXCOM:XAUUSD PEPPERSTONE:XAUUSD FXOPEN:XAUUSD

XAUUSD:Go long
Gold continued to strengthen in the Asian session, mainly due to adverse signals from tariff talks, which spurred a sharp rebound in gold prices. At present in the 3340 near the shock, this position is a short - term small pressure, from the technical trend, is still a strong long arrangement, so I think continue to break up is inevitable. Above you can look at 3350 first, then 3368/3390.
My idea is to wait for a pullback after entering the long, at present, there is not much room for a pullback, and under the strong market, there are fewer opportunities, so you can consider the first 3336-40 direct layout of long orders. If there is a certain range of retracement to consider adding positions.
Trading Strategy:
BUY@3336-40
TP:3349-54
More detailed strategies and trading will be notified here ↗↗↗
Keep updated, come to "get" ↗↗↗

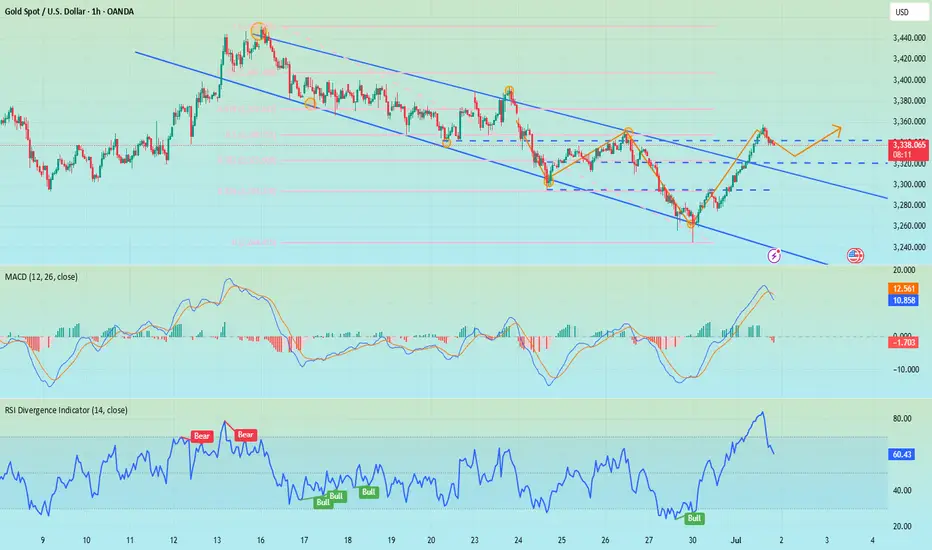
Gold may need to retreat to around 3300 againYesterday, the gold rebound stopped at around 3358, and then began to retreat. After that, it even failed to stand above 3350 during the rebound process, which to a certain extent hit the confidence of the bulls;
At present, gold has retreated to the area near 3330 again. Although gold has fallen slowly, the center of gravity of gold is still shifting downward in the short term, and the trading volume of gold is gradually increasing when it is falling, so I think the short position may not be over, and the 3330 area may be broken at any time; and the support area that really deserves our attention is first the 3320-3315 area, followed by the 3300-3295 area;
From the current gold structure, I think gold may still test the area near 3300 again before rising. Only after gold retreats to the area near 3300, it is possible to build an A-B-C head and shoulders bottom structure at the technical level (as shown in the figure), which can also help gold build a complete and effective rising structure, so gold has the need to retreat to the area near 3300 to build a right shoulder structure.
Therefore, I think shorting gold is still the first choice for short-term trading at present; you can consider shorting gold in the 3335-3355 area, looking at the target area of 3320-3310-3300.

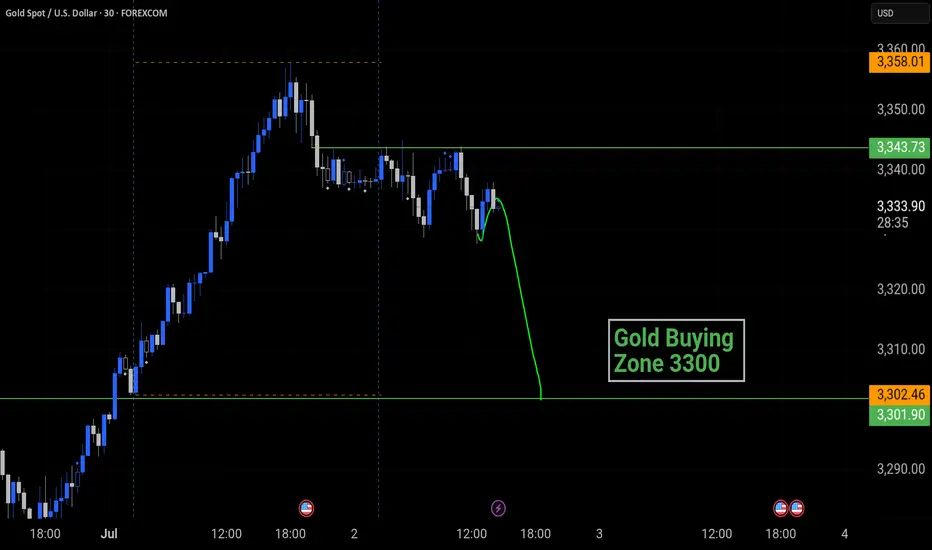
Will Gold Continue Its Strong Rally or Face a Pullback?XAUUSD 02/07: Will Gold Continue Its Strong Rally or Face a Pullback?
📉 Technical Analysis – Gold Faces Short-Term Pullback After Strong Rally
Gold has been experiencing a clear rally in recent days, but it’s currently undergoing a brief correction. The price has recently dropped slightly, prompting traders to keep a close eye on key levels for potential reversal or continuation of the bullish move.
🌍 Macroeconomic Context – Factors Impacting Gold's Price
USD Fluctuation: The weakness in the US Dollar continues to affect gold prices, creating opportunities for the precious metal to maintain its upward movement.
Geopolitical Tensions: Ongoing global tensions, including the US-Iran conflict, act as a safe-haven factor, supporting gold demand.
Interest Rate Expectations: The market is closely watching for any changes in interest rate policies. Any future rate cuts by the Fed could further bolster gold's price.
📊 Technical Outlook (H1 – H4 – D1)
Short-Term Trend: On the H1 timeframe, the price of gold touched a key level near 3340. From there, the price began to experience a pullback. However, the upward momentum remains strong on higher timeframes.
Key Support Levels: The 3300 level remains a crucial support. If the price stays above this, there’s a chance for gold to continue rising towards higher levels.
Key Resistance Levels: 3360 and 3380 are critical resistance levels. If breached, gold could move towards new highs.
📍 Important Support and Resistance Levels:
🔺 Resistance: 3345 – 3360 – 3380 – 3400
🔻 Support: 3300 – 3290 – 3270 – 3250
💡 Trading Plan for Today, 02/07:
🔵 BUY ZONE:
📈 Entry: 3305 – 3303
📉 SL: 3297
💰 TP: 3315 → 3325 → 3340 → 3360
🔴 SELL ZONE:
📉 Entry: 3360 – 3362
📈 SL: 3368
💰 TP: 3350 → 3340 → 3320
📣 Conclusion:
Gold is showing signs of short-term correction but remains a strong asset due to geopolitical factors and monetary policies. Buying opportunities continue to be attractive at support levels, while key resistances will play a crucial role for any breakout. Keep an eye on the mentioned levels to capitalize on market movements.
Happy trading and best of luck to all traders!

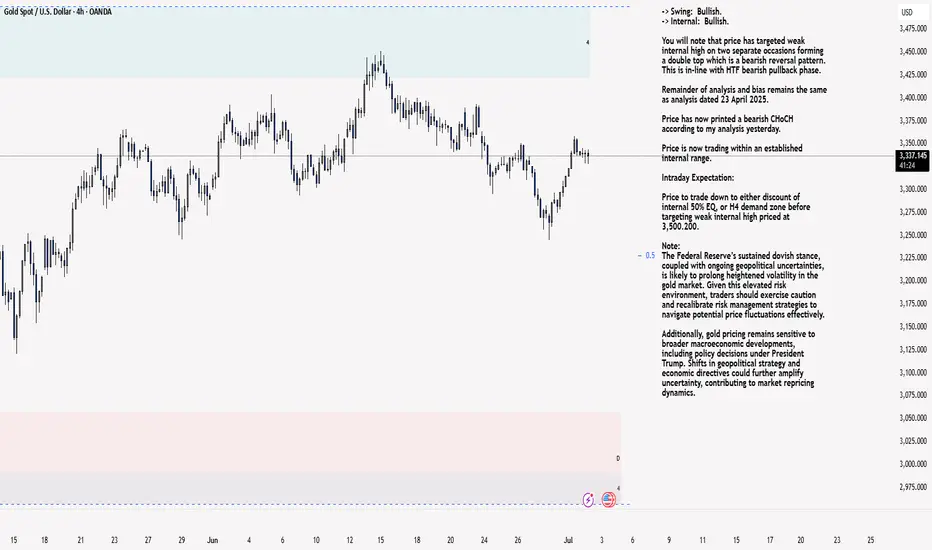
XAU/USD 02 July 2025 Intraday AnalysisH4 Analysis:
-> Swing: Bullish.
-> Internal: Bullish.
You will note that price has targeted weak internal high on two separate occasions forming a double top which is a bearish reversal pattern. This is in-line with HTF bearish pullback phase.
Remainder of analysis and bias remains the same as analysis dated 23 April 2025.
Price has now printed a bearish CHoCH according to my analysis yesterday.
Price is now trading within an established internal range.
Intraday Expectation:
Price to trade down to either discount of internal 50% EQ, or H4 demand zone before targeting weak internal high priced at 3,500.200.
Note:
The Federal Reserve’s sustained dovish stance, coupled with ongoing geopolitical uncertainties, is likely to prolong heightened volatility in the gold market. Given this elevated risk environment, traders should exercise caution and recalibrate risk management strategies to navigate potential price fluctuations effectively.
Additionally, gold pricing remains sensitive to broader macroeconomic developments, including policy decisions under President Trump. Shifts in geopolitical strategy and economic directives could further amplify uncertainty, contributing to market repricing dynamics.
H4 Chart:
M15 Analysis:
-> Swing: Bullish.
-> Internal: Bullish.
H4 Timeframe - Price has failed to target weak internal high, therefore, it would not be unrealistic if price printed a bearish iBOS.
The remainder of my analysis shall remain the same as analysis dated 13 June 2025, apart from target price.
As per my analysis dated 22 May 2025 whereby I mentioned price can be seen to be reacting at discount of 50% EQ on H4 timeframe, therefore, it is a viable alternative that price could potentially print a bullish iBOS on M15 timeframe despite internal structure being bearish.
Price has printed a bullish iBOS followed by a bearish CHoCH, which indicates, but does not confirm, bearish pullback phase initiation. I will however continue to monitor, with respect to depth of pullback.
Intraday Expectation:
Price to continue bearish, react at either M15 supply zone, or discount of 50% internal EQ before targeting weak internal high priced at 3,451.375.
Note:
Gold remains highly volatile amid the Federal Reserve's continued dovish stance, persistent and escalating geopolitical uncertainties. Traders should implement robust risk management strategies and remain vigilant, as price swings may become more pronounced in this elevated volatility environment.
Additionally, President Trump’s recent tariff announcements are expected to further amplify market turbulence, potentially triggering sharp price fluctuations and whipsaws.
M15 Chart:
GOLD - Range bound, Need to stay calm??#GOLD.. .be ready for a headache range bound move guys,
It will be very choppy so don't be panic and dont expect too much.
It will be messy.
Good luck
Trade wisely

Gold Short Term OutlookYesterday, we saw gold reclaim the 200MA and push into the $3,352 resistance. Price remains supported above the $3,327 level, keeping the bullish structure intact for now.
As long as price holds above $3,327, bulls remain in control, and a breakout above $3,352 could open the path toward $3,364 and $3,383.
However, failure to hold above $3,327 may lead to another retest of $3,298, with deeper downside toward $3,270-$3,41 support zone if that level gives out.
📌 Key Levels to Watch:
Resistance:
$3,352 • $3,364 • $3,383 • $3,400
Support:
$3,327 • $3,298 • $3,270 • $3,241

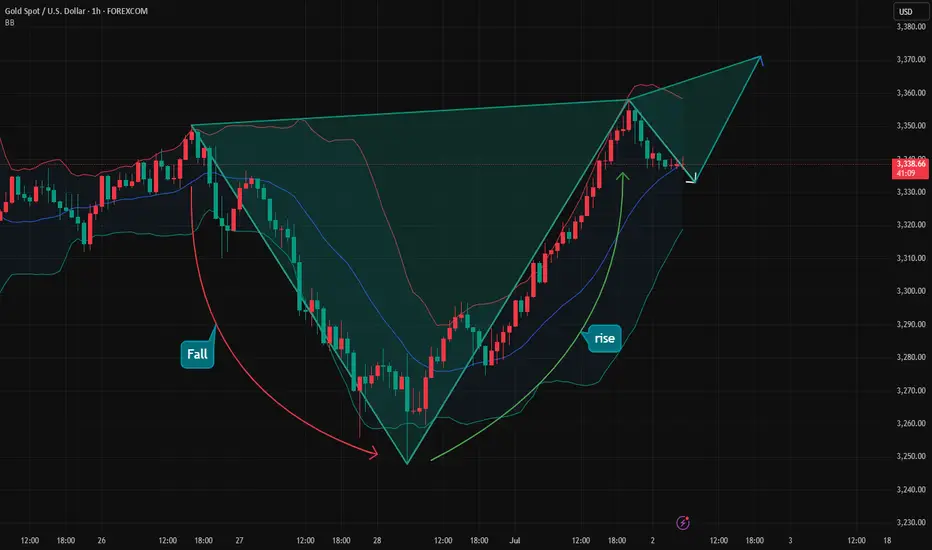
Gold breaks trend – bullish wave returnsIn the most recent trading session, gold (XAUUSD) has made a strong rebound from the key support zone around $3,263 and is now approaching a short-term resistance near $3,347 – signaling a potential continuation of the bullish momentum in the short term.
1. Price Structure & Market Behavior After reaching a local top around $3,347–$3,350, gold entered a clear downtrend.
However, the breakout of the descending trendline (yellow line) with solid bullish candles is a strong reversal signal.
The market has formed higher highs and higher lows with strong bullish candles, confirming a V-shape reversal pattern from the bottom zone.
2. Key Support & Resistance Levels Immediate resistance: $3,347–$3,350 – previous rejection zone.
Short-term support: $3,308 – newly broken resistance now acting as support.
Major support: $3,263 – previous low with strong bullish bounce, highlighting significant buyer interest.
3. Suggested Trading Strategy Given the strong breakout and bullish trend structure, traders may consider a buy-the-dip strategy around $3,308–$3,315 on potential pullbacks.
Stop-loss should be placed below $3,263 to protect against false breakouts.
Short-term take-profit targets can be set at $3,350–$3,360. If this level breaks, extended targets could reach $3,375.
Volume & Momentum Volume is increasing along with price, confirming strong buyer participation.
Bullish candles are closing near highs, showing weak selling pressure and suggesting the uptrend may continue.
Conclusion: Gold has resumed a short-term uptrend after breaking its previous downtrend. Traders should favor bullish setups and look for pullbacks to enter at better prices. Watch the $3,347 zone closely – if gold breaks and holds above it, further upside is likely.

XAUUSD Free Signal: Bullish Breakout!!!Hello everyone.
I’m sharing a trade setup for GOLD.
Gold has shown strong bullish momentum this week. Picture is simple, The setup is straightforward: I’m following the gold uptrend, targeting last week’s high.
Type: Buy (Long)
Entry: $3,343 (after price breaks resistance at $3,340)
Stop Loss (SL): $3,328 (below the recent swing high)
Take Profit (TP): $3,393 (targeting last week’s high)
Risk-Reward Ratio: 1:3.3 (risking $15 to gain $50)
This trade offers a high reward, low risk (1:3 risk-reward ratio). Gold shows buyers dominating and sellers weakening. Additionally, the US dollar index (DXY) is in a strong bearish trend. On higher timeframes (1W, 1D), gold’s recent move appears to be a slow correction, supporting my long position.
What do you think of this gold setup? Share your thoughts in the comments! Follow for more free signals, and like if you’re taking this trade!
Disclaimer: This is not financial advice. Trading involves risks. Always do your own research and manage your risk carefully.

Gold Trading Strategy June 27✏️The price reaction at 3348 forms a sustainable bearish structure. 3296 is an important zone when broken, it will continue to fall deeply without any recovery on Friday.
Today the downtrend will encounter less resistance than the uptrend. Therefore, it is not difficult to touch the support zones of 3278 and 3255.
Any recovery in the price in the European session is considered a good opportunity for a Sell signal towards the target of 3278 and 3255.
As analyzed, the SELL zone today is noted at many resistance zones and consider the price reaction for the SELL signals.
📈 Key Levels
Break out: 3296
Support: 3278-3255
Resistance: 3300-3312-3325-3336-3348-3363
📊 Recommended Trade Setups
BUY 3278-3276 SL 3272
SELL 3325-3327 SL 3330

GBPAUD waiting for conditions to break out of the wide rangeGBPAUD found some buying momentum at the 2.085 support in today's trading session. In the long term, the pair's trading range is wide, extending from 2.102 to 2.067. A breakout of this range will form a new trend.
A BUY trading signal is confirmed when the pair breaks the resistance at 2.10200.
A SELL signal is confirmed when the pair breaks the support at 2.085.
📈 Key Levels
Support: 2.085 - 2.067
Resistance: 2.102 - 2.138

Gold Trading Strategy July 1✏️ D1 candle has a bullish recovery when closing above 50% of last Friday's decline.The bullish wave of Gold is forming, heading back to the GAP 3363 zone.Today's main strategy is to wait for BUY if there is a retest of 3300. Reaction sell strategy is focused on resistance zones with not too long expectations.
📈 Key Levels
Support 3300- 3379- 3360
Resistance 3334-3348-3363
📊 Recommended Trade Setups
BUY GOLD 3300-3298 Stoploss 3295
SELL GOLD 3348-3350 Stoploss 3353

GOLD H2 Intraday Chart Update For 2 July 2025Hello Traders,
Today all eyes on breakout of 3360-70 zone in order to GOLD go for further advance below this zone all eyes are remains on 3318 level if market successfully maintain 3330 level then will go down further towards 3300 Psychological Level after passing 3318
NFP main event of the day which is held by tomorrow
Disclaimer: Forex is Risky

7/2 Trapped Orders from Yesterday Turned ProfitableGood morning, everyone!
Yesterday’s early-entry gold short position encountered some temporary drawdown, but thanks to flexible adjustments, the trade has now moved into profit overall.
Currently, the price is hovering near a key support area. Based on the 1H and 2H charts, there is still room for further downside. At this point, there are two strategic options:
Close the position to lock in current profits;
Hold the position and wait for further decline, keeping in mind that if support holds, the price may rebound back toward the 3350 level, introducing some risk.
You can decide whether to stay in the trade or exit, depending on your risk tolerance and trading plan.

Gold may collapse again, don't get buried in it!In the past two trading days, gold began to rebound from a low of around 3245, and has now rebounded to around 3358, with a rebound of up to $113. Moreover, there has been no significant retracement during this rebound, indicating that gold has little intention to fall, and may even continue to rise.
But for me, gold rebounded from 3245. Even if a double bottom structure with 3275 as the secondary low was constructed on the technical level, it should not be enough for gold to rebound more than $113 in just two days as it fell below many supports in the early stage and bullish confidence suffered a serious blow. Moreover, it happened before the uncertain news of the NFP market.
So I have to consider that the market did it deliberately, and its primary purpose was to kill a large number of short chips in the market and lure more attracted long chips; secondly, the sharp rise before the NFP market may be to reserve room for the NFP market to fall in advance; in addition, I have to consider that the US dollar has fallen to a three-year low. If it continues to fall, there may be a global crisis of confidence in the US dollar, and the oversold rebound demand for the US dollar will also suppress gold.
Therefore, I still will not advocate chasing the rise of gold for the time being; on the contrary, I will actively seek opportunities to short gold in the 3350-3370 area; and once gold turns to a downward trend again, it may at least test the 3325-3315-3305 area downward in the short term.

Gold (XAUUSD) – Bias for July 2Yesterday, price broke above the key H4 Lower High zone (3348–3350) with strong bullish momentum.
This breakout suggests a possible shift in the higher timeframe structure — indicating that the market may now be building toward a larger uptrend.
But we don’t chase breakouts — we prepare for the pullback phase .
🔍 What to Watch:
At present, M15 remains in a clean uptrend , fully in sync with the new H4 structure.
This multi-timeframe alignment gives us a clear bullish bias — but not an entry by itself.
We now need to see how price develops the pullback.
The best trades come when structure retraces with clarity — and confirms before continuation.
📍 Key M15 Level to Track:
• 3302 – Current M15 Higher Low
→ If this level holds, we may see a continuation of the uptrend from here.
→ If it breaks, the next potential reversal zone is around 3290 , where demand may reappear.
🎯 Execution Plan:
The trend is now clearly bullish across HTF and LTF.
We will only look for long setups , and only where structure confirms — either at the current HL or at deeper demand zones.
No confirmation = No trade.
No alignment = No edge.
Let price come to you. Our job is not to anticipate, but to align.
📖 From the Mirror Philosophy:
“In trend-following, the edge lies in waiting — not in chasing.
The market will reflect your patience back at you.”
📘 Shared by @ChartIsMirror
Author of The Chart Is The Mirror — a structure-first, mindset-grounded book for traders

Catching the Perfect Rebound on XAUUSD!Hi traders! , Currently analyzing GOLD (XAUUSD) on the 1H timeframe.
Price has dropped aggressively but is now reacting strongly from a key support zone around 3,271.00, where buyers are stepping in. This area has previously shown significant bullish reactions.
I'm now buying from 3,271.00, expecting a bullish correction towards my target.
Take Profit: 3,377.00
Stop Loss: 3,165.00
RSI is in oversold, indicating potential exhaustion of sellers.
Price may have created a fake breakout below the trendline, trapping liquidity before bouncing back.
Currently managing the trade, watching how price develops around this key area.
Disclaimer : This is not financial advice. This is my personal analysis shared for educational purposes only.

Gold operation suggestionsLooking back at the market in May and June, although gold has experienced adjustments, its shape is very resilient. In the monthly cycle, the price of gold is firmly above the MA5 moving average. From the perspective of large-cycle technical analysis, this is a typical strong bullish pattern, demonstrating the strong control of the bulls. As the adjustments are gradually in place, the later bullish outbreak is worth looking forward to. However, the adjustment to 3247 this time is not small, so in the short term, the gold price is likely to fluctuate upward. At present, 3451 is an important watershed. Once it is effectively broken through, the gold price is expected to hit the 3500 mark, and I personally believe that 3500 will not be the end point, and it is expected to be refreshed later.
GOLD - at CUT n REVERSE area? Holds or not??#GOLD ... Perfect holdings of our upside resistance area that was actually 3357
And now market just at his current ultimate supporting area, that is 3336-37
Keep close that area and if market thold it in that case we can expect again bounce otherwise not.
NOTE: we will go for cut n reverse below 3336-37
Good luck
Trade wisely

Short gold, it may retreat again after reaching 3340-3350Although the rebound in gold has exceeded my expectations to a certain extent, it is obviously not a good time to chase the rise in gold. The gold rebound mainly benefits from Trump's repeated requests for the Federal Reserve to cut interest rates, which has led to the continued weakness of the US dollar. In fact, we can clearly see that the gold rebound is not supported by trading volume, and the rebound without volume may face the risk of collapse again at any time. So I don't advocate chasing long gold at present.
Currently, gold has rebounded to around 3339, almost recovering most of the losses in the previous downward wave (the starting point of the previous wave was 3350), but gold is still under pressure in the 3340-3350-3355 area. In the absence of volume support, gold may fall again after touching this resistance area.
Therefore, shorting gold is still the first choice for short-term trading at present; at least make sure not to chase high!
You can consider shorting gold with the 3340-3350-3355 area as resistance, and look at the target: 3320-3310-3300

Gold retreats as expected, how to trade in the future📰 News information:
1. Geopolitical situation
2. PMI data
3. Global Central Bank Governors Meeting
📈 Technical Analysis:
Our short orders have achieved profits. I closed the position near 3337, turning losses into profits. Interested friends can follow my previous post. In the short term, I am still optimistic that gold will retreat below 3335-3325. Today, gold rose sharply, and the rebound momentum was strong, while the short-term correction was slightly weak, so the space for a second decline in the short term will be limited. If it falls to the 3333-3323 range during the day and gets effective support, you can consider going long. The short-term upper resistance is 3360-3375.
🎯 Trading Points:
BUY 3333-3323-3315
TP 3341-3355-3360-3375
In addition to investment, life also includes poetry, distant places, and Allen. Facing the market is actually facing yourself, correcting your shortcomings, confronting your mistakes, and strictly disciplining yourself. I hope my analysis can help you🌐.
TVC:GOLD OANDA:XAUUSD FX:XAUUSD FOREXCOM:XAUUSD PEPPERSTONE:XAUUSD FXOPEN:XAUUSD