Gold Eyes QML Resistance: Ready for a PullbackHelloooo!
Gold, after gapping up strongly, has now entered the green QML (Quasimodo Level) supply zone at roughly 3,380–3,390. This zone has acted as resistance before, so a reaction here makes perfect sense.
What I see:
Engulfed Level (3,315.66): Earlier support that got taken out. This is our logical pullback target once the QML zone does its job.
Hurricane Move: The big up-spike looks exhausted now that it’s hit the QML.
Bearish Reversal Odds: if sellers step in around current levels, expect a drop back toward 3,315.
Plan: Watch for bearish candles or a failed rally inside the 3,380–3,390 area. If we see clear rejection, target a swift move down to 3,315, with a further slide possible to the 3,260 demand zone if momentum holds.
Xauusdanalysis

GOLD - at resistance ? Whats next ??#GOLD... market just reached at his current resistance area and that is 3378-79
Keep close and if market holds the cdrop expected from here.
Good luck
Trade wisely
XAUUSD Analysis todayHello traders, this is a complete multiple timeframe analysis of this pair. We see could find significant trading opportunities as per analysis upon price action confirmation we may take this trade. Smash the like button if you find value in this analysis and drop a comment if you have any questions or let me know which pair to cover in my next analysis.

XAUUSD – Is This a Short-Term Top?1. What happened yesterday
After dipping to 3340 in early trading—just shy of the key 3335 support where I was looking to buy—Gold resumed its bullish momentum that began on Friday. During the New York session, price spiked to a new intraday high near 3385. However, the final hour brought a pullback, and since then, Gold has entered a tight consolidation range.
2. Key question: Is Gold forming a short-term top?
The 1H chart shows a new failed breakout attempt above 3380 during the Asian session. This left behind a minor double top, with the neckline sitting around 3370. That level is especially important—it aligns with a short-term rising trendline.
3. Why a correction might follow
• Price rejected above 3380 twice
• Small double top visible on LTF
• 3370 is a make-or-break level (neckline + trendline)
• A break below could trigger a correction of the +1000 pips rally from Friday’s lows
4. Trade plan
While there is some evidence of a potential top, this remains a high-risk and aggressive short.
Any attempt to trade against the trend should be done with tight stops and small size .
5. Final thoughts
A short-term top could indeed be in place, but Gold must break below 3370 to unlock deeper downside. Until then, the bulls are still in control—just taking a breather. ⚖️
Disclosure: I am part of TradeNation's Influencer program and receive a monthly fee for using their TradingView charts in my analyses and educational articles.

Can technical factors boost gold? (Must-read for traders)After three consecutive days of strong rebounds, spot gold has entered a period of sideways trading, trading around $3,370 in the European session, with a short-term seesaw pattern. A slight rebound in the US dollar index has weighed on gold prices, but market expectations of a September Fed rate cut remain supportive. Furthermore, lingering global trade uncertainty has prevented a significant decline in safe-haven demand.
Fundamentals:
Gold's recent upward momentum has been driven by weak US economic data and rising expectations of rate cuts. Last week's non-farm payroll data showed a significant weakening in the labor market, reinforcing market bets that the Fed will begin another round of rate cuts in September. The CME FedWatch tool shows that the market's expectation of a September rate cut has exceeded 90%. Meanwhile, US factory orders plummeted 4.8% in June, further highlighting economic weakness.
On the other hand, US President Trump signed an executive order last week raising tariffs on imports from dozens of countries, with the minimum tariff rate reaching 15% for countries with trade deficits with the US. With these measures about to take effect, this uncertainty continues to weigh on global market sentiment and supports gold's safe-haven properties.
However, a slight rebound in the US dollar partially offset gold's upward momentum. Traders will be watching the upcoming US ISM Services PMI data to determine whether the economic slowdown has spread to the services sector.
Technical Analysis:
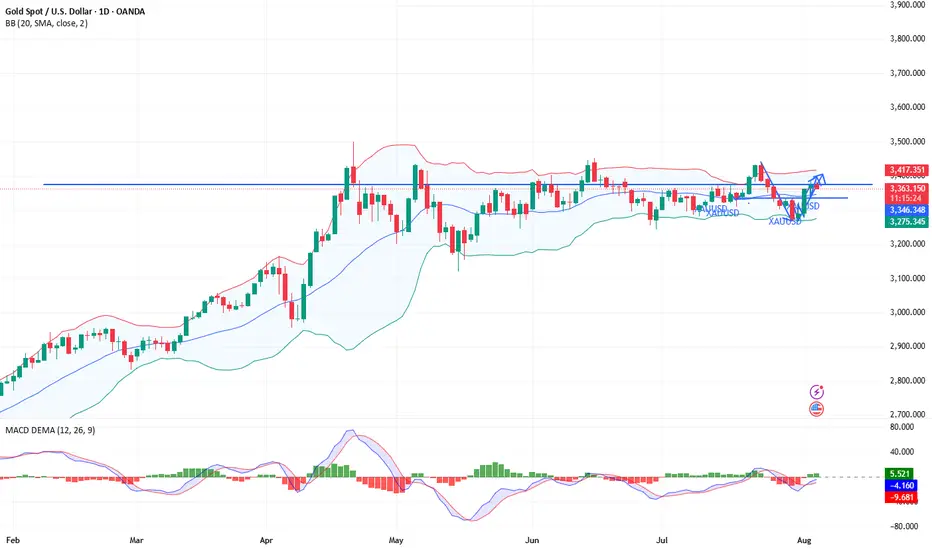
On the daily chart, gold prices have recently traded between the middle and upper Bollinger Bands (3343.59) and 3411.09, failing to break through key resistance. The overall trend remains within the medium-term range, with no clear trend emerging.
The recent candlestick chart pattern forms a typical "sideways fluctuation" pattern, indicating significant pressure near the previous high of 3438.80, while the lower Bollinger Band (3276.09) provides support, suggesting a short-term "box consolidation" pattern.
On the MACD indicator, the fast and slow lines are near the zero axis, while the DIFF and DEA lines have formed a slight golden cross, but the angle is gentle. The red bar has limited momentum, indicating insufficient upward momentum and a lack of a strong rebound.
The Relative Strength Index (RSI) remained at 54.81, within the neutral to strong range, indicating a lack of clear short-term price direction. Market sentiment remains cautious. Further attention will be paid to whether the price stabilizes above the middle Bollinger Band or retreats to test previous support levels.
Market Sentiment Observation:
Current gold market sentiment is cautiously optimistic. Traders are pricing in a high level of interest in the Federal Reserve's rate cut, driving a short-term rebound in gold prices. However, the dollar's resilience remains, limiting gold's upside potential. Indicators show a lack of significant inflows into gold ETFs, suggesting the market has not yet fully shifted to a defensive position.
The technical chart shows a typical "consolidation platform," indicating that the market is awaiting clearer policy or data guidance. Investors remain interested in safe-haven assets, but their willingness to chase higher prices is weak. In the short term, market sentiment may continue to be constrained by fluctuations in external macroeconomic data and shifting policy expectations.
Market Outlook:
Bull Perspective:
Analysts believe that if gold prices break through the upper Bollinger Band at 3411.09 and the MACD indicator expands, further upside potential is expected, with the previous high of $3450 in sight. If the Federal Reserve signals a clear interest rate cut or if the US economy continues to weaken, gold could see a mid-term trend reversal and resume its upward trend.
Bear Perspective:
Analysts believe that if gold prices remain constrained in the 3400-3411 range and fall below the middle Bollinger Band and moving average support, a short-term pullback could occur, testing the lower support band at $3276. If the ISM Services PMI exceeds expectations and the US dollar strengthens again, gold could return to bearish momentum. FOREXCOM:XAUUSD ACTIVTRADES:GOLD ICMARKETS:XAUUSD CMCMARKETS:GOLD PYTH:XAUUSD FOREXCOM:GOLD ICMARKETS:XAUUSD CMCMARKETS:GOLDZ2025 CMCMARKETS:GOLD
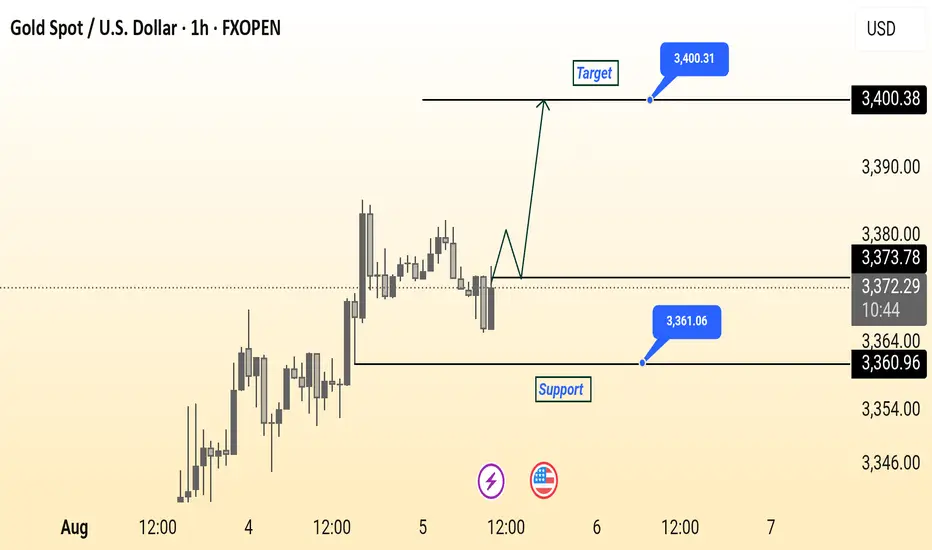
Gold Spot (XAU/USD) 1-Hour Chart Analysis – Potential Upside TowThis 1-hour chart for Gold Spot (XAU/USD) from FXOPEN shows a key support level at $3,360.96 and a potential target at $3,400.31. The current price is hovering around $3,372.04, just below the minor resistance of $3,373.78. A bullish breakout from this zone could initiate a move toward the target, as illustrated by the projected upward path. The support zone marked in blue suggests a strong buying interest that could act as a rebound area if prices dip. Watch for price action confirmation near support for potential long entries.
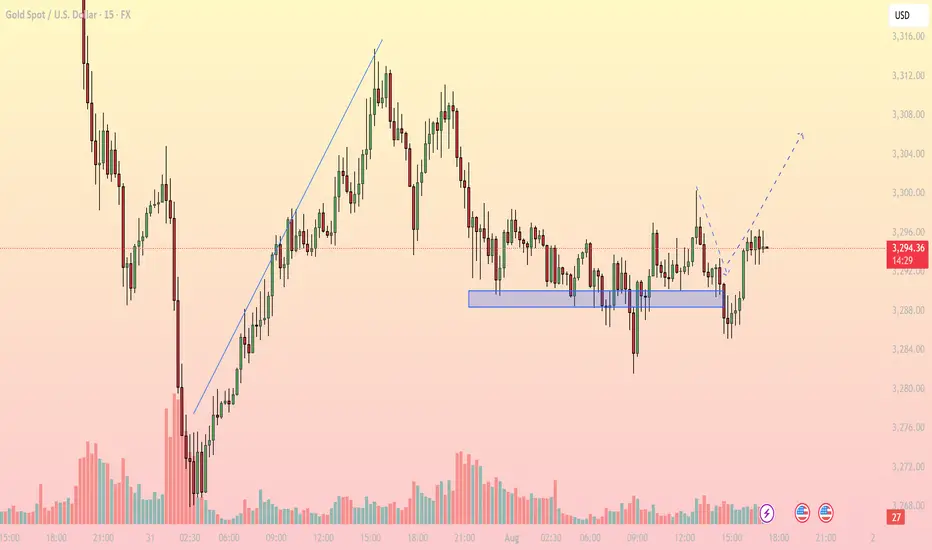
Bullish Rejection from Support, Upside in FocusMarket Overview: On the M15 timeframe, XAUUSD shows signs of a short-term bullish reversal after a prolonged sideways range around the key support zone of 3,286 – 3,289 USD. Price faked out below this support but quickly recovered, forming a V-shape reversal, suggesting strong buying interest has returned.
Key Levels to Watch:
Support Zones:
- 3,286 – 3,289: Strong intraday support, tested multiple times with sharp rejections
- 3,274: Next significant support if the above zone fails
Resistance Zones:
- 3,300 – 3,304: First resistance target aligned with the recent high
- 3,308 – 3,312: Higher resistance area where supply may emerge
Technical Indicators:
EMA: Price has reclaimed the short-term EMAs, indicating bullish momentum on lower timeframes
RSI: Rising above 50 but not yet overbought – there’s room for further upside
Volume: Increasing volume during the bounce confirms buying strength
Trading Strategy:
- Bullish Scenario (Preferred): Entry Zone: Watch for pullback toward 3,290 – 3,292
Stop Loss: Below 3,285
Take Profit 1: 3,300
Take Profit 2: 3,304
Extended Target: 3,308 – 3,312 (if bullish momentum continues beyond breakout zone)
- Bearish Scenario (Alternate): Only valid if price breaks and closes strongly below 3,286
Short Target: 3,274 – 3,270
Note: Counter-trend strategy – higher risk, requires strong confirmation
Conclusion: Gold is showing a bullish price structure on the 15-minute chart. As long as price holds above the 3,286 – 3,289 support zone, the path of least resistance appears to be upward, with 3,300 and 3,304 as the next logical targets. Monitor price action closely during the U.S. session for a potential long setup.
- Follow for more real-time gold trading strategies and save this idea if you find it helpful!
Technical indicators are bullish across the boardInfluenced by the NFP data, gold prices rose strongly, fully recovering last week's losses. The current gold market has broken the previous bull-bear equilibrium and remains in a strong upward trend. We are currently bullish but will not chase the rise. We will wait for gold to fall back and stabilize before trying to go long. Gold is currently in a sideways consolidation. If gold touches the upper short-term resistance of 3365-3370 again in the European session and encounters resistance and pressure, you can consider shorting with a light position and waiting for a pullback. If the gold price breaks up strongly, pay attention to the key suppression level above 3375-3385.
As the price of gold continues to rise, the support has moved up. Pay attention to the short-term support of 3345-3330 below. If it retreats and stabilizes, you can consider going long. Independent traders must strictly implement trading plans, and those who are not sure about the market must set stop-loss orders.
OANDA:XAUUSD

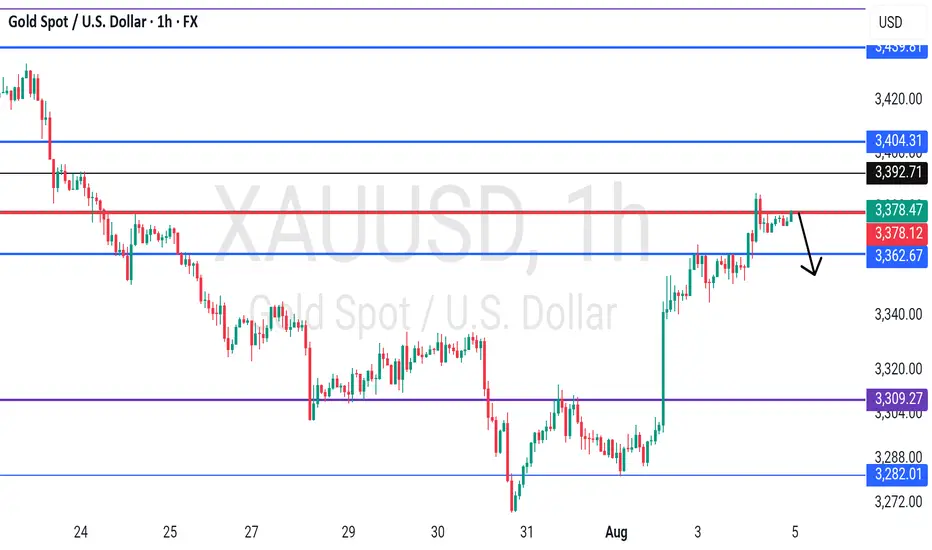
XAUUSD shows bearish divergence. Minor correction or sign of a rXAUUSD shows bearish divergence. Minor correction or sign of a reversal?
On August 4 gold continued bullish momentum, started on August 1 after disappointing nonfarm payrolls report came out that heightened fears about the U.S. economy’s health. Investors now see a 94.4% likelihood of a Federal Reserve rate cut in September. Gold gained further support due to doubts about the Fed’s autonomy after Governor Adriana Kugler resigned on August 1, opening the door for President Trump to appoint a successor who may support his push for lower interest rates. The metal’s safe-haven status was also bolstered by trade tensions, as Trump’s new tariffs on exports from numerous trading partners are scheduled to begin on August 7.
Despite this, in short term gold looks bearish. The price has failed to break through the intermediate level of 3,380.00 and currently trades slightly below this level, showing bearish divergence. The decline towards the SMA50 with further rise towards 3,440.00 is expected here. Second option (less probable) is the price comes back to a level of 3,300.00.

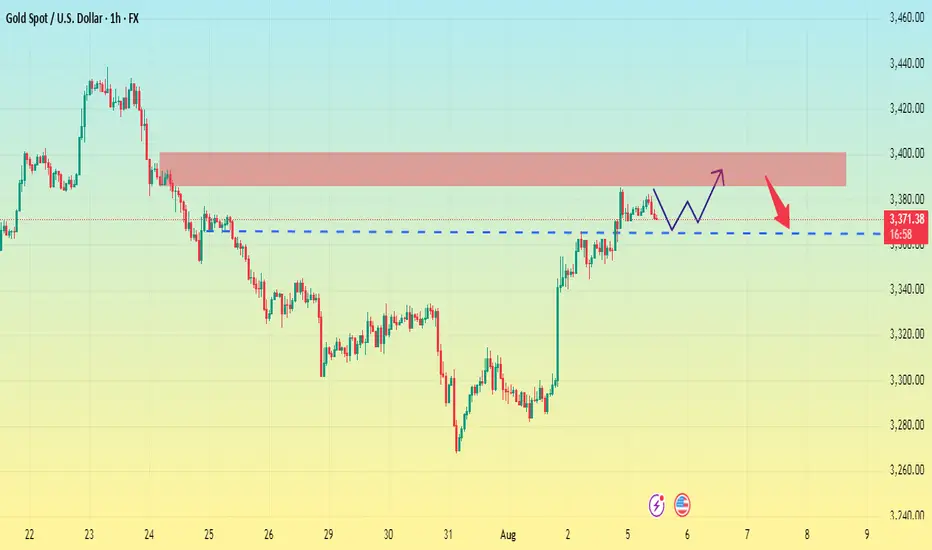
XAUUSD Smart Money Concept (SMC) Setup – 15min We had a clear break of structure (BOS) to the downside after price formed a lower high around the 3,430 level. Price then swept liquidity below the 3,290 area before aggressively rallying.
🔸 Liquidity Grab + Return to Premium:
That strong bullish move was likely engineered to grab liquidity from trapped sellers and induce breakout buyers. Now price is approaching a premium zone (the red supply zone), which aligns with a previous demand turned supply area – a perfect spot for institutional order blocks.
🔸 Order Block:
The red zone (around 3,375–3,385) represents a bearish order block, which caused the previous drop. Price is now retracing into it.
🔸 Internal Structure:
While approaching this zone, price is showing signs of bullish exhaustion. If we get a change of character (CHOCH) inside that zone, it confirms redistribution and signals entry.
📌 Trade Idea (SMC-Based Plan):
POI (Point of Interest): 3,375 – 3,385 (Supply / Order Block)
Confirmation: CHOCH / Rejection wick / Bearish engulfing
Entry: On confirmation inside red zone
SL: Just above the order block (~3,392)
TP1: 3,320 (first internal liquidity pool)
TP2: 3,290 (external liquidity sweep area)
🔽 Expectation:
Price to react to the supply zone, break internal structure, and begin a bearish move back to the demand zone, filling the imbalance left during the previous pump.
🛑 Risk Disclaimer:
This is not financial advice. Trade at your own risk. Use proper risk management and wait for confirmation before entering.

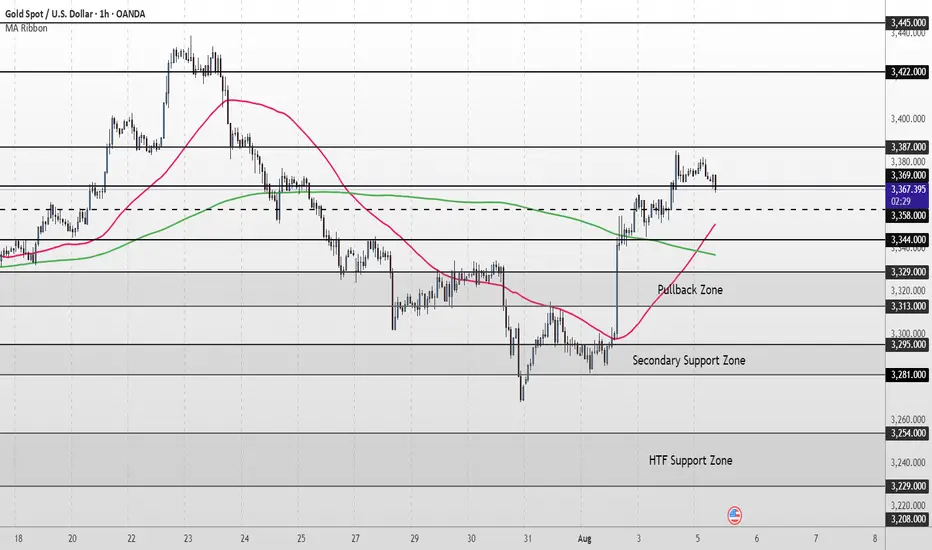
XAU/USD Intraday Plan | Support & Resistance to WatchGold remains in a bullish structure after breaking above the $3,348 level late last week. Price has since advanced into the $3,368–$3,387 resistance zone and is currently consolidating just beneath $3,387.
A clean break and hold above $3,387 would open the path toward the next upside level at $3,422, with $3,445 as the higher target above.
If price rejects here, watch for a pullback into the $3,358–$3,344 zone. This area is now acting as the first support, backed by the rising 50MA which may act as dynamic support. If buyers fail to hold that zone, focus shifts to the $3,329–$3,313 pullback zone — a deeper support where the 200MA is also positioned, adding confluence.
Failure to hold that area would open the door to a drop into the Secondary Support Zone around $3,295–$3,281, followed by the HTF Support Zone at $3,229–$3,208 if bearish pressure accelerates.
📌 Key Levels to Watch
Resistance:
‣ $3,387 ‣ $3,422 ‣ $3,445
Support:
‣ $3,358 ‣ $3,344 ‣ $3,329 ‣ $3,313 ‣ $3,295 ‣ $3,281 ‣ $3,254
🔎Fundamental Focus:
Today’s key event: ISM Services PMI (4:00pm) – high-impact for USD and gold volatility.
Earlier data (Trade Balance, PMI) may cause intraday spikes.
⚠️ Risk Reminder:
Avoid chasing. Let price react, then confirm. Stay sharp around news.
Gold's Next Move? Eyes on the Liquidity Trap Below!Gold has created internal liquidity during the New York session and is now moving downward. There is liquidity resting below the recent swing lows, and beneath that lie bullish Pending Demand (PD) arrays. If the market takes out this liquidity, we can then look for bullish confirmations from the PD arrays for potential buy opportunities.
Do Your Own Research (DYOR).

Gold prices have retreated slightly. Is there an opportunity to From the daily chart:
Gold prices haven't held above 3380, so the primary resistance level remains around 3385.
Currently, the daily moving average support is far from the high, with support below 3340-3360. While the daily trend remains bullish, the risk of a pullback and subsequent upward movement cannot be ruled out.
From the 1-hour chart, Quaid believes the price cannot fall below 3365. 3365 marked the opening high on Monday. Common sense suggests that if gold remains above 3365, it may remain at a high level for a short-term consolidation.
Thus, today's focus is on the key level of 3365. If the price doesn't fall below this level, consider going long at this level, waiting for a profit after another rally to the resistance range, and then shorting within the key resistance range.
Gold is fluctuating at a high level. Latest analysis.On Monday, gold surged to around 3370 in the morning before retreating slightly. It fell back to support near $3345 in the European session. The dividing line between bulls and bears lies below 3340, which also marks the support level and the top-bottom reversal before the close of last Friday's non-farm payroll report.
Quaid planned to go long near 3340 on Monday, but the price rebounded to 3345, halting its decline and then fluctuating sideways, preventing an entry opportunity. However, a short opportunity near 3385 was successfully implemented with a slight pullback. Although it did not reach the expected target, a small profit was achieved after the pullback to 3370.
Monday showed an overall upward trend, with the closing price fluctuating at a high level, reaching a high around 3385 before retracing to confirm 3370. The overall market trend remains upward, with a temporary potential for a move to around $3400. Quaid recommends a buy-on-low strategy today. Currently, the 1-hour moving average is trending flat, and the trend of prices continuing to fluctuate at high levels cannot be ruled out.
Support for Tuesday's pullback lies near 3370. The key to a renewed rally lies at 3360, also the level of resistance before Monday's US market opening. As long as this level remains intact, the overall strategy remains unchanged. Alternatively, watch for a re-break of 3385, with upside targets at 3385-3390-3400.
Strategy:
Long at 3360-3365, stop-loss at 3355, profit range at 3380-3400;
Short at 3395-3400, stop-loss at 3410, profit range at 3370-3350;
Key Points:
First Support Level: 3370, Second Support Level: 3360, Third Support Level: 3350
First Resistance Level: 3385, Second Resistance Level: 3395, Third Resistance Level: 3405.

Gold price today August 5: strong reversalWorld gold prices unexpectedly reversed sharply, as Europe and the US continued to release poor economic data. Specifically, the European economic area announced the investor confidence index released monthly by Sentix GmbH, August at a decrease of 3.7 points, much lower than the increase of 4.5 points in July.
In the US, factory orders released monthly by the US Census Bureau, measuring the change in the value of new orders for goods purchased at US factories, decreased by 4.8% in June compared to the previous month. Although slightly higher than the forecast of a decrease of 4.9%, it decreased sharply compared to the increase of 8.3% in May.
Thus, both the US and the European region are showing weaknesses in economic development. Because new orders in the US are considered a forward-looking indicator of upcoming demand for manufactured goods. Falling orders indicate that the production and business activities of US enterprises will face difficulties in operation.
8/5: Watch for Short Opportunities Near 3400Good morning, everyone!
On Wednesday, gold held above the key support area at 3343–3337, and subsequently broke through the 3372–3378 resistance zone, leading to a strong bullish move and solid long-side gains.
Today, attention should shift to the major resistance around 3400. If bullish momentum continues, price may approach the secondary resistance near 3420. However, from a technical perspective, signs of bearish divergence have begun to emerge. Should price continue rising while momentum weakens, the risk of a short-term correction increases accordingly.
Key levels to monitor:
Primary resistance zone: 3404–3416
Intermediate supply area: around 3398
Crucial support zone: 3372–3363 (a hold here could support further upside)
⚠️ Cautionary Note:
The US PMI data release during the New York session could introduce volatility. Be sure to maintain strict risk management and stop-loss discipline during periods of increased uncertainty.
🔁 Trading Bias for Today:
Prefer selling into strength near resistance, while cautiously considering buying on dips near support.
The 3343–3337 area continues to serve as the primary support zone, and price action around this level will be critical in determining the next directional move

XAUUSD Intraday Signal Analysis – Gold Price Momentum & RSI SetuIn today’s 1-hour chart of XAUUSD (Gold vs USD), we observe a strong upward momentum supported by technical indicators, suggesting a well-defined bullish trend in the short term. Traders looking to capture short-term profits may find this chart setup especially favorable. Here's a breakdown of the price action and what it could mean for intraday traders.
Price Action Overview
The price of gold has surged past the $3,320 mark, showing a clear bullish breakout with a series of higher highs and higher lows. Currently, the market is trading near the $3,378 level, consolidating slightly after a strong upward movement.
The SMA 9 (Simple Moving Average) is providing dynamic support, curving upward and closely hugging the candlesticks. This is typically a sign that buyers are actively pushing the price higher and dips are being bought up quickly.
Additionally, the spread between the Buy ($3,378.78) and Sell ($3,378.51) prices is extremely narrow, suggesting tight liquidity and fast execution potential — ideal conditions for scalpers and short-term traders.
RSI Analysis
The RSI (Relative Strength Index) 14 is hovering around the 68–70 level, which traditionally indicates the asset is approaching overbought territory. However, it hasn’t crossed into the 70+ danger zone yet, which implies there could still be room for further upside.
One key observation is the RSI divergence forming on the right-hand side. While price has been climbing steadily, RSI has started to curve down slightly — this could hint at a minor pullback or consolidation phase before the next big move. Smart traders may consider watching for bullish RSI bounces or hidden divergences before re-entering long trades.
Trade Idea
Trend: Bullish
Support: $3,360 / $3,340
Resistance: $3,400 / $3,420
Signal: Wait for a minor pullback toward the SMA, and look for bullish candlestick confirmation near $3,360 before entering long.
Conclusion
This XAUUSD 1H chart presents a strong case for continued bullish momentum with cautious optimism due to RSI nearing overbought levels. A pullback could offer fresh entry opportunities before a push toward the next resistance zone. Intraday traders and swing traders alike can benefit from closely monitoring price action around the SMA 9 line.

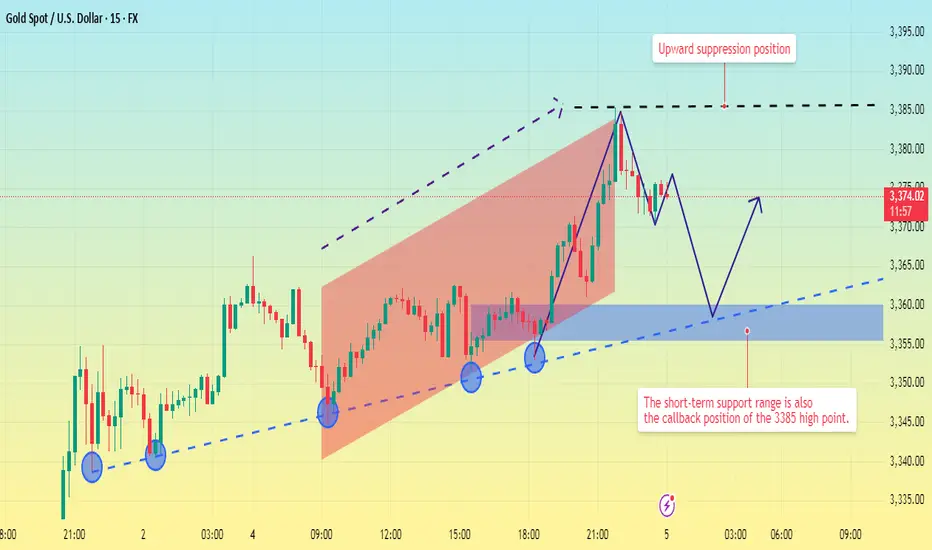
Upward movement suppressed. Price pullback?Gold prices have now perfectly reached the short-selling target range predicted by Quaid.
The current 4-hour chart clearly shows that gold's current resistance level remains around 3385.
Looking at the shorter 15-minute chart, gold has been slowly rising within an upward channel today. The resistance level of 3385 has not been effectively broken, and there is a high probability of a further pullback to test the 15-minute trendline.
Currently, 15-minute trendline support remains around 3355-3360. Focus on this support range in the short term, as it also represents a profit-taking opportunity after shorting at the 3385 high. This level can also be considered a watershed between bulls and bears. If the price pulls back to this level and does not continue to decline, there is a high probability of another upward move at this level.
However, if it falls below the 3350 trendline, the market will enter a downward trend.
Good luck to everyone in the new week.
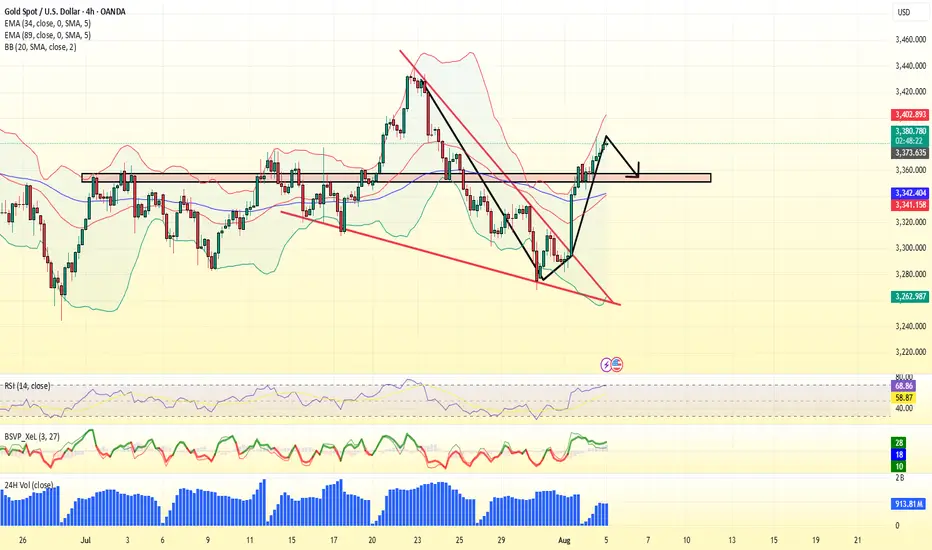
Gold Spot / U.S. Dollar (XAUUSD) 4-Hour Chart - OANDA4-hour performance of the Gold Spot price against the U.S. Dollar (XAUUSD) from late July to early August 2025. The current price is 3,362.895, reflecting a +72.775 (+2.21%) increase. Key levels include a sell price of 3,362.200 and a buy price of 3,363.590. The chart highlights a recent upward trend with a notable resistance zone around 3,395.716 and a support level near 3,336.129, as indicated by the shaded areas.

XAUUSD:BUYThere is no need to worry about holding long orders mentioned last Friday. Gold prices continued to rise this week after a pullback. The price has risen to 3372. According to the research team of our swing trading analysis team, the bullish trend will continue.
Earlier I informed members that some buy orders were closed at high levels. At that time, the short-term high was around 3370. After closing the long orders, the price subsequently fell. This is the advantage of swing trading. You can use accurate trading signals to trade in batches in the short term, thereby creating opportunities for quick profits.
After the pullback, there is still good room for buying and opportunities.

8/4: Watch Support at 3343–3337 and Resistance at 3372–3378Good morning, everyone!
Last Friday, gold rallied strongly, driven by a combination of favorable economic data and bullish technical signals, decisively breaking above the 3337–3343 resistance zone. During the subsequent pullback, price action remained firm above 3337, followed by a secondary upward move.
From a technical standpoint, the structure suggests the potential for continued upward consolidation, with the possibility of filling the gap near 3396. However, significant resistance remains between 3372 and 3378 — failure to break through this zone decisively may result in a short-term pullback before further gains.
Key levels to watch:
Initial support: 3348 and 3337–3343 zone
Major support: 3312–3300 zone (a break below could signal deeper downside risk)
Trading Strategy:
Focus on intraday setups around these critical areas. Look for buy opportunities on dips as long as support holds, while remaining cautious of sharp pullbacks near strong resistance.

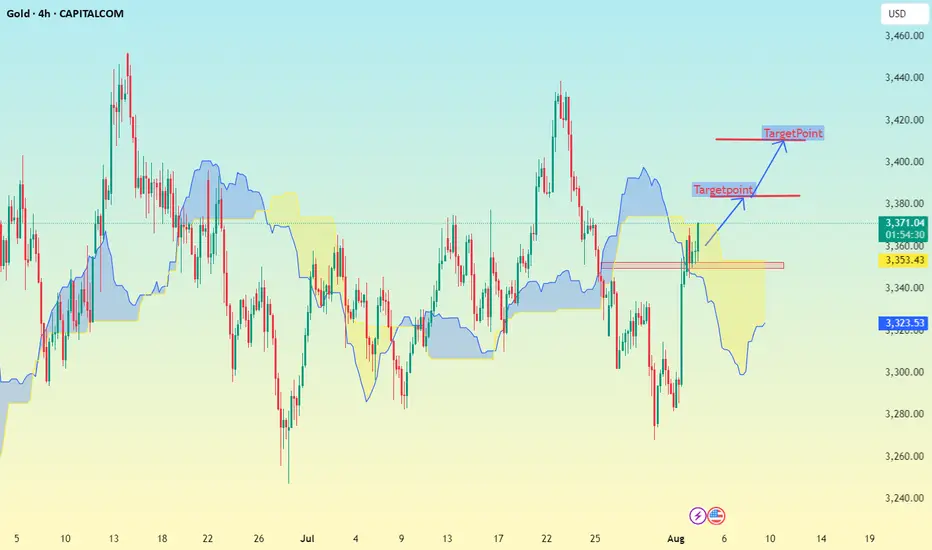
Gold 4H timeframe Based on the chart my shared (Gold 4H timeframe with Ichimoku cloud), here are the identified target points:
📈 Upside Targets:
1. First Target: 3380
This is marked just above the Ichimoku cloud breakout.
It is a short-term resistance zone.
2. Second Target: 3420
This is the higher target zone indicated in the chart.
It aligns with a previous high and potential resistance area.
---
🟡 Key Support:
Support Zone: Around 3322 – 3353
Price needs to hold above this zone to maintain the bullish momentum.
gold on sell reverse#XAUUSD on price reverse, base on the double rejection between 3345-3357. We await for breakout below 3351.6 before selling.
Entry 3351.6, target 3340-3315, SL 3361.
Above 3367 on 2 times breakout holds bullish till 3377 which have sell reject to fall below 3360-3350.
