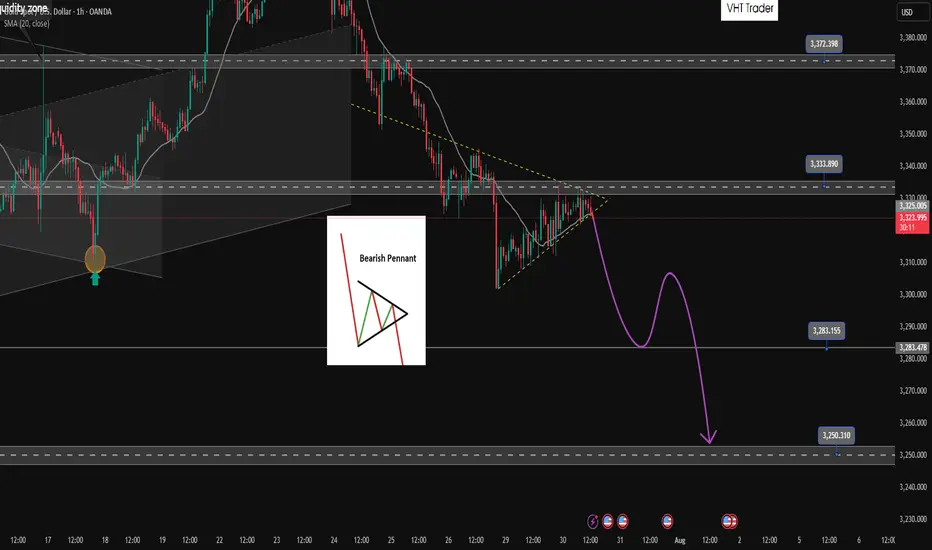
Bearish pennant pattern active. Active SELL✏️Gold price is forming a triangle accumulation pattern. That shows the hesitation of investors at the moment, they may be waiting for important economic indicators of the US this week. Just an impact that makes Price break out of the triangle border can create a strong FOMO trend. The price line is quite similar to the bearish pennant pattern and heading towards really strong support areas.
📉 Key Levels
SELL Trigger: Break bottom line 3324
Target 3285, lower is the 3250 area
BUY Trigger: Break and trading above 3333
BUY Trigger: Rejection and confirmation of candle at 3285
Leave your comments on the idea. I am happy to read your views.
Xauusdanalysis
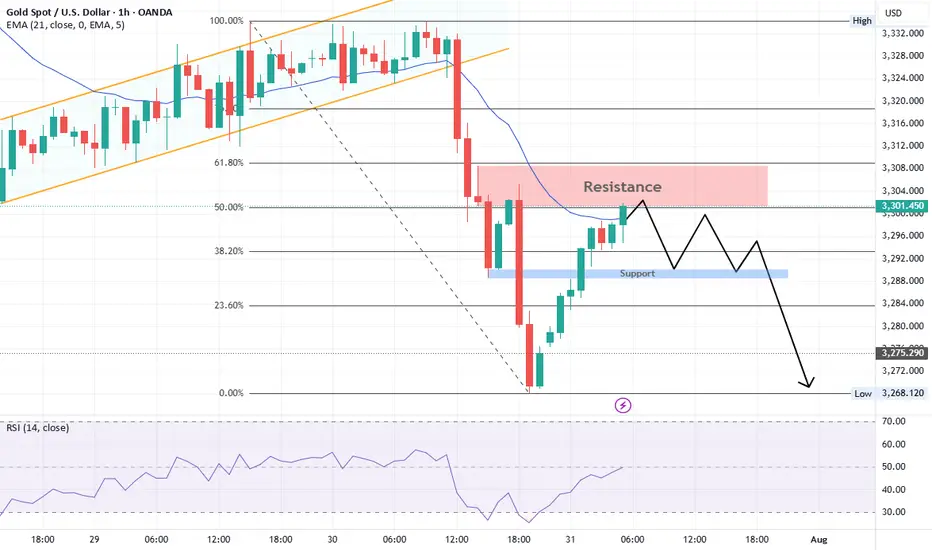
Gold Struggles at Resistance – Indicates Lower Lows AheadGold has been in a clear downtrend after facing a strong rejection around the 3,438 level (main resistance zone). Price is currently moving within a descending channel, confirming the formation of lower highs and lower lows – a classic bearish market structure.
Currently, Gold is trading near 3,306, facing resistance at 3,339 (marked as a possible lower high). If price fails to break above this level and sustain, there is a strong probability of continuation towards 3,249 and even 3,216.
Key Technical Highlights
- Immediate Resistance: 3,339 – 3,353
- Support Levels: 3,301 (short-term), 3,249, and 3,216
A rejection near 3,339 can lead to another leg down targeting 3,249 and 3,216. However, a strong breakout above 3,339–3,353 could temporarily shift momentum towards 3,394.
Note
Please risk management in trading is a Key so use your money accordingly. If you like the idea then please like and boost. Thank you and Good Luck!

Gold bottomed out and rebounded, and gold is still rising!The latest news indicates that Trump has announced a 50% tariff on Brazilian products and a 25% tariff on Indian products, and has firmly stated that the tariffs will take effect on August 1st, with no further grace period. These positive factors will also support a rebound in gold.
As for tomorrow's big non-farm payrolls, considering that both the previous two times were negative and contrary to the ADP, it is very likely to be bullish for gold, which may help boost a steady rebound in gold, so there is no need to worry if you are stuck with gold.
Nothing rises forever, and nothing falls forever. Last week, the market rose in the first half, then fell in the second half. With the first half of this week's decline, the daily chart has already fallen to near the 100-day moving average. Be wary of a rebound in the second half. Gold is bearish today, but don't chase shorts. Focus on the 3300 resistance level. If it breaks above and stabilizes, expect a continued rebound to 3330-3345!
A real-time strategy is like a beacon guiding your investment journey. The market will never disappoint those who persevere and explore wisely. FX:XAUUSD VELOCITY:GOLD FXOPEN:XAUUSD ACTIVTRADES:GOLD PYTH:XAUUSD
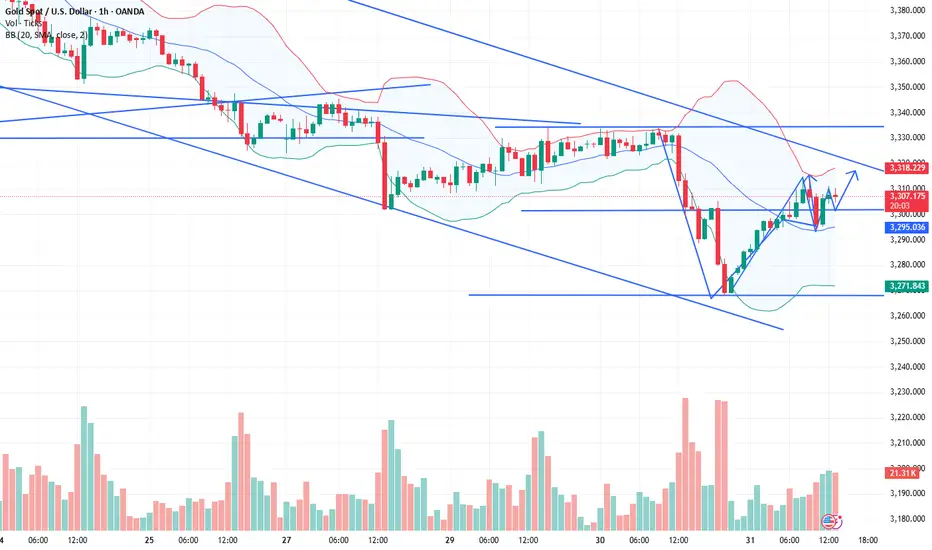
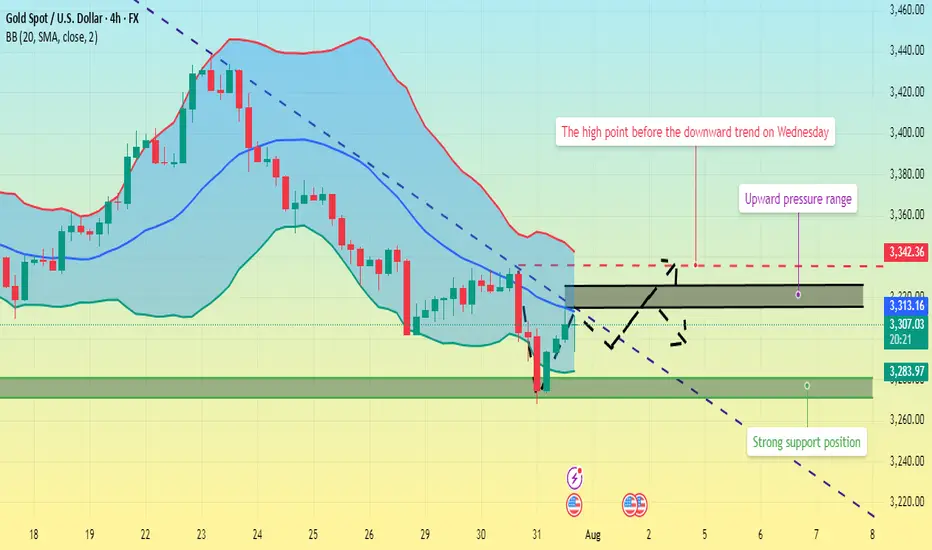
Gold fluctuates. Is the decline halted?Information Summary:
Despite diminished market expectations for a September US rate cut, gold rebounded from a one-month low hit the previous session on Thursday, boosting its safe-haven appeal as newly announced US tariffs sparked new trade uncertainty.
So far, gold has risen 1.15%, hovering around $3,310, a gain of nearly $40 today. On Wednesday, gold prices hit their lowest point since June 30th: $3,267.79.
Market Analysis:
On the 4-hour chart, prices remain below the middle Bollinger Band, with a descending trendline defining the current bearish momentum. Prices rebounded after hitting this month's low on Wednesday. In the short term, watch for price rejection signals near the trendline. Upward pressure currently lies between $3,315 and $3,325, while support lies between $3,280 and $3,270.
Currently, prices are fluctuating upward. Quaid believes the bullish trend may continue. If the current resistance level is broken, it could reach the 3335 high before Wednesday's decline.
Trading strategy:
Go long near 3300, stop loss at 3290, profit range 3320-3330.
XAUUSD Update – Down Continuation to 3250?1. What Happened Yesterday
After an anemic correction that formed a bearish flag, Gold finally broke below 3300 and even dipped under the 3280 support zone — which was my primary downside target. While the move during the day didn’t have enough momentum to reach my second sell limit, I was already in a low-volume short position, so I didn’t miss the move entirely.
2. The Key Question
Has the drop ended, or are we looking at further downside?
3. Why I Expect More Downside
• The overall structure remains bearish.
• The newly formed resistance (previous support) is now the new sell zone.
• If the price drops towards 3280 again, continuation to 3250 becomes very probable.
4. Trading Plan
Selling rallies remains the preferred strategy, especially on spikes into resistance. As long as the price stays below 3335-3340 zone, the bearish outlook remains intact.
5. Conclusion
Sell the rallies. The technical picture still favors downside continuation — no need to overcomplicate it. 🚀
Disclosure: I am part of TradeNation's Influencer program and receive a monthly fee for using their TradingView charts in my analyses and educational articles.
Gold Crashing After Hot U.S. Data – More Pain Ahead?Minutes ago, important indices were released from the US , which catalyzed the continuation of gold's downward trend .
Key U.S. Economic Data Just Dropped!
ADP Employment: 104K
GDP q/q: 3.0%
Both came in stronger than expected , signaling that the U.S. economy is holding up better than many thought!
Strong job growth
Solid economic expansion
The result? A stronger U.S. dollar ( TVC:DXY ) and potential downward pressure on Gold .
All eyes are now on FOMC meeting .
Will the Fed still hint at future rate cuts despite the solid data? Or is the easing cycle officially on hold? What is your idea!?
----------------------
Gold ( OANDA:XAUUSD ) has already managed to break the Support zone($3,350-$3,326) , Monthly Pivot Point , 50_EMA(Daily) , Support lines , and the lower line of the ascending channel . Also, Gold trading below $3,333 plays an important role for me, which can increase the possibility of a continuation of the downtrend .
I expect Gold to drop to at least the Potential Reversal Zone(PRZ) before the FOMO meeting and if the Support zone($3,307-$3,272) is broken, we can expect further declines to $3,253(Second Target) .
--------------------------------
Information we need to know:
How should the Federal Funds Rate be announced to cause a deeper drop in Gold ?
The Fed needs to take a hawkish stance — meaning:
They keep rates unchanged, but make it clear they intend to keep them elevated for a prolonged period.
They emphasize strong economic data like today's solid ADP and GDP numbers .
They express concern that inflationary risks remain, and cutting rates isn’t on the table anytime soon.
In this case, markets get disappointed, rate cut hopes fade, and gold drops as real yields( TVC:US10Y ) rise and the U.S. dollar strengthens.
--------------------------------
Note: Stop Loss (SL) = $3,340
Gold Analyze (XAUUSD), 4-hour time frame.
Be sure to follow the updated ideas.
Do not forget to put a Stop loss for your positions (For every position you want to open).
Please follow your strategy; this is just my idea, and I will gladly see your ideas in this post.
Please do not forget the ✅ ' like ' ✅ button 🙏😊 & Share it with your friends; thanks, and Trade safe.

gold on buy retrace#XAUUSD price have reformed back above 3306, now we are expecting bullish from 3309 on 2 times breakout.
Entry 3309 2 times breakout, target 3326-3335, SL 3297.
Below 3297 holds bearish reversal, target 3270. 3317 will reject, H1 closure there will continue bullish.

Short position profit. Latest strategyYesterday's gold price fluctuated: it maintained sideways fluctuations in the morning and started a downward channel after the opening of the US market. The Federal Reserve's interest rate decision remained unchanged. In addition, Powell's speech suppressed expectations of a September rate cut. The gold price directly fell to around 3267 and closed the day with a negative line, which exceeded expectations.
Looking back at recent trends, gold prices saw a brief correction on Tuesday after four consecutive days of decline, but failed to sustain the upward trend, falling sharply again yesterday, demonstrating that the weak market remains intact. Judging from today's market, theoretically there is still room for further decline, but before yesterday's low is broken, we don't expect a big drop for the time being; if the support here is effective, the market may tend to correct.
Pay attention to the daily resistance near 3315, and try shorting with a light position; the hourly resistance is near 3301, which is also a good position for shorting; the intraday bull-bear watershed is near 3294. If the market falls weakly and rebounds here, there may be a decline. The target below will first look at 3275. If yesterday's low of 3267 is broken, look further to 3250: On the long side, pay attention to the 3249 support below. If it is close to broken, you can try short-term buying.
【Operation ideas】👇
The bearish strategy in the morning remains unchanged. The short position at 3315 was publicly set up in the morning. The market rebounded to 3314 and then went down directly. The idea of setting up short positions at 3301 in the morning session remains unchanged. Friends who did not follow up with the short positions at 3315 can now add short positions with a light position at 3300.
PEPPERSTONE:XAUUSD ACTIVTRADES:GOLD VANTAGE:XAUUSD ACTIVTRADES:GOLD ICMARKETS:XAUUSD VELOCITY:GOLD PYTH:XAUUSD

XAUUSD Long Setup – 1HGold (XAUUSD) has shown strong bullish rejection from the lower volatility band after a sharp selloff. The appearance of a Heikin Ashi reversal candle, suggests a short-term reversal is forming. Price has reclaimed key structure and is now targeting a reversion back to the mean, supported by Fibonacci retracement levels.
Entry: 3293.55
Target Zone: 3308.91 → 3333.76 (Fib 38.2% – 100%)
Stop Loss: 3253.35
Confluences:
✅ Bullish engulfing + Heikin Ashi trend shift
✅ Oversold bounce from lower channel extremity
✅ Fib retracement aligns with key structural resistance zones
✅ Custom signal confirmation (green dot)
✅ Clean R:R toward upper band and previous POI
Short-term counter-trend long targeting liquidity grab and mean reversion toward the 3308–3333 zone. Risk tightly managed with SL below local swing low.


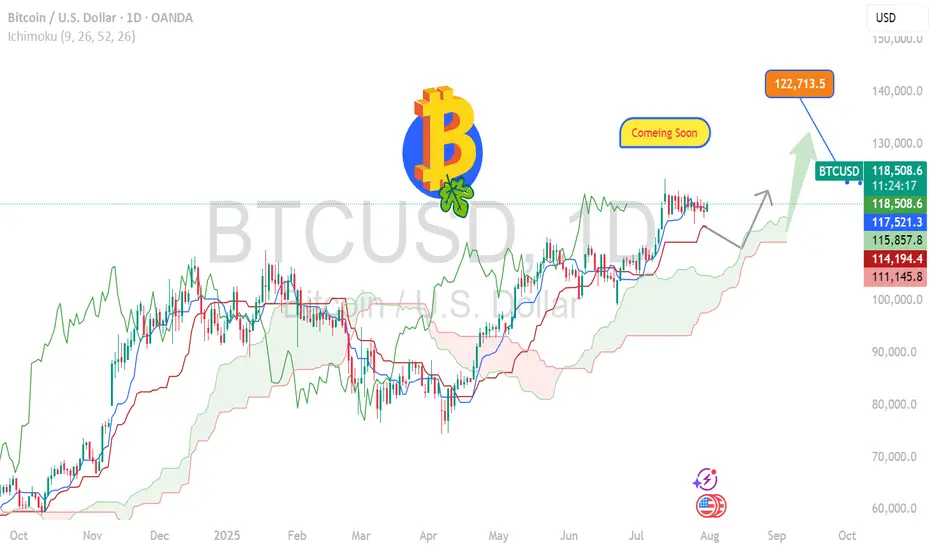
BITCOIN- Charging Towards 122k Momentum Building BTC/USD Long Setup – Targeting 122K 🔥
Bitcoin is holding strong above 118500, signaling bullish momentum.
✅ Price broke key resistance & forming higher lows.
🟢 Current structure favors buy-side continuation with next major target at 122000.
Support Zones:
🔹 117800 – intraday bullish retest
🔹 116500 – strong demand zone
Resistance Ahead:
🔸 120200 – short-term reaction
🔸 122000 – major target
🚀 Expecting bullish wave continuation.
If momentum sustains above 118K, 122K breakout highly probable!
#BTC #Bitcoin #CryptoSetup #BTCUSD #CryptoTrading #BTC122K #ChartAnalysis #BullishBreakout
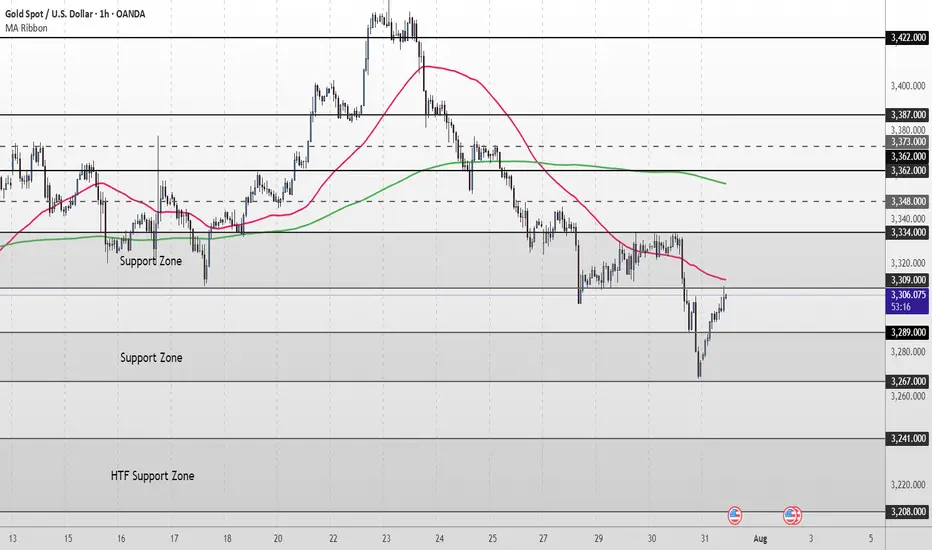
XAU/USD Intraday Plan | Support & Resistance to WatchGold staged a minor recovery overnight after bouncing from the 3,267 Support Zone, and is now trading around 3,305. Price remains below both the 50MA and 200MA, which continue to slope downward—confirming short-term bearish structure.
This current move is still corrective unless bulls manage to reclaim the 3,309–3,334 resistance zone. A clean break and hold above 3,334 would be the first sign of strength, opening up potential retests of 3,348 and 3,362.
Until then, any rallies into the 3,309–3,334 zone should be viewed with caution. If the bounce loses steam, watch for a retest of 3,289 - 3,267. A break below that would expose the 3,241 and 3,208 levels, with the HTF Support Zone (3,241–3,208) acting as a broader downside cushion.
📌 Key Levels to Watch
Resistance:
‣ 3,309
‣ 3,334
‣ 3,348
‣ 3,362
Support:
‣ 3,289
‣ 3,267
‣ 3,241
‣ 3,208
🔍 Fundamental Focus – Thursday, July 31
Big day for data.
🟥 Core PCE, Employment Cost Index, and Unemployment Claims — all critical for Fed outlook and could move gold sharply.
⚠️ Volatility expected around 2:30pm. Stay nimble and manage risk carefully.
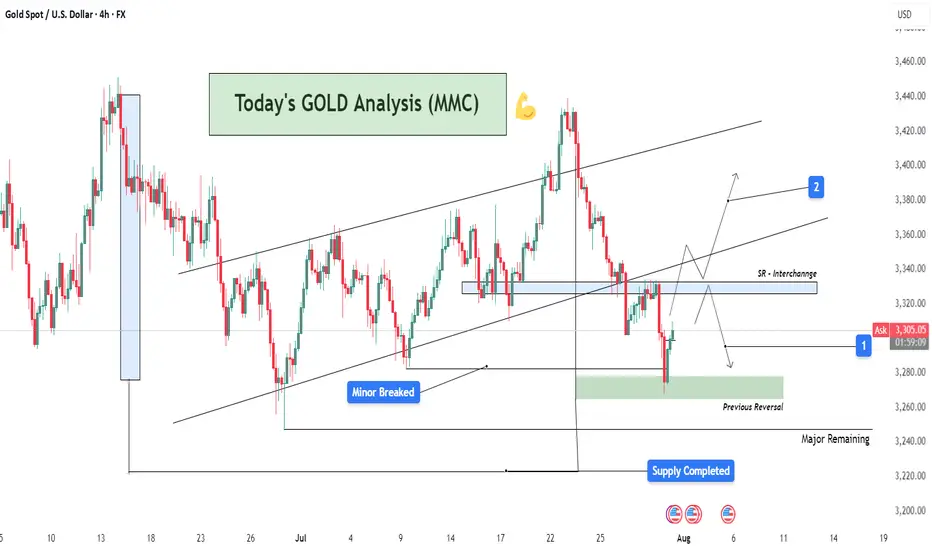
XAUUSD Analysis : Channel Break, Demand Zone + SR - Interchange"High-Probability Zone Reaction & SR Flip Confirmation"
Gold (XAUUSD) is currently reacting from a significant support zone after completing a bearish breakout from a well-established ascending channel. The market structure indicates both threat and opportunity depending on how price behaves around key levels ahead.
🔍 Structure Breakdown & Price Behavior:
🔹 1. Rising Channel Violation
Over the past few weeks, price was comfortably moving inside a well-respected ascending channel, making higher highs and higher lows.
Recently, however, price broke below the lower boundary, which is often a bearish signal—indicating a possible trend reversal or a deeper correction phase.
Such breakdowns suggest buyers are losing control, and bearish sentiment is gaining strength.
🔹 2. Supply Zone Reaction & Drop
Before the breakout, we observed a sharp rejection from a high point, triggering a sell-off.
The price completed its move into a previously defined supply zone, resulting in a strong bearish impulsive leg that pushed it outside the channel.
This move shows clear institutional distribution—where large sellers unloaded positions around that zone.
📍 Key Zone Focus:
🟩 Previous Reversal / Demand Zone (Green Box)
Price is now sitting in a historically strong demand zone, which acted as a major reversal point in the past.
This area is marked as the first zone of interest where buyers might step back in to defend.
The green box represents a liquidity pocket where institutions previously accumulated positions—hence it’s a strong bounce candidate.
🟦 SR Interchange Zone (Blue Box)
The next major level above current price is the SR Interchange zone, around 3,320–3,340.
This level was previously broken and now acts as resistance.
It's crucial because it represents the battle zone where the market will decide whether to continue bearish or shift back bullish.
🧠 Market Psychology & Order Flow Insight:
The recent aggressive selling pressure from the highs, followed by a bounce from the demand zone, shows a shift from euphoria to fear.
Sellers are active at supply, while buyers are attempting to defend the previous demand.
The market is currently in decision mode—and the SR flip zone (3,320–3,340) will be the judge.
A break and retest above this level signals strength and potential for a trend resumption.
A failure to reclaim it would confirm bearish dominance and open doors for deeper targets.
🔄 Possible Scenarios Ahead:
📈 Scenario 1 – Bullish Rejection & Breakout:
If buyers successfully hold the 3,280–3,260 demand zone and push price above the SR Interchange zone, we can expect:
📍 Target 1: 3,360 (mid-term resistance)
📍 Target 2: 3,400–3,420 (previous high & upper trendline)
This would confirm a fakeout from the channel and a bullish continuation pattern.
📉 Scenario 2 – Failure at Resistance & Drop Continuation:
If price fails to reclaim the interchange zone, expect a retest of the green demand, followed by a potential drop toward:
📍 3,260 – local support
📍 3,240 – major support (unfilled demand below)
📍 3,220–3,200 – ultimate downside target
This would solidify a bearish market structure, confirming the sellers are in control.
🧭 Key Levels To Watch:
Level Type Price Range Significance
Supply Zone ~3,400–3,420 Major institutional selling area
SR Interchange (Blue) ~3,320–3,340 Critical resistance / flip zone
Current Price ~3,297 Watching reaction for momentum shift
Demand Zone (Green) ~3,280–3,260 Key support / bounce zone
Major Demand Pending ~3,240–3,220 Next support level if drop continues
✅ Conclusion:
Gold is at a critical inflection point.
The recent bearish breakout signals weakness, but the current support zone may provide a short-term bullish setup if buyers defend it effectively. A successful reclaim of the SR flip zone will shift sentiment bullish again. Otherwise, a deeper correction is likely.
This setup is ideal for both swing and intraday traders—look for confirmation signals at the current support and SR zone before executing trades.
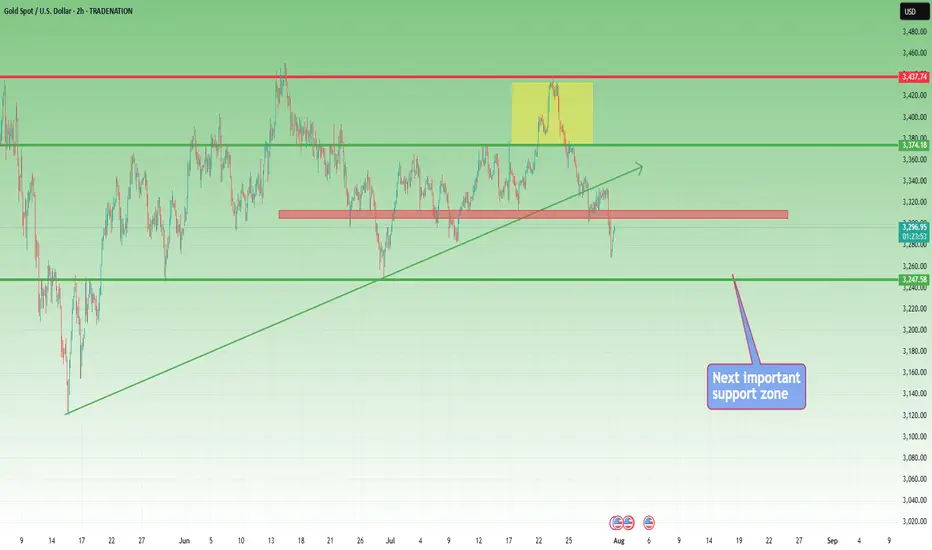
Short selling remains the main themeGold hit a low of around 3267 yesterday and fluctuated until closing at 3274. Gold fluctuated upward at the opening today. Currently, gold is fluctuating around yesterday's rebound point of 3305. This is the resistance we need to pay attention to in the short term.
From the 4H analysis, today's short-term resistance is around 3305-3315. If gold wants to rise, it needs to stabilize above 3315. Focus on the 3335 first-line pressure, and rebound to the 3305-3315 resistance area during the day. You can consider shorting and follow the trend to see the decline unchanged, looking towards 3290-3280. Rely on this range to maintain the main tone of high-altitude participation. For the middle position, watch more and do less, be cautious in chasing orders, and wait patiently for key points to enter the market.

XAUUSD H2 | Downside Target 3270Gold (XAUUSD) recently rejected from a key resistance zone around 3300, showing strong bearish momentum on the 2H timeframe.
💡 Setup Idea:
• Price broke support → Retest as new resistance ✅
• Clean imbalance left behind → Fills expected 📉
• Target: 3270 zone (300 pips move) 🎯
• Risk-Reward potential is solid for intraday/swing entries.
Trade Plan:
If price holds below 3300, we expect continuation toward the 3270 zone. This area also aligns with previous structure and liquidity grab.
🕐 Timeframe: 2H
📌 Resistance: 3300
🎯 Target: 3270
📍 RR: 1:2+
#XAUUSD #GoldSetup #PriceAction #SmartMoney #FXTrading #TradingView #ForYou

GOLD Breakdown Setup | Clean Sell Targets Ahead!XAU/USD (Gold) Analysis – 2H Timeframe
After a clear rejection from higher levels, Gold has pulled back to retest the broken support zone around 3340–3350, which now acts as a resistance.
If the price sustains below this zone, we can expect a smooth move down toward clean liquidity areas below.
This is a textbook bearish continuation setup. 💥
🔻 Trade Idea – Short Setup:
• Sell Below: 3,340
• Target 1: 3,300
• Target 2: 3,280
• Stop Loss: 3,355 (above resistance zone)
🧠 Confluences:
• Bearish market structure
• Support zone retest
• Trend continuation
• High-impact USD news ahead (watch for volatility)
📅 Key Dates: July 30 – Aug 1
⚡ NY session could trigger the move!

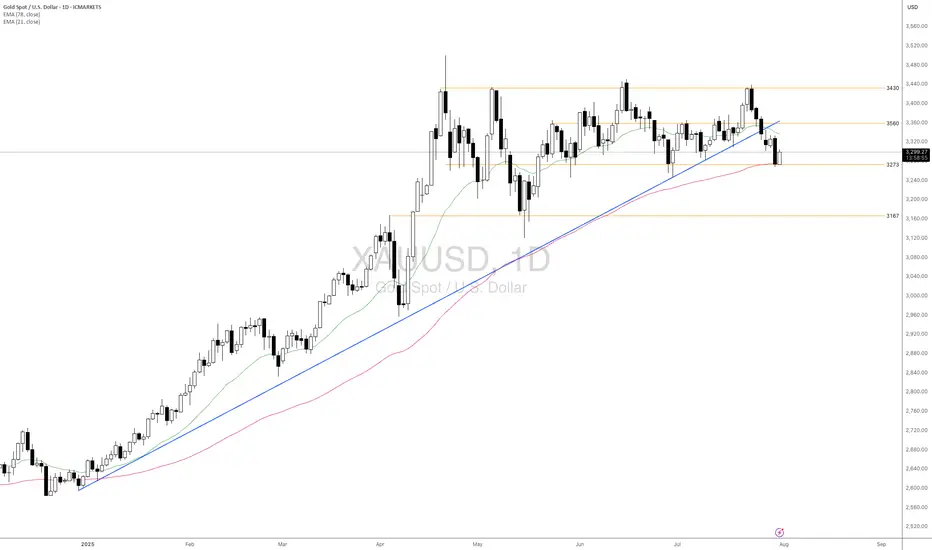
Will Upcoming Data Determine the Next Gold's Direction?Macro approach:
- Gold retreated this week, reversing early gains to trade near four-week lows amid renewed US dollar strength and caution ahead of the Fed's policy decision.
- The retreat was mainly pressured by stronger-than-expected US economic data and a tentative revival in risk appetite, offsetting pockets of safe-haven demand.
- Key drivers included robust US GDP growth for 2Q, a bounce in consumer confidence, and the Fed's steady rates with a more hawkish tone, suggesting cuts may be further out.
- Meanwhile, recent US-EU and US-China trade deals eased some global uncertainty, damping gold's appeal as a hedge.
- Market participants also eyed the labor market's continued cooling, but resilient consumer spending further buoyed the dollar.
- Gold may remain volatile, with potential upside if upcoming US PCE inflation and NFP reports disappoint expectations. Any escalation in trade tensions or signals of Fed policy easing could renew support for gold prices.
Technical approach:
- XAUUSD fluctuated within the range of 3285-3560, which is below the broken ascending trendline. The price between the two EMAs awaits an apparent breakout to determine the next trend.
- If XAUUSD breaks below the support at 3273, confluence with EMA78, the price may plunge to retest the following support at 3167.
- On the contrary, remaining above the support at 3273 may lead XAUUSD to retest the resistance at around 3560.
Analysis by: Dat Tong, Senior Financial Markets Strategist at Exness
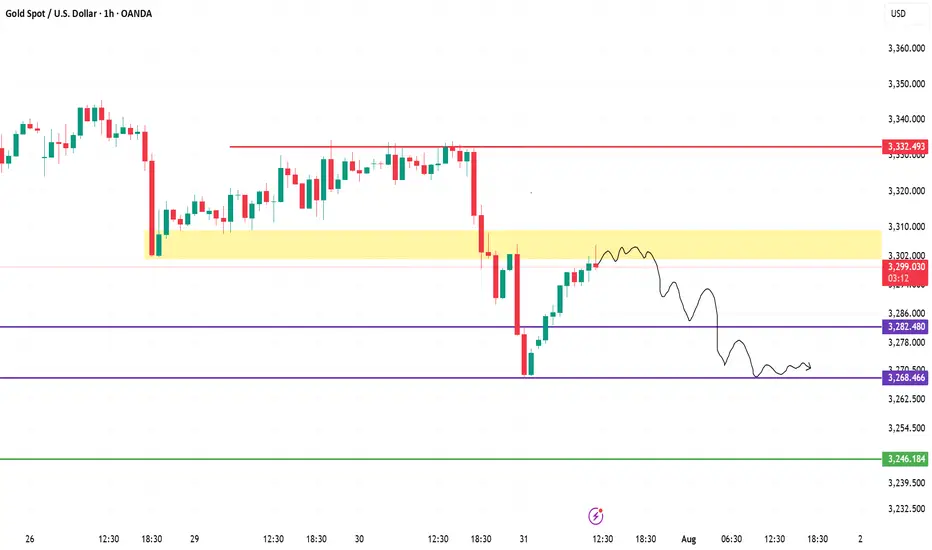
XAUUSD (Gold) Analysis – 1H Chart | July 31, 20251. Fakeout & Rejection from Supply
Price faced sharp rejection near the 3,332 resistance. The strong red candle indicates aggressive selling and liquidity grab.
2. Retest of Broken Demand Zone
Gold is now retesting the **3,298–3,305** yellow zone, which previously acted as demand but may now flip to resistance (supply).
3. Bearish Market Structure
The price formed a **lower high and lower low** pattern — a clear sign of downtrend resumption. Current bounce looks corrective.
4. Projection: Potential Drop Ahead
As per the drawn path, if price fails to reclaim above 3,305, a likely drop toward 3,282, then 3,268 is expected.
5. Key Levels to Watch
Resistance: 3,305 → 3,332
Support: 3,282 → 3,268 → 3,246
Bearish bias remains valid below 3,305.
Gold Faces Strong Rejection Below $3,365 – Bearish Wave Ahead?Gold is currently trading around $3,359, showing signs of exhaustion after climbing from the $3,248 low. The chart illustrates a textbook scenario of channel rejection after testing the upper boundary of the descending wedge and failing to break above the $3,365–$3,392 resistance zone. Price is now hovering just below the diagonal black trendline, indicating a potential lower high formation and setting up for another bearish wave.
📌 Key Technical Highlights
Resistance Zone: $3,365–$3,392
This area marks the confluence of the black long-term trendline, the top of the descending purple channel, and the previous high at $3,392.
Price attempted a "Possible Retest" as annotated on the chart and is now starting to pull back—showing signs of bearish rejection.
Bearish Scenario (Blue Arrows):
Multiple downward arrows show likely bearish paths if the current resistance holds.
Key short-term targets:
$3,337, $3,320, $3,303, Strong support at $3,293–$3,248
Further downside may test extension levels toward $3,220–$3,200 by early August if momentum builds.
⚠️ Bearish Confirmation Criteria
Failure to close above $3,365 (black trendline)
Breakdown below $3,337 followed by $3,320
Strong selling pressure supported by fundamentals (e.g. USD strength, Fed hawkish stance)
✅ Invalidation / Bullish Outlook
A decisive breakout and close above $3,392.73 would invalidate the bearish structure.
In that case, targets would shift toward:
$3,412, $3,434, $3,490 (long-term trendline intersection)
However, today's U.S. CPI (Consumer Price Index) release adds a layer of volatility and potential trend disruption, making this a high-risk trading day.
📊 CPI News Impact – What to Watch
High CPI (Stronger than forecast):
- Increases expectations of further Fed tightening → strengthens USD → bearish for gold
- Likely scenario: sharp drop toward $3,337 → $3,320 → $3,293
Low CPI (Weaker than forecast):
- Signals disinflation → weakens USD → bullish for gold
- Possible breakout above $3,365 → retest of $3,392 → if broken, target $3,412 and $3,434
Neutral or as expected CPI:
- Likely leads to whipsaw — fakeout on both sides
- Caution advised — wait for candle close confirmations post-news
Note
Please risk management in trading is a Key so use your money accordingly. If you like the idea then please like and boost. Thank you and Good Luck!

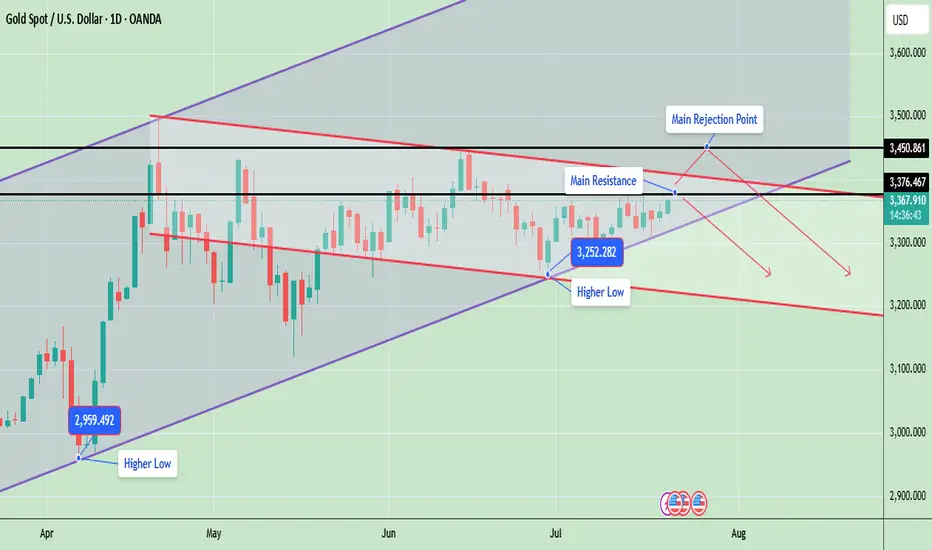
Gold Price Update – Testing Key ResistanceGold is currently trading around 3367, showing strong bullish momentum as it continues to form higher lows, which indicates an ongoing uptrend. The market structure is developing inside a rising wedge pattern, with the price consistently respecting both the ascending support and resistance lines.
Gold is now testing a key resistance zone between 3376 and 3450, an area that previously acted as a major supply zone and caused sharp rejections. A successful breakout and close above 3450 will likely confirm a bullish continuation and may open the door for a rally toward 3500 and possibly 3580. However, if gold fails to break this level, it could retrace back to the 3300 or 3250 support zones, especially if a rejection candle forms in the daily timeframe.
📊 Key Technical Highlights:
- Price has approached the upper resistance boundary of the wedge.
- Daily candle is bullish, indicating strong buying momentum.
- However, unless price closes above 3,376–3,450, there’s still a risk of rejection from the top channel and a pullback toward 3,300–3,250.
🔑 Key levels to watch:
- Gold is currently trading around $3,367, just below a crucial horizontal resistance at $3,376
- A strong breakout above $3,376, and especially above $3,450, could open the door for further bullish movement toward the $3,500–$3,600 range, following the upper trendline of the ascending channel.
- On the downside, if price fails to hold the higher low at $3,252, a drop toward $3,200 or even $3,100 is possible aligning with the downward red trendline.
- The structure remains bullish overall, as price is still making higher lows and staying within the rising channel
📊 Weekly Gold Chart Analysis
Gold is currently trading around $3,368, forming a symmetrical triangle pattern on the weekly timeframe. This pattern typically indicates a period of consolidation before a potential breakout in either direction. The price is getting squeezed between lower highs and higher lows, which is a sign of decreasing volatility and approaching breakout.
🔑 Key Technical Insights:
- ✅ Current Structure: Price has been consolidating within a triangle since April 2025 after a strong upward move. It is now near the apex of the triangle, suggesting a breakout is imminent—most likely in the next 1–2 weeks.
🔼 Bullish Breakout:
- If gold breaks above the triangle resistance (~$3,385–$3,393), it could trigger a sharp rally.
- Upside targets post-breakout: $3,450, $3,500, $3,600+ (if momentum continues)
🔽 Bearish Breakdown:
- A break below the triangle support (~$3,335–$3,325) may lead to a deeper correction.
- Downside targets post-breakdown: $3,285, $3,200
- Possibly $3,100–$3,050 if bearish sentiment intensifies
📉 Volume Drop:
As typical with triangles, volume has likely decreased, signaling indecision. Once volume returns, it will likely confirm the breakout direction.
Note
Please risk management in trading is a Key so use your money accordingly. If you like the idea then please like and boost. Thank you and Good Luck!
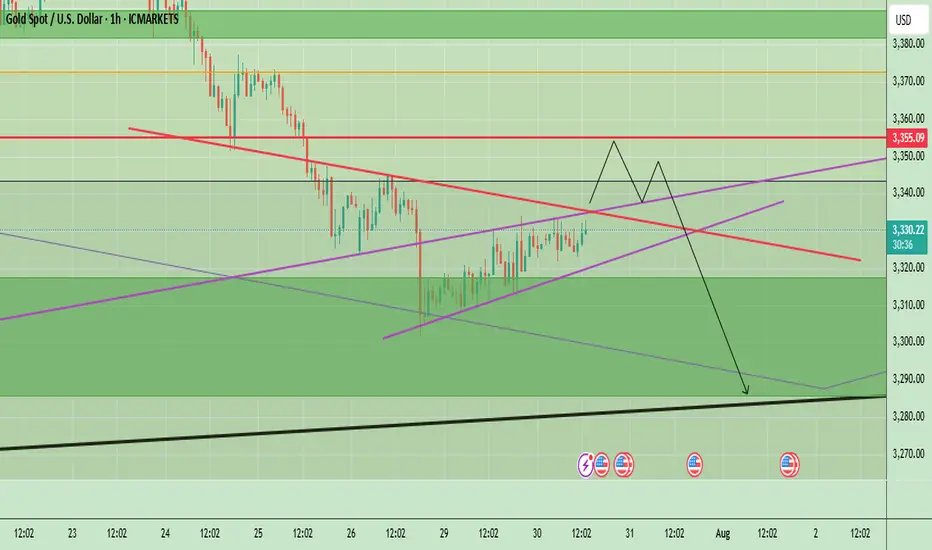
Gold Awaits Fed Rate Decision – Key Levels & Volatility AheadGold is currently trading near $3,332, showing a minor recovery after recent downward momentum. The price action on the 1-hour chart highlights a short-term ascending structure, which often acts as a corrective move rather than a strong bullish trend. The market previously saw significant selling pressure from above $3,355–$3,360, creating a short-term supply zone. Unless the price breaks and holds above this zone, the overall momentum remains bearish.
The chart also shows a projected price path where gold could push slightly higher toward $3,355, meet resistance, and potentially reverse downward again. Key support lies at $3,320, and if this breaks, we could see gold testing $3,290–$3,280 levels, aligning with the black trend line support. However, if bulls manage to break above $3,360, it would signal potential upside continuation toward $3,380–$3,400.
Key Points
- Key Resistance Levels: $3,355 and $3,360 (critical supply zone).
- Key Support Levels: $3,320 (short-term), followed by $3,290–$3,280 (major trendline support).
- Expected Short-Term Move: Possible push toward $3,355 → rejection → decline back toward $3,320 and possibly $3,290.
Bullish Breakout Scenario: A strong close above $3,360 could push price toward $3,380–$3,400.
Overall Bias: Bearish while trading below $3,360.
4hr Chart
Price remains under pressure below the descending trendline. A small pullback toward $3,345–$3,350 is possible, but as long as price stays under this resistance, the bias remains bearish with potential downside targets around $3,300–$3,280.
Key Levels:
- Resistance: $3,350 → $3,381 → $3,394
- Support: $3,324 → $3,281 → $3,254
Today’s FOMC interest rate decision is a key driver for Gold. Here’s the quick analysis:
- If Fed Hikes Rates or Maintains Hawkish Tone:
- Strong USD likely → Gold could face more selling pressure.
- Key support zones: $3,324 – $3,300, then $3,281 and $3,254.
- If Fed Pauses or Turns Dovish:
- Dollar weakens → Gold may bounce toward resistance zones.
- Upside levels: $3,355 – $3,360 and higher toward $3,381 – $3,394 (Fib levels).
Expect high volatility; $3,300 is a critical support to watch. A dovish Fed may give Gold short-term relief, but a hawkish stance could accelerate the downtrend.
Note
Please risk management in trading is a Key so use your money accordingly. If you like the idea then please like and boost. Thank you and Good Luck!
Gold Price Update – Bearish Flag Signals Possible Drop AheadGold is currently trading around $3,324, showing consolidation after a recent decline from the $3,345 region. The chart shows a bearish flag pattern forming after the sharp drop, indicating potential continuation of the downtrend. If gold fails to break above this region, sellers may push the price lower towards $3,301 and possibly $3,275.
The descending trend line adds further bearish pressure, limiting upside momentum unless gold decisively breaks and holds above $3,345. Overall, gold remains under short-term bearish sentiment, with the focus on support retests. Any bullish momentum will only be confirmed if the price closes above the flag and trendline resistance.
Key Points
Resistance Zones: $3,328 (0.618 Fib), $3,345 (flag top).
Support Zones: $3,301 (Fib base), $3,284, and $3,275 (bearish extension).
Trend Outlook: Short-term bearish unless price breaks above $3,345 with volume.
Bearish Targets: $3,301 → $3,284 → $3,275.
Bullish Invalidations: Break and close above $3,345 may shift bias to bullish.
Note
Please risk management in trading is a Key so use your money accordingly. If you like the idea then please like and boost. Thank you and Good Luck!
