XAUUSD BULLISHDo not look for sell opportunity on it. As we all know that the situation between Israel and Palestine is not good and the conflict getting rise because other countries are getting involved in it. Every support is an opportunity to buy GOLD.
Xauusdbullish

XAUUSD LongOANDA:XAUUSD
In the 4-hour timeframe, a shooting star candle has been confirmed, while the daily candle has closed in shooting star form, but its confirmation is yet to be established. As a result, a correction may be expected, albeit one that is likely to be minor. The bullish trend of gold is being driven by the current state of affairs in the Middle East. Regardless, the price is expected to rise to a specific area, with or without correction.

XAUUSD BullishThe war between Israel and Palestine spreading fast and other countries are getting involved in it, which is much dangerous situation. In this regard people are converting their money into GOLD, that's the reason of bullishness in GOLD.

XAUUSD BullishDue to the war between Israel and Palastine, Gold rise much on Friday. If this continue (War) then Gold will fly more.

Bullish Outlook on XAUUSD - 13 OctoberOn the H4 timeframe, price is exhibiting bullish order flow, forming higher lows and higher highs, which manifested itself as an ascending channel. Price has recently tapped into a key resistance-turned-support level at 1869, which is in line with the 50% fibonacci retracement. A throwback to this level will provide the bullish acceleration towards the next support-turned-resistance level at 1902.50, which coincides with the 100% fibonacci extension. Price is hovering above Ichimoku cloud and 20 EMA, supporting our bullish bias.

XAUUSD BulluishThe GOLD market is on its major support line and also on weekly support which is giving us much bullish signs. I am looking for buying opportunity on it in next week. Every support on H4 and H1 time frame is best time to buy GOLD.

"Gold's Battle at 1944: A Crossroads"#XAUUSD On September 1st, encountered a formidable resistance barrier at 1950 and subsequently began its descent toward the established support level at 1885. Interestingly, the downward trajectory was interrupted as gold found a reversal point around the 1900 mark. Currently, the precious metal is in the process of retesting the 1944 resistance level.
Should gold successfully breach the resistance at 1944, it could signal a potential bullish move, with the price poised to ascend towards higher levels, possibly reaching 1985. However, if the resistance at 1944 holds firm, there remains the possibility of a downward correction in the gold market.
Sell Entry - 1942
TP1 - 1900
TP2 - 1885
Buy Entry - 1946
TP1 - 1980
TP2 - 2015
SL - Join Our Channel

XAUUSD BUYAs per the candle sticks pattern, I got this trade on M30 time frame. I think it may rise. It will be better to make your own analysis first then look for buying opportunity.

XAUUSD (Bullish)I have share four reason that why we have to buy XAUUSD (GOLD). 1st is trendlie, second is Supply zone which is at 1947, third is trend line from swing high to swing low and last one is fibonacci retracement which is same at 1949 (0.618).

XAUUSD | Price Action | New Week perspective | follow-up detailsWelcome back to another episode where we dive deep into the dynamic world of Gold. The bulls' recent positive traction lifted Gold's price on Friday; Breaking a four-day losing streak, it surged from its lowest point since March, hovering above the pivotal $1,885 zone.
Adding to the intrigue, the US macro data paints a portrait of an exceptionally resilient economy, lending strength to the Federal Reserve's hawkish stance. This fortifies the US Dollar (USD), holding it near its peak for over two months, thus constraining Gold's ascent.
Beyond these nuances, traders exhibit a certain caution, likely opting to wait on the sidelines as the momentous Jackson Hole Symposium looms on the horizon next week. Brace yourselves for market volatility as central bankers' comments wield their influence. As the anticipation builds, US bond yields emerge as the juggernauts shaping USD dynamics in the absence of significant domestic economic data.
The broader risk sentiment becomes a compass that will be guiding our trading decision toward short-term opportunities.
Stay tuned as we navigate through the intricate tapestry of Gold's journey, dissecting trends, patterns, and possibilities.
XAUUSD Technical Analysis:
In this video, we delve into XAUUSD's price action, decoding accumulation, and distribution patterns. By analyzing historical price moves, market behaviors, and buyer-seller dynamics, we extract insightful cues. The strategic approach? Waiting for compelling follow-through buying signals to confirm a potential near-term bottom for the USD-linked Gold before diving into bullish ventures.
The $1,895 and $1,885 zones take center stage. Its historical significance makes it a crucial point. If the reversal set-up sustains and the price breaks out both the descending trendline and the $1,895 level, a bullish week could unfold. However, the breakdown of the $1,895 level can trigger a USD-favored sell-off.
Stay tuned for more thrilling updates on the Gold market! Remember, trading involves risks, and I always recommend exercising caution and seeking advice from financial professionals. Hit the like button if you found this analysis helpful, and don't forget to subscribe for more insightful content! 📺🔔💼
Disclaimer Notice:
Please be aware that margin trading in the foreign exchange market, including commodity trading, CFDs, stocks, and other instruments, carries a high level of risk and may not be suitable for all investors. The content of this speculative material, including all data, is provided by me for educational purposes only and to assist in making independent investment decisions. All information presented here is for reference purposes only, and I do not assume any responsibility for its accuracy.
It is important that you carefully evaluate your investment experience, financial situation, investment objectives, and risk tolerance level. Before making any investment, it is advisable to consult with your independent financial advisor to assess the suitability of your circumstances.
Please note that I cannot guarantee the accuracy of the information provided, and I am not liable for any loss or damage that may directly or indirectly result from the content or the receipt of any instructions or notifications associated with it.
Remember that past performance is not necessarily indicative of future results. Keep this in mind while considering any investment opportunities.

XAUUSD BullishOn Thursday, DXY was become stronger and put GOLD down, but If you look on the chart, we can see huge Bearish candle which is abnormal as compared to another candle. I believe GOLD may rise more. Every support is an opportunity to buy.

Bullish Outlook on XAUUSD - 21 JulyCurrently, there is bullish order flow, with higher lows and higher highs created. A throwback to support zone at 1955.00, which is in line with the 78.6% Fibonacci retracement level, could provide bullish acceleration towards the resistance zone at 1985.00, which coincides with the 141.4% Fibonacci extension level. Price is currently hovering above ichimoku cloud, supporting our bullish bias.

XAUUSD BuyLast week USD was weak but on Friday it showed strength but its not enough to make fall XAUUSD. It will be better to look buying setup on it.

XAUUSD BullishThe market of XAUUSD (GOLD) first will move down and then it will rise, keep an eye on DXY to cathc the GOLD.

XAUUSD H1: Bullish outlook seen, further upside above 1985Price is currently range-bound and hovering above a key support zone at 1955 on the H1 timeframe. A throwback to this support zone, coupled with a break above upside confirmation at 1963.5 could provide the bullish acceleration to the resistance zone at 1985. Prices are showing bullish divergence, with RSI forming higher lows while prices continue trending lower, which could signal a potential reversal, supporting the bullish bias

XAUUSD!! BULLISH OR BEARISHI'm going for bullish. watch these support and resistance line, open lower time frame if u want to enter, watch if there is divergence on lower timeframe, then u can enter. Don't forget your SL 30-50-pips!! GOODLUCK GUYS!!!

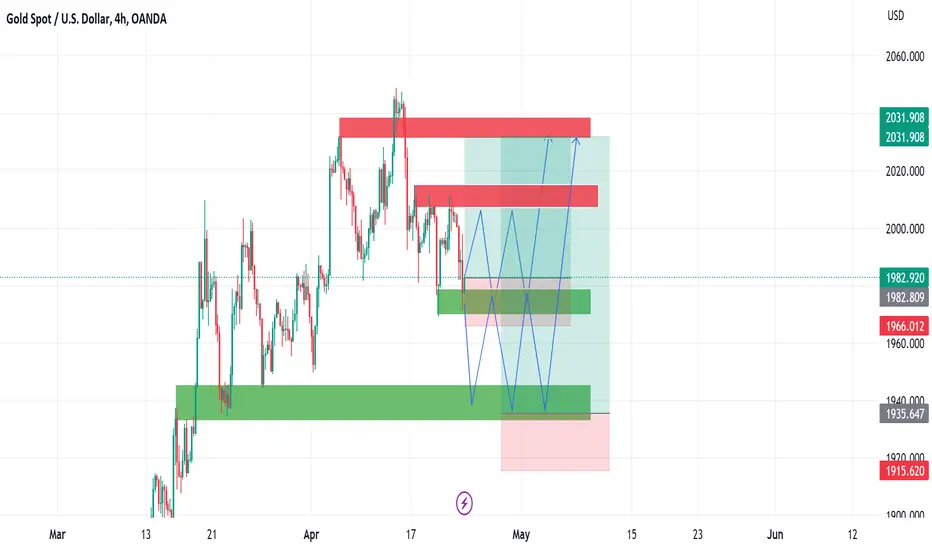
XAUUSD BullishToday early morning XAUUSD has breakout its sideway box on 15 minutes time frame. I am much sure that from 2020 it will rise to hit its defined take profit zones.

XAUUSD BuyLast week XAUUSD moved according to our analysis. I am much sure that in coming week XAUUSD (GOLD) will move again according to our analysis.
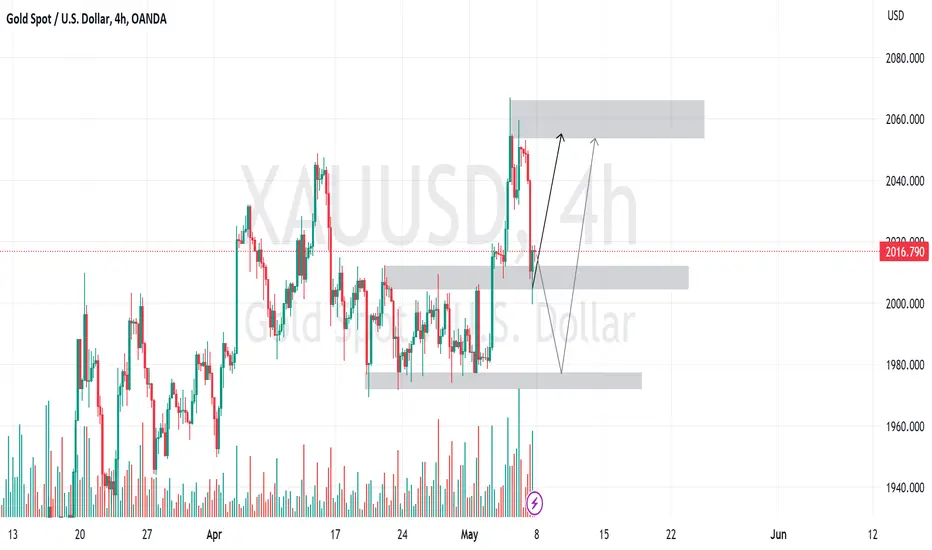
XAUUSD BuyGOLD (XAUUSD) took support on its previous level. I think first GOLD will move in zig zag and then it will take off to 2030.
XAUUSD BULLISH GARTLEY HarmonicsXAUUSD BULLISH GARTLEY Harmonics - BUY ORDER after New HH HL are Printed. SL below 1980
GARTLEY Harmonic Reversal Confirmed by Bullish Divergence

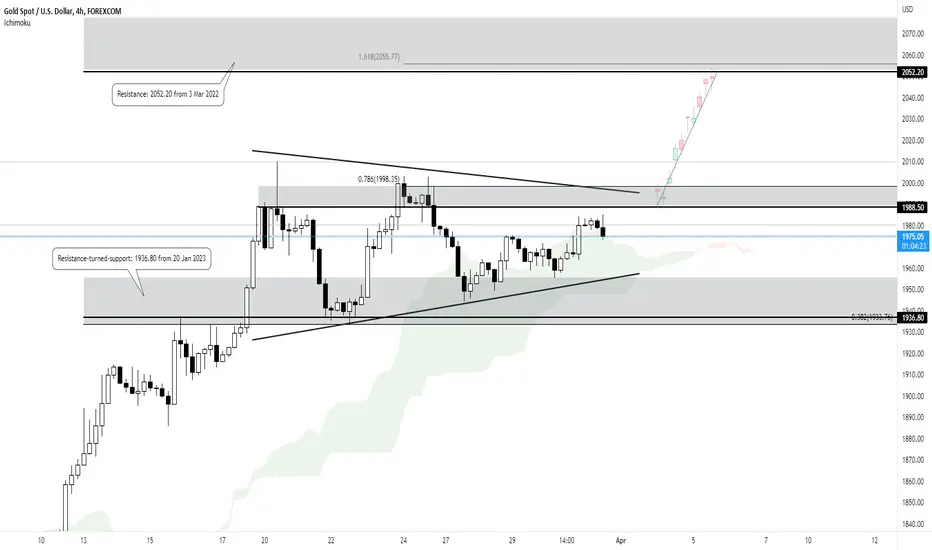
Bullish outlook on XAUUSD - 31 March 2023Price is consolidating between a key resistance zone at 1988.50 and a key support zone at 1936.80, forming a bullish pennant on the H4 timeframe. A break above the resistance zone at 1988.50, in line with the 78.6% Fibonacci extension level and graphical high, could provide the bullish acceleration to the next resistance zone at 2052.20, in line with the 161.8% Fibonacci extension. Price is holding above the Ichimoku cloud as well, supporting our bullish bias.
XAUUSD M30: Bullish outlook seen, further upside above 1968.50Prices are hovering above a key support zone at 1968.50 on the M30 timeframe, which coincides with the 38.2% Fibonacci retracement. A throwback could provide the bullish acceleration to the resistance zone at 2006.20, in line with the 38.2% Fibonacci extension. Price is holding above the 20 EMA, supporting our bullish bias.

Bullish outlook on XAUUSD - 10 March 2023Prices have broken above a key resistance zone at 1831.20 on the H1 timeframe, which is in line with the 23.6% Fibonacci extension. A throwback to this zone could present an opportunity to ride the bounce to the resistance zone at 1842.50, which coincides with the 78.6% Fibonacci retracement and extension levels. Prices are holding above the Ichimoku cloud and 20 EMA, supporting our bullish bias.
