Will gold continue its uptrend from the 3,300 USD level?Hello dear traders!
Gold prices continued to decline against the US Dollar (USD) on Friday, falling below the previous psychological support level, which is now resistance, at 3,350 USD. The main reason was that the US Dollar gained some positive momentum as the market leaned toward the Fed maintaining its current policy in July following the May report, causing XAUUSD to move lower into the weekend.
From a technical perspective, as previously analyzed, gold broke below the psychological support level of 3,350 USD on Friday, with prices approaching the 3,300 USD support level at the time of writing. However, the RSI has dropped to the 30 level, indicating that selling pressure may be losing momentum, and global economic stress could potentially limit further losses.
Xauusdbuy
Analysis of Today's Gold Market Trend and Trading IdeasYesterday, gold prices rose to $3,338 before pulling back, closing the daily chart with a doji star. Weekly and monthly charts suggest an adjustment is needed, but short-term momentum is lacking, keeping the market in consolidation. During today's Asian session, gold prices fell to $3,302 under pressure and stabilized.
In the 4-hour timeframe, the rebound to $3,338 confirmed the previous support-turned-resistance level, which also coincides with the resistance of the broken low and the middle band of the Bollinger Bands. The current range-bound pattern remains unchanged. Today's strategy is to stay bearish but avoid chasing short positions—enter short trades when the price rebounds and meets resistance. Focus on the $3,340 resistance level, with support at the $3,300-$3,290 range.
XAUUSD
sell@3335-3340
tp:3310-3290
Investment itself is not the source of risk; it is only when investment behavior escapes rational control that risks lie in wait. In the trading process, always bear in mind that restraining impulsiveness is the primary criterion for success. I share trading signals daily, and all signals have been accurate without error for a full month. Regardless of your past profits or losses, with my assistance, you have the hope to achieve a breakthrough in your investment.

Gold rebounds and repairs, is it a shock or a bull market?📰 Impact of news:
1. Geopolitical situation
2. Impact of the US dollar trend on gold
📈 Market analysis:
At the gold hourly level, after the pressure in the Asian session in the morning, it directly fell to the vicinity of 3302. The big Yin effectively lost the lower track of the descending flag consolidation channel. The original 3318 line was the confirmation of the channel counter-pressure point, which happened to be the 61.8% split resistance level at that time. At the same time, it lost the middle track. Therefore, we gave a trading idea of looking at the rebound under pressure and continuing to decline in the European session. As a result, the market directly took a V-shaped wash-up and once pulled up to the vicinity of 3342.
The European session fluctuated strongly and rose. Before and after the US session, it took advantage of the retracement to lure the short position, and there is still the possibility of a second pull-up space. Therefore, in the subsequent retracement support level, pay attention to two positions, one is 3322-3324, and the other is the 61.8% division support level of 3318. If it stabilizes, there is a high probability that there will be a second upward space, pointing to 3348. If the pressure here cannot be overcome, the bottom will continue to oscillate back and forth. At that time, it will fall back to see if a secondary low point can be formed to further stabilize the support. If it goes straight through and stands on it, 3293 may already be the short-term low.
On the whole, I still hold short orders before the effective breakthrough of 3345, but at the same time, as the gold price rebounds and moves upward, the short-term support level is temporarily expected to be 3325-3320.
🏅 Trading strategies:
SELL 3335-3345
TP 3325-3315
BUY 3325-3330
TP 3350-3360
If you agree with this view, or have a better idea, please leave a message in the comment area. I look forward to hearing different voices.
TVC:GOLD FXOPEN:XAUUSD FOREXCOM:XAUUSD FX:XAUUSD OANDA:XAUUSD

6/10 Gold Analysis and Trading SignalsGood afternoon, traders!
Gold continues to move within the predefined trading range from yesterday. Both the short from 3338 and the long from 3306 turned out profitable. Currently, price action is developing into a potential double bottom, with price once again testing key resistance around 3338.
🔍 Key Technical Outlook:
If gold breaks above 3338 decisively, and can hold above 3317 on any pullback, the next bullish target area lies between 3345 / 3352–3368.
However, if price fails to break out, then focus shifts back to the 3303–3286 support zone, which may serve as a potential buy region again.
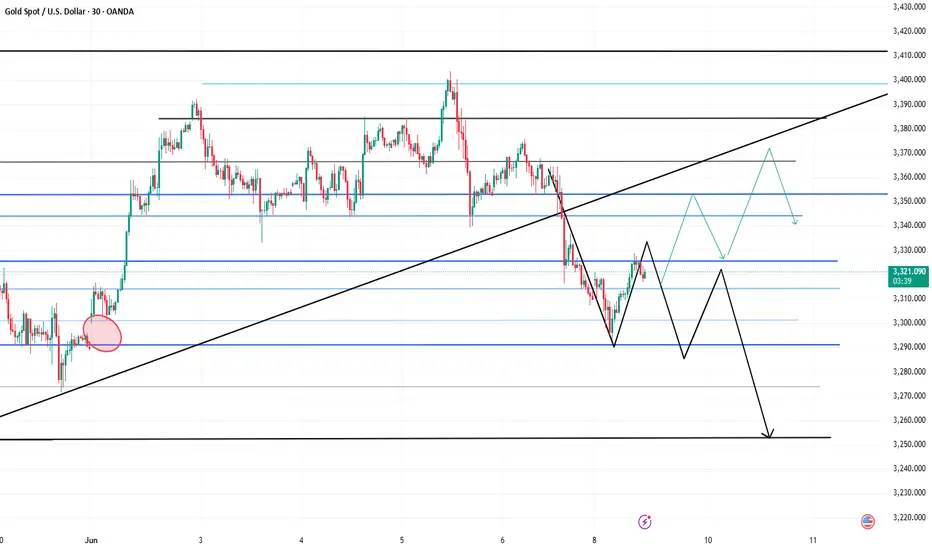
📉 4H Trend Structure:
On the 4-hour chart, price has already broken below the previous uptrend line.
For the bulls to reclaim control, gold must re-establish above 3350 and sustain momentum. Failure to do so confirms bearish dominance, with the next major support near 3257.
Any weak rebound below key resistance can be treated as a short-selling opportunity.
📊 Macro Focus:
No major economic releases today, but traders should prepare for tomorrow's CPI data, which could be a key driver for gold volatility and inflation sentiment.
📌 Today’s Trading Plan:
✅ Buy zone: 3296–3286
✅ Sell zone: 3348–3358
🔄 Pivot levels for flexible intraday trades:
3343 / 3334 / 3326 / 3318 / 3309 / 3300
Stay cautious, manage position sizes wisely, and be alert for momentum shifts as CPI draws closer.

Gold Hits Target Zone — Uptrend May Continue if Support HoldsGold broke below the 3326–3316 support zone earlier today,
but found strong buying interest near 3300, rebounding into the 3340–3350 target range.
Despite facing resistance here, the 2-hour chart still shows an incomplete bullish formation,
suggesting potential for further upside.
—
📌 Key Technical Zones to Watch:
🔸 If price pulls back from the 3340–3350 resistance, monitor 3326 as the key support
🔸 If 3326 holds, bulls may regain control and push the price swiftly toward
→ 3358–3368 resistance zone
🔸 3352 is a critical bull/bear pivot point — a breakout above it could signal a renewed bullish breakout
—
🎯 Trade Strategy:
✅ Long positions may consider partial profit-taking near resistance
✅ If price pulls back and holds above support, re-entry opportunities may arise
⚠️ Watch volume closely and avoid chasing high if momentum stalls

gold on bullish#XAUUSD Price still at same movement, expecting bullish to break 3345.
Await 2 times breakout at 3326 for buy, target 3345,SL 3315.
Below the 3313 have a strong bearish continuation, target 3280
Continue buying on multiple breakout above 3342

XAUUSD:Wait for a short near 3330
Last week's data was negative for gold and silver. However, it should be noted that the actual announced value is lower than the previous value, in essence, the economic end did not release good, but the contraction speed is lower than the market expectation.
In terms of the large cycle, June is the continuation of May's wide shock, long rest storage stage, but also up and down back and forth pull, the main trend is still more, pay attention to seize the next wave of unilateral rise opportunities.
Now the fluctuation is still large, need to be patient and wait for the right position, short-term attention to 3330 resistance near to short, back to step near 3300 and then consider more.
Trading Strategy:
SELL@3330
TP:3310
↓↓↓ More detailed strategies and trading will be notified here ↗↗↗
↓↓↓ Keep updated, come to "get" ↗↗↗

Sell@3335Technically, the first key support range is at 3,240-3,260. If this area holds as effective support, it may trigger a short-term rebound. Close attention should be paid to updates on U.S. tariff policies and the evolution of the situation in war-torn countries, as geopolitical risks may exacerbate market volatility ⚠️
⚡️⚡️⚡️ XAUUSD ⚡️⚡️⚡️
🚀 Sell@ 3360 - 3240
🚀 TP 3310 - 3290
🚀 Buy@ 3250 - 3260
🚀 TP 3290 - 3310
Accurate signals are updated every day 📈 If you encounter any problems during trading, these signals can serve as your reliable guide 🧭 Feel free to refer to them! I sincerely hope they'll be of great help to you 🌟 👇

Gold rebound fails to change the trend and is still bearish?📰 Impact of news:
1. The streets of Los Angeles are full of "gunpowder smell"! Immigration protests escalate, and Trump sends troops to suppress them
2. Geopolitical situation
3. Federal Reserve political expectations
📈 Market analysis:
At the hourly level: the Bollinger Band opening is narrowing, the MACD technical indicator is running in a golden cross, and the RSI fluctuates frequently in the short term. There is a certain potential for short-term promotion. If the gold price stabilizes above 3315, it may trigger a rebound and touch 3330-3340 again. If the gold price continues to be below 3300 and the short position is strengthened, it may fall to a new low. Therefore, if it rebounds again to the 3330-3340 resistance line, short positions can still be considered.
🏅 Trading strategies:
BUY 3315-3318
TP 3330-3335
SELL 3330-3340
TP 3300-3290-3280
If you agree with this view, or have a better idea, please leave a message in the comment area. I look forward to hearing different voices.
OANDA:XAUUSD FX:XAUUSD FOREXCOM:XAUUSD FXOPEN:XAUUSD TVC:GOLD

Evening gold trend analysis and operation layout📰 Impact of news:
1. The streets of Los Angeles are full of "gunpowder smell"! Immigration protests escalate, and Trump sends troops to suppress them
2. Geopolitical situation
3. Federal Reserve political expectations
📈 Market analysis:
Gold rebounded as expected and touched the 3330 line. In the short term we need to pay attention to the 3335 line. On the one hand, it is the top and bottom, and on the other hand, the annual average line is also the pressure point of the upper track of the downward channel. Once it is suppressed below 3335, it will continue to fluctuate downward. If it unexpectedly breaks through 3335 or even 3340, then 3293 is likely to become the short-term bottom.
At present, the rise has slowed down after rising to 3330, and the technical side shows a top divergence signal, so in the short term, we still maintain the idea of shorting at a high level of fluctuation.
🏅 Trading strategies:
SELL 3335-3345-3355
TP 3310-3300
If you agree with this view, or have a better idea, please leave a message in the comment area. I look forward to hearing different voices.
TVC:GOLD FXOPEN:XAUUSD FOREXCOM:XAUUSD FX:XAUUSD OANDA:XAUUSD

Gold: Market Analysis and Trading StrategiesSo far, although the price has risen, it has not yet broken through the upper resistance, and the lower support remains intact. Overall, the market is still in a narrow range of consolidation. From a technical perspective, the 2-hour chart shows a bullish bias, indicating a potential for continued upward movement in the short term.
However, if during this consolidation phase the price breaks below the key support at 3309, it is likely to further test the support zone around 3296–3288.
At this stage, traders can consider entering light long positions and gradually add to them on dips to reduce the average entry price. For more conservative traders, it's advisable to wait until a clear breakout occurs before taking action.
Watch the 3338–3352 area for potential short opportunities as it's a key resistance zone, and the 3303–3288 range for long entries as it offers strong support. Trading near these levels generally carries lower risk and a higher probability of profit.


gold on short bullish till 3340#XAUUSD price aiming 3340 for reverse, possible 3340 price close on D1 or middle close to continue bearish.
#Gold buy at 3326 breakout, target 3340, SL 3317.
We aim at H4 price close in next 2 hours, if possible it closes below bearish 3313 then bearish is possible to continue but buy at 3323-26 will take above 3340.

Gold May Rebound After Monday Dip; Watch Tariffs & GeopoliticsGold may continue to decline before rebounding on Monday📉. The first support level is currently near 3,240-3,260. When approaching this support area, considering going long is advisable👍. It is still crucial to closely monitor the latest developments regarding U.S. tariffs and the situation in war-torn countries, as significant volatility may occur at any time⚠️. If a rebound reaches 3,350-3,360, considering going short is an option📉
⚡️⚡️⚡️ XAUUSD ⚡️⚡️⚡️
🚀 Buy@ 3250 - 3260
🚀 TP 3290 - 3310
🚀 Sell@ 3360 - 3240
🚀 TP 3310 - 3290
Accurate signals are updated every day 📈 If you encounter any problems during trading, these signals can serve as your reliable guide 🧭 Feel free to refer to them! I sincerely hope they'll be of great help to you 🌟 👇

GOLD: Bullish Bias Holds, But Mind the Unfilled GapGold dipped below 3300 today and bounced back, though the gap near 3289 remains unfilled.
This shows buying interest is active, but also reveals that some sideline capital is still waiting for a full retest.
Combined with selling pressure on the rebound, it’s clear that bullish strength is currently limited.
—
🔍 Two Possible Scenarios from Here:
1️⃣ If support proves firm during consolidation, bulls may regain momentum and push higher
2️⃣ If support fails, price is likely to fill the 3289 gap before launching the next leg up
📌 Current Trade Outlook:
✅ Bullish trend remains intact
✅ Regardless of the short-term path, the direction is upward
✅ Watch resistance at 3331, with a key zone near 3348
—
⚠️ Note: The daily chart structure still needs further correction.
If volume remains weak after a second dip and a failed bounce follows, bears may take over again — in that case, the next downside target would be around 3258–3228
📩 Conclusion: Stay long-biased, but react flexibly to support strength and volume shifts.
6/9 Gold Analysis and Trading SignalsLast Friday, gold experienced a sharp drop, briefly testing the 3300 level. From a technical standpoint, the market has started to show early signs of bottom formation, which could materialize either as a double bottom / multiple bottom pattern, or through a direct upside breakout.
If the former unfolds, we expect a stronger and more sustainable rebound.
If it turns into a straight bullish leg, traders should be cautious of potential exhaustion in the rally, which may invite a renewed bearish attack.
📊 Key Macro Focus This Week:
Markets will be primarily influenced by data releases on Wednesday through Friday, including:
Monthly CPI
Initial Jobless Claims
Inflation Expectations
As a result, Monday's trading will be dominated by technical patterns, with a bias toward a corrective rebound. The strategic focus should be on buying near support, with short-term opportunities to sell near key resistance.
📌 Monday Trading Plan:
✅ Buy in the 3303–3286 zone (early base-building area)
✅ Sell in the 3343–3353 zone (overhead resistance)
🔄 Intraday pivot levels for tactical entries:
3338 / 3326 / 3317 / 3309

GOLD (XAU/USD) Imminent long opportunitiesThis week, my focus for GOLD is on potential long opportunities around the current price level. Price is sitting within a strong area of demand, so my plan is to wait for signs of accumulation and a clear slowdown in bearish momentum before considering any entries.
Ideally, I’d like to see the Asia low swept, which currently lies in the middle of the zone — that would offer even stronger confirmation for a buy setup.
If this current zone doesn’t hold, I have a well-defined 9H demand zone around the 3,220 level, which sits in a more discounted area and aligns well with the overall bullish trend on the higher timeframes.
Confluences for GOLD Buys:
- Clean major daily demand that caused a change of character to the upside
- Plenty of liquidity above and an unmitigated supply higher up
- This is a pro-trend trade, aligning with overall higher timeframe bullishness
- DXY has been bearish over the past few weeks, supporting gold upside
P.S. If price respects this current demand and moves higher, we may see a short-term reaction from the 3H supply zones above — but we’ll monitor price action and adjust accordingly.
Have a great trading week

XAUUSD: $3100 is the next target, Get Ready For the Big Move!Gold is currently making a small correction and looking at how the price is behaved. We are expecting how the price is likely to develop next. Use accurate risk management.

Gold Drop Fully Expected — Now It's Bulls?This recent decline in gold was well within our expectations. Since Monday, I’ve been highlighting the following:
The 3400 zone is a strong historical resistance, with heavy supply pressure;
A gap remains open at 3289, creating downside risk.
Today's drop is a deep flush of selling pressure near the 3400 zone.
Although the 3289 gap is still unfilled, this move may trigger dip-buying activity, giving bulls some room to work with.
📌 The first rebound resistance is likely near 3343, but because the gap is still a threat, most funds remain cautious. This could result in:
Weaker-than-expected rebounds;
Even possible bull traps followed by renewed downside.
✅ Long strategy reminders:
Keep position size moderate;
Set realistic targets;
Adjust your approach in line with market development.
Stay sharp, stay flexible — profits favor the prepared.

Gold opportunity in pullbackGold is showing a nice 3-wave pullback, and showing a higher high sequence, as per Elliott wave also an incomplete sequence, also the dollar is showing a bearish sequence. so it can be a good opportunity.
selling Gold/silver is BIG NOOOOO
Entry 3311
SL: 3245
Target T1:3490 T2: 3540
Plz Follow me on X for more updates

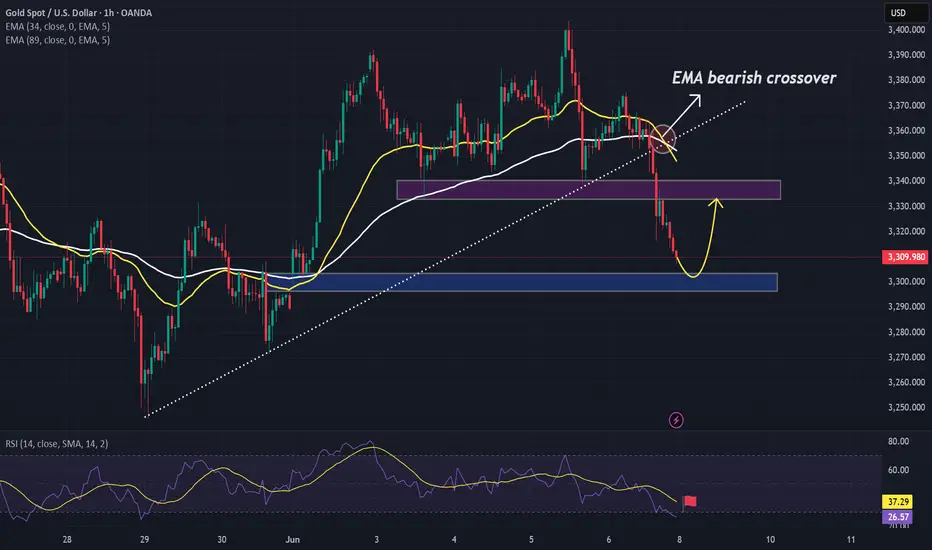
Analysis and layout of the latest gold trend in the evening📰 Impact of news:
1. The United States issues new sanctions on Iran
2. Trump continues to criticize the Federal Reserve
📈 Market analysis:
The 1H moving average of gold has shown signs of turning downward. If a death cross structure is formed subsequently, it will open up further downward space. From the market point of view, the price of gold rebounded to around 3364 after the release of non-agricultural data. This position constitutes a short-term key resistance level. If the rebound is under pressure here during the US trading session, short selling on rallies can still be considered. Although the price of gold has started to decline, it has not been able to fall below the important support of 3,300, so the long-term direction remains unchanged. At the same time, we need to pay attention to the effectiveness of the 3310 support line in the short term, and consider long trading only after the bottom is confirmed. For short-term trading, consider shorting at 3340-3350, and look to 3320-3310
🏅 Trading strategies:
SELL 3340-3350
TP 3320-3310
If you agree with this view, or have a better idea, please leave a message in the comment area. I look forward to hearing different voices.
TVC:GOLD FXOPEN:XAUUSD FOREXCOM:XAUUSD FX:XAUUSD OANDA:XAUUSD

Gold Is Likely to Break Below 3300 SoonYesterday, gold rallied up to near 3400 before pulling back, just as we had anticipated. We've repeatedly emphasized that 3400 is a strong resistance level, and those who followed through with short positions likely saw impressive profits.
Today, after a sharp drop, gold has rebounded again and is fluctuating near resistance. Support lies at 3352, and if that breaks, the next downside target is around 3333, followed by a possible move to fill the gap between 3300–3289.
🔍 Trading Logic:
There's still significant selling pressure above 3300, with the gap remaining unfilled.
Once the gap is filled, bulls may regain confidence to push higher — though they still face dense resistance above.
📌 Clear Profit Opportunities:
✅ Short toward the 3289 gap fill
✅ After the gap is filled, consider buying into the bullish rebound
The setup is clear — the key now is timing your entries and managing your positions wisely.

Long positions have made profits, focus on support📰 Impact of news:
1. The United States issues new sanctions on Iran
2. Trump continues to criticize the Federal Reserve
📈 Market analysis:
At present, the gold price has touched 3340. If it stabilizes here, we can arrange to go long. However, the gold price is constantly testing downwards, which is why I did not arrange to go long immediately. At the same time, we need to be vigilant about whether the gold price will fall below the important support of 3330. If it really falls below 3330, the gold price may test the support of the integer mark of 3300, which will also determine the future market trend.
🏅 Trading strategies:
SELL 3400-3370
TP 3340-3330-3300
BUY 3335-3330
TP 3350-3370
SELL 3325-3320
TP 3310-3300
If you agree with this view, or have a better idea, please leave a message in the comment area. I look forward to hearing different voices.
OANDA:XAUUSD FX:XAUUSD FOREXCOM:XAUUSD FXOPEN:XAUUSD TVC:GOLD
