Gold price recovers with PCE news?⭐️GOLDEN INFORMATION:
Gold prices rebounded from weekly lows near $3,245 and surged past the $3,300 mark on Thursday, buoyed by a weaker-than-expected U.S. jobs report and optimism following a U.S. court ruling that halted President Donald Trump’s proposed tariffs. At the time of writing, XAU/USD is trading at $3,318, up 0.94% on the day.
The rally was fueled by data from the U.S. Department of Labor showing that jobless claims rose more than forecast, surpassing both market expectations and the previous week’s figures—an indication of potential softening in the labor market that weighed on the U.S. Dollar and boosted demand for safe-haven assets like gold.
⭐️Personal comments NOVA:
Price zone 3300, gold price accumulated in the past 2 weeks. waiting for fluctuations from tariffs
⭐️SET UP GOLD PRICE:
🔥SELL GOLD zone : 3363- 3365 SL 3370
TP1: $3352
TP2: $3340
TP3: $3328
🔥BUY GOLD zone: $3280- $3282 SL $3275
TP1: $3290
TP2: $3300
TP3: $3310
⭐️Technical analysis:
Based on technical indicators EMA 34, EMA89 and support resistance areas to set up a reasonable BUY order.
⭐️NOTE:
Note: Nova wishes traders to manage their capital well
- take the number of lots that match your capital
- Takeprofit equal to 4-6% of capital account
- Stoplose equal to 2-3% of capital account
Xauusdbuy

Gold Poised for a Breakout After Sideways ConsolidationGold has retraced to the 3300 level and remained range-bound for an extended period. This prolonged consolidation suggests that a sharp breakout may be imminent, with the next move — whether up or down — likely to be swift and volatile.
Looking at the 2-hour chart, the current price structure is complex. It could be interpreted as a potential double top, but it also resembles the early formation of an inverse head and shoulders, which makes trading decisions more challenging.
From a technical standpoint:
Moving averages are aligned in a bearish setup, and the area above remains densely packed with resistance.
MACD on the 2H chart shows a bearish crossover, signaling a potential continuation of the downtrend.
However, on the 30-minute chart, MACD shows some short-term bullish momentum, with the next resistance near 3306.
For bulls, if the price attempts to rise toward the 3306–3312 zone but then quickly pulls back, this would indicate weak buying pressure, and caution is advised.
In summary, short-term signals are bullish, but the medium-term trend remains bearish. With the market in a sideways range, it's best to remain patient and watch for breakout signals. The two trading opportunities shared yesterday remain valid and worth monitoring closely.

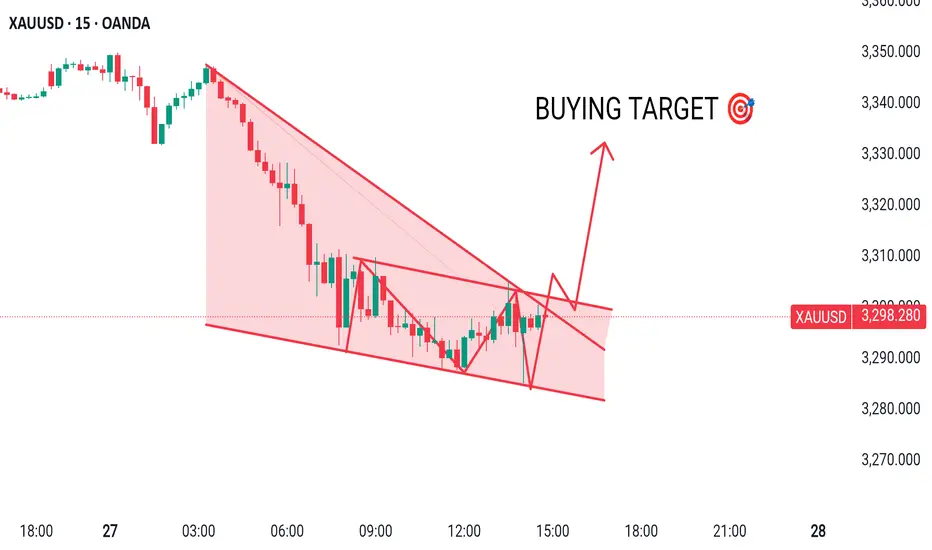
XAUUSD MADE FALLING WEDGE & DESCENDING PATTERNHere I Created This XAUUSD Chart Analysis
Pair : XAUUSD (Gold)
Timeframe: 15 - Minutes
Pattern: FALLING WEDGE
Momentum: BULLISH/ BUY
Entry Level : BUY 3297
SUPPORT zone : 3285
Target Will Be : 3330
Disclaimer : This signal is based on personal analysis for learning purposes. Trade at your own risk and always use proper risk management.
Gold Price Action Update – Smart Dip Buy Pays Off!Yesterday, gold dipped to around 3290, followed by a minor rebound.
Today, as expected, it broke down through the 3280 level decisively—just as we discussed:
🔻 A break below 3280 likely means a gap fill toward 3259.
✅ For those who followed the plan and went long below 3266, the trade worked beautifully—
Gold dropped to a low of 3245, effectively filling the gap, and has since rebounded back to the 3280 area.
📈 What’s next?
Now that the gap is filled, gold is likely to retest the $3300 zone in the short term.
With price currently around 3280, there is still room to the upside.
➡️ If you're holding long positions, you can consider holding a bit longer for potential further gains.
🚨 BUT—this was only a single bottom test.
That means there's still a chance of a second dip before the trend fully reverses. So:
🛡 Risk management remains crucial.
If you're okay with some profit pullback, it's fine to stay in.
If not, consider securing partial profits and setting trailing stops.
🎯 Key levels to watch:
🔼 3300 – Main resistance zone; focus on whether it breaks or rejects;
🔽 3276–3263 – Support range on any pullback; good zones to watch for fresh entries if support holds.
📌 Trading Strategy Outlook:
For now, continue to buy on dips as long as support holds, and monitor 3300 resistance closely.
If price fails to break above, we may see a pullback—but as always, with proper planning, we stay profitable.

Gold drops to support then rebounds; 3325-3330 key bull-bear levAnalysis of Today's Gold Volatility 🔥
The ruling on Trump's tariff overreach and the Fed's cautious stance on rate cuts have delivered a double blow 💥, instantly "freezing" market risk aversion 🧊! Gold prices plunged to a low of 3245 intraday, with the 3245-3250 zone acting as a "safety air cushion" 🛡️ that firmly halted the decline. The price is now rebounding to test resistance near yesterday's high, where the 3325-3330 level has become a "life-or-death line" ⚔️ for bulls and bears, with a showdown imminent!
Trading Strategies (Emoji Signal Guide 📌)
1. Short on Rebound 🚀➡️📉
Entry: Lightly short in the 3325-3330 range (Bearish "sniper zone" 🎯)
Stop Loss: 3335 (Break above resistance? Run 🏃♂️!)
Targets:
First target: 3280 (Bearish "first charging station" 🔋)
Second target: 3250 (Test support validity 🔍)
2. Long at Support 📉➡️📈
Entry: Lightly long after stabilizing above 3250 (Bullish "rally call" 📢)
Stop Loss: 3240 (Break below support? Retreat fast 🚑!)
Targets:
First target: 3280 (Rebound "mini-peak" ⛰️)
Second target: 3300 (Challenge "mid-fortress" 🏰)
Risk Warning ⚠️: Beware of volatile swings from Fed speeches! Exit immediately if prices break above 3330 or below 3240. Control positions and avoid emotional trading 🚗💨!
Professional trading strategies are pushed daily 📊
Lock in precise signals amid market fluctuations 🚀
Confused about market trends? Stuck in strategy bottlenecks?
Real-time strategies serve as your "trading compass" 🌐
From trend analysis to entry/exit points, dissect market logic comprehensively
Refer now 📲
Help you move steadily forward in investments ✨
👇👇👇

XAUUSD trading plan for the London market.After buying at a low level yesterday, the market rebounded and continued to fall. Today, the Asian market hit a low of 3208.
At present, geopolitical uncertainties are increasing. I think buying is still a reasonable choice. Buy near 3210-3200. The target is 3235-3248. It is necessary to observe whether the target is stabilized.
Remember to control trading risks when trading independently.

XAUUSD buying opportunitiesToday, I am adapting to low buy operation again. Yesterday, the lowest price in New York market reached 3278, and today the lowest price in Asian market hit the low near 3245. But with the addition of buy orders, the profit has expanded a lot again.
XAUUSD market quotation is 3298. This position can still be arranged for buying. Do not trade independently. Remember to leave me a message. Pay attention to the subsequent precise trading opportunities.

Gold Strategy Update — Professional Trading InsightGold dipped to around 3290, then rebounded to 3310, followed by another pullback toward the 3290–3280 region and bounced again. This price action perfectly aligned with our forecast and trading plan.
👉 If you followed today's strategy, you should be in solid profit once again!
📍 Current Market Structure Analysis:
🔹 Gold is now hovering near 3300, which is a key resistance zone.
Our previously identified support area at 3306–3318–3324 has been broken and is now acting as resistance.
🔹 Among these levels:
3306 is a weaker resistance,
While the 3316–3323 zone is the main barrier to watch.
📊 Based on the 30-minute chart, bullish momentum appears limited:
If the price rebounds in a single leg, it is likely capped around 3318–3324,
→ With an 80%+ probability of a pullback from that zone. A reasonable short-term target would be 3312;
However, if gold builds a double bottom or multiple bottom structure, it may gather more strength,
→ And a broader rebound could reach 3332–3338.
📉 Bearish Structure Repair (2H Chart):
On the 2-hour chart, the previous bearish structure has been mostly corrected by the recent drop;
The next key factor is whether bulls can break above 3320 to confirm a reversal.
🟥 If bulls fail to break 3320 and price drops below 3280, it may open the door for bears to close the gap around 3259.
→ In that case, levels below 3266 will present excellent buy opportunities.
📊 Trading Summary:
Although market volatility has slightly decreased in recent days, there are still plenty of solid trading opportunities, and we continue to profit steadily.
✅ As long as you stick to a proven strategy, strong discipline, and flexible execution, you’ll find that no matter how the market moves, our profit curve will keep climbing.

5/29 Gold Analysis and Trading SignalsGood morning everyone!
Yesterday, gold rose first and then declined. Our long positions targeting 3318–3326 were completed successfully, and we timely shifted to short positions, resulting in another round of solid profits.
📉 Technical Outlook:
Gold remains in a bearish trend, and is now very close to the 3275 support level. Based on the current price structure, a break below this level is highly probable.
If $3275 is breached, focus on key support at 3258–3238
Resistance levels to watch: 3298–3318
The daily (1D) chart is currently in an indicator correction phase, so today's trading bias is selling from higher levels
🗞 News Focus:
Watch for U.S. initial jobless claims data today. It may offer short-term support for gold, but is unlikely to reverse the broader bearish trend.
📈 Today’s Trade Plan:
📉 Sell in the 3316–3328 zone (resistance zone)
📈 Buy in the 3245–3232 zone (key support area)
🔁 Scalp/flexible trading levels:
3303 / 3288 / 3276 / 3258 / 3247
Stay adaptive and combine news with price action at key levels for best results.
Wishing everyone a successful and profitable trading day!

Gold shocks extreme pull, US market layout🗞News side:
1. Musk issued the "strongest" condemnation of Trump
2. Trump and Netanyahu failed to reach an agreement, and the US-Iran negotiations may be "disrupted" by Israel
📈Technical aspects:
The trading strategy we have given is still valid. The current gold price trend on the hourly chart shows a standard descending flag pattern. If this pattern continues to be effective, there is a high possibility that the gold price will fall below 3285-3280. Once it falls below this range, as we gave in the strategy this morning, it may fall to the 3260-3250 line. However, the premise for this expectation to be established is that the gold price cannot break through and stabilize on the upper track of the consolidation channel, otherwise the descending flag pattern will be invalid. Therefore, for US market operations, short positions can be arranged around the upper rail of 3325, paying attention to the suppression effect; for the lower rail, first pay attention to the support effect of 3300.
sell 3325-3330
TP 3310-3300
buy 3290-3280
TP 3310-3320
If you agree with this view, or have a better idea, please leave a message in the comment area. I look forward to hearing different voices.
FOREXCOM:XAUUSD FXOPEN:XAUUSD TVC:GOLD FX:XAUUSD OANDA:XAUUSD

Gold 100% Trading SignalsFrom the 4-hour analysis, today's upper resistance is around 3288-95, the short-term short-term weak dividing line is 3300-10, and the short-term support below is 3240-45, maintaining the main tone of participating in the trend unchanged.
Gold falls back to 3258-3264, buy more when it falls back to 3240-45, stop loss at 3233, target at 3280-3285, break to 3300-05

Gold bears will dominate the marketFrom the market point of view, the delay of the Fed's policy shift and the mitigation of geopolitical risks have a double-kill effect: on the one hand, high interest rates limit the attractiveness of gold; on the other hand, the retreat of safe-haven buying has intensified selling pressure. In the short term, pay attention to the support of the 3240-3250 range. If it fails, it may drop to the psychological level of 3200; but after oversold, be wary of technical rebounds. The 3280-3300 line above will become a key resistance. Be cautious in chasing orders, and the trend is mainly rebound shorting.
Gold recommendation: short near the rebound of 3282-3287, stop loss 3295, target 3253

5/28 Gold Analysis and Trading SignalsGood morning everyone!
Yesterday, gold saw a sharp downward move, and we profited well by trading short based on the double-top pattern.
Yesterday, gold has reached the 3287 support area, and by the end of the U.S. session it rebounded slightly above 3300. Although the rebound lacks strong momentum, it does show that the support zone held on the first test. Whether the bulls can take back control depends heavily on today's follow-up strength.
📊 Key Technical Levels:
If bulls break above and hold 3323–3336, a bullish reversal is likely;
If the bounce is weak, short positions remain the preferred strategy;
4H support: 3268
Daily support: 3172
Before that, 3301–3275 also forms an important support zone;
If price breaks below 3301–3275, especially under negative news impact, a drop to 3150 or even 3100 is not out of the question.
🗞 Key News Focus Today:
Watch for May FOMC-related remarks during the U.S. session, which could become a catalyst for major market movement.
📈 Today’s Trading Plan:
📉 Sell in the 3342–3362 zone (strong resistance)
📈 Buy in the 3258–3248 zone (strong support)
🔁 Flexible intraday levels to monitor:
3336 / 3328 / 3319 / 3306 / 3295 / 3286 / 3274 / 3266
Stay sharp and combine technicals with key news events to make informed trades. Feel free to reach out if you need support — wishing you a profitable day ahead!

XAUUSD Long PositionI've just entered this Long position on Gold and I'm looking to hold this position and eventually sell when price reaches the short-term resistance level at around the "3,360.00" area.
#GOLD #XAU #XAUUSD #LONG #BUY OANDA:XAUUSD

Key data will be released, gold will usher in a turning point🗞News side:
1. Musk issued the "strongest" condemnation of Trump
2. Trump and Netanyahu failed to reach an agreement, and the US-Iran negotiations may be "disrupted" by Israel
📈Technical aspects:
Gold prices continued to fall this week as Trump extended the impact of increasing tariffs on the European Union. After stabilizing at 3285 and rebounding yesterday, the gains and losses at 3315 during the day are the key to the subsequent layout. The current Asian session did not stand above 3315 in the morning, which means that the short-term retracement and decline have not ended, and only by breaking through 3315 can there be a chance to continue upward. The 4H level of gold is not so strong at present. The market encountered resistance and fell back at the upper track. Now the market has touched the lower track. The Bollinger Bands have not opened and are still flat, indicating that the market is in a volatile trend in the short term. The support below 3280 just coincides with the lower track. The upper side pays attention to the resistance near the middle track of 3325. If the pressure near the middle track of 3325 is broken, it can be seen to the upper track of 3365. If the market breaks below 3280, it is expected to go to 3260-3250. The European session will temporarily maintain a high-altitude low-multiple cycle. Pay attention to 3315-3325 on the upper side and 3285-3280 on the lower side.
If you agree with this view, or have a better idea, please leave a message in the comment area. I look forward to hearing different voices.
OANDA:XAUUSD FX:XAUUSD TVC:GOLD FXOPEN:XAUUSD FOREXCOM:XAUUSD

Geopolitics Fail to Lift Gold as Dollar Regains MomentumOANDA:XAUUSD TVC:GOLD Gold trades near $3,300, respecting TL1 trendline resistance. A break below the $3,289 level may trigger a deeper pullback toward the key $3,247 support zone. On the flip side, reclaiming $3,315 could open the path toward $3,342 resistance.
On the news front, despite escalating Russia–Ukraine tensions and a record drone strike from Moscow, gold failed to gain. Risk sentiment improved after President Trump postponed the 50% EU tariff deadline, lifting both the U.S. dollar and Treasury yields. U.S. consumer confidence also surprised to the upside at 98.0 in May, dampening safe-haven demand.
Markets now await the Fed’s May Meeting Minutes, which may reinforce the cautious hawkish stance. This poses near-term downside risk to gold if policy flexibility remains limited.
Resistance : $3,315 , $3,342
Support : $3,289 , $3,247

Gold Falls as Expected — Bearish Structure HoldsAfter today’s market open, gold entered the 3346–3358 resistance zone, but failed to maintain upward momentum.
As expected from yesterday’s analysis, the bearish pattern remained intact, and price turned lower.
🔔 Congrats to those who followed the plan — another profitable move locked in!
🔍 Current Market Outlook:
✅ Trend remains bearish, technicals do not currently support a bullish case;
✅ Key support zones:
First support: near 3306
Major zone: 3290–3280
Extended support: around 3260
📌 We’ll continue to focus on short setups as long as the bearish structure holds.
⚠️ Key Reminders:
The market won’t fall in a straight line — watch for temporary rebounds;
During rebounds, pay attention to support/resistance flips;
Be ready to adjust your strategy if the trend shifts!
📍 Important resistance levels:
3346–3338
3324–3318
(This has been highlighted multiple times — don’t ignore it.)
✅ Stick to the plan, adapt to the trend, and manage risk like a pro — that’s the key to consistent profits.

XAUUSD:Long trading ideas
On the whole, the easing of the trade end further reduces risk aversion, and the geopolitical situation supports the normalization. It is expected that gold will maintain a volatile pattern in the short term, and bullish in the medium and long term.
Below the strong support near 3288, back to step into the market can be more than a single rebound. (Those who hold long orders can add long positions at this position), the upper short target is 3320-25, then 3360.
So the trading strategy :BUY@3288-94 TP@3320-25
↓↓↓ More detailed strategies and trading will be notified here →→→
↓↓↓ Keep updated, come to "get" →→→

Gold prices steady in recovery above 3300⭐️GOLDEN INFORMATION:
Gold prices fell over 0.50% on Monday, weighed down by reduced demand for safe-haven assets after U.S. President Donald Trump announced a delay in the imposition of tariffs on the European Union (EU). Trading activity remained subdued due to market closures in both the United States and the United Kingdom for public holidays. At the time of writing, XAU/USD is trading around $3,336.
Sentiment improved following Trump’s Sunday statement, which postponed the implementation of the 50% tariffs on EU goods to July 9. As a result, gold came under pressure, retreating after last week’s impressive 4.86% surge—its strongest weekly performance since early April.
⭐️Personal comments NOVA:
Gold price continues to maintain the accumulation price range of 3300 - 3367, in recovery momentum
⭐️SET UP GOLD PRICE:
🔥SELL GOLD zone : 3389- 3392 SL 3396
TP1: $3380
TP2: $3368
TP3: $3350
🔥BUY GOLD zone: $3285- $3287 SL $3280
TP1: $3295
TP2: $3310
TP3: $3325
⭐️Technical analysis:
Based on technical indicators EMA 34, EMA89 and support resistance areas to set up a reasonable BUY order.
⭐️NOTE:
Note: Nova wishes traders to manage their capital well
- take the number of lots that match your capital
- Takeprofit equal to 4-6% of capital account
- Stoplose equal to 2-3% of capital account

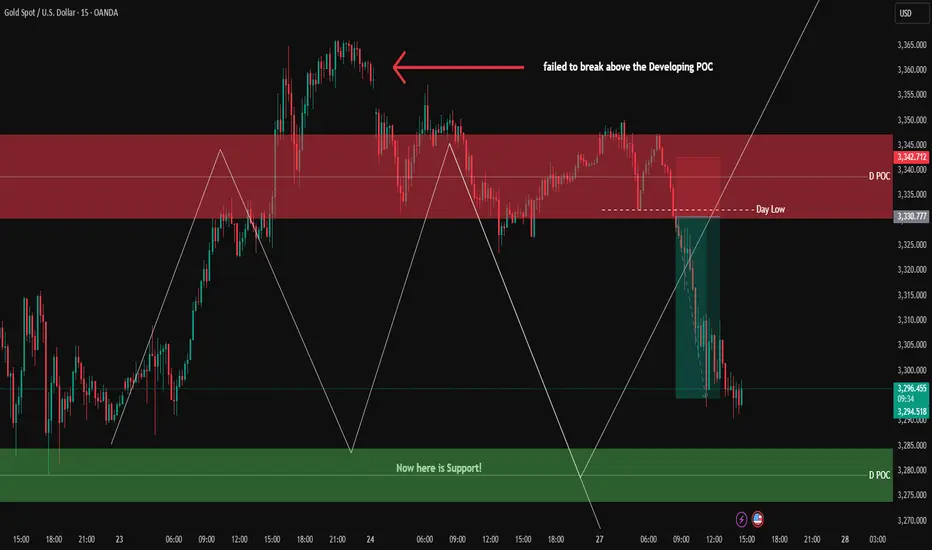
XAUUSD Update – 1H Confirmation/ 15 min Chart/ 3min Sell SetupGold failed to break above the Developing POC resistance and is now pulling back toward the demand zones marked on the chart.
At 3331.8, we entered a short position after the day's low was swept on the 3-minute timeframe, combined with our entry confirmations — resulting in a clean 1:3 R:R ✅
Now we’re waiting for price to reach the demand zones. If we get confirmation on lower timeframes, we’ll be looking to enter a long position.
🔔 The deeper price pulls into the lower demand zones, the better the long setups become, allowing us to consider increasing our risk from 1% to 3%, given a solid setup and momentum.
🔍 Insight by ProfitaminFX
If this outlook aligns with your bias, or if you see it differently, feel free to share your perspective in the comments. Let’s grow together 📈
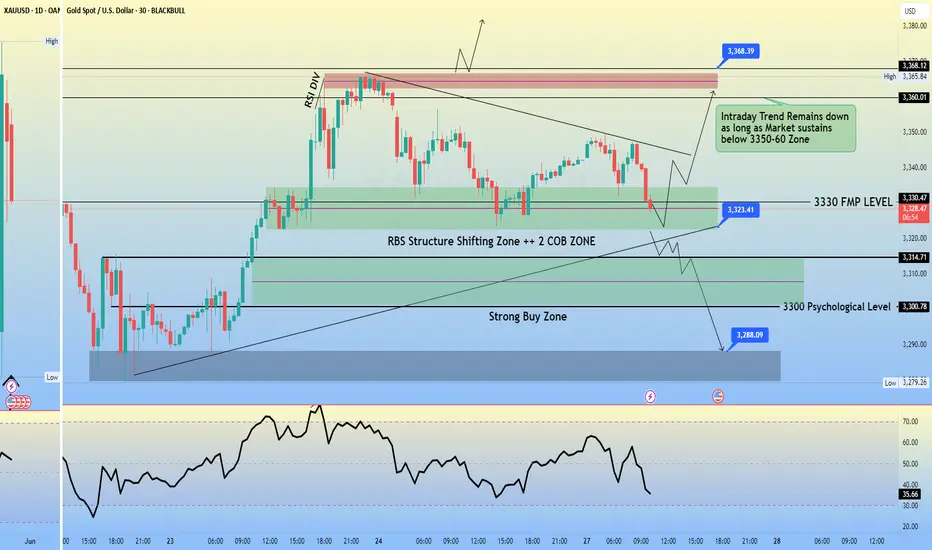
GOLD M30 Intraday Chart Update for 27 May 2025As you can see that there some zones mentioned in chart
right now market is in short selling trend as long market sustain below 3350-60 once market clearly break 3350 psychological level then it will move towards 3380 or even 3400
you may do some scalping between 3320-3350 but remember trade always with SL
And if market goes below 3320 level then wait sustain below 3320 then enter with proper SL for sell direction
Disclaimer: Forex is Risky !
5/27 Gold Analysis and Trading SignalsGood afternoon everyone!
Yesterday, gold fluctuated within the flexible trading zone, and we only executed a long entry near 3323, which brought decent profit.
Today, gold opened with an upward move toward 3350, but quickly pulled back. The recent market shows a sideways consolidation, with the $3340 level acting as a key pivot zone:
Below 3340: dense support areas
Above 3340: resistance clusters
In this context, any breakout without strong momentum can easily lead to capital flow shifts, causing false breakouts or rapid pullbacks, making trend continuation more difficult.
📉 Technical View:
On the 30M chart, bearish momentum slightly outweighs bullish, and gold is likely to remain range-bound within the zone defined yesterday.
🗞 Fundamental Reminder:
There are a few important U.S. economic releases during the NY session. Watch closely to see if they provide a clear directional push.
📈 Today’s Trading Plan:
📉 Sell in the 3366–3386 zone (resistance area)
📈 Buy in the 3278–3256 zone (support zone)
🔁 Flexible intraday levels to monitor:
3353 / 3341 / 3334 / 3317 / 3309 / 3296 / 3284
Trade with flexibility, beware of fake breakouts, and focus on NY session data-driven opportunities. Let me know if you have questions — good luck and happy trading!

Gold Trading Strategy for the 27thOn the 4-hour chart today, the bullish trend of gold remains intact ⭐️✨📈 ⚠️📉
The current price is facing resistance at 3365 near the previous high. Due to the excessive release of early bullish momentum, a period of adjustment is usually required 📉
However, with further news-driven stimuli this week, gold may still surge sharply 🚀
The key lies in the morning session's trend, so timing is crucial when judging the strength of bulls and bears ⏰
It is expected that gold will continue the pattern of oscillating upward movement, and pullback opportunities can be captured 📈
Resistance is at 3365, and support is at the 3320 level 🔍
Long Position Strategy:
If the gold price retracts to the 3320-3325 range, consider opening a long position 📊 Set the stop-loss at 3317, with targets at 3340-3350 🎯
If the price holds above 3320, try opening a long position 🌟 The initial target is 3345, and if 3345 is successfully broken through, further targets will be 3350-3360 ⚡️
Short Position Strategy:
When the price rises to the 3360-3365 range, try opening a short position ⚠️ Set the stop-loss at 3370, with targets at 3340-3330 📉
Gold Trading Strategies
sell@3360-3365
tp:3330-3340
buy@3320-3325
tp:3350-3360
Professional trading strategies are pushed daily 📊
Lock in precise signals amid market fluctuations 🚀
Confused about market trends? Stuck in strategy bottlenecks?
Real-time strategies serve as your "trading compass" 🌐
From trend analysis to entry/exit points, dissect market logic comprehensively
Refer now 📲
Help you move steadily forward in investments ✨
👇👇👇
