The Dual Crisis of the US Dollar and US DebtGold has been strong recently, and both technical and fundamental factors show that bulls are in a dominant position. Although there is no clear reversal signal at the daily level of gold, the high-level pullback is more like a normal adjustment in the rising process rather than a trend reversal. We still need to remain vigilant and pay close attention to market dynamics, especially the risk of high-level reversal. At present, the upper resistance is 3485-3490, and the lower support is 3444-3440. In terms of operation, I suggest shorting on rebounds and long on pullbacks. Once the market direction changes suddenly, it is particularly important to withdraw in time and avoid risks.
Operation strategy 1: It is recommended to go short at 3465-3470 on the rebound, stop loss at 3480, and the target is 3445-3430.
Operation strategy 2: It is recommended to go long at 3430-3425 on the pullback, stop loss at 3417, and the target is 3450-3480, and the target is 3500 if it breaks through.
Xauusdbuy

Will gold continue to rise after the correction?At present, the short-term support of 4 hours is at 3442 of the 5-day moving average. If the extremely strong pattern falls back to 3442, it will be more. Further support is near the early high of 3435, which is also the support level for falling back and long positions. At the same time, it is also near the middle track of the hourly level, and the maximum support level for falling back at the hourly level. The intraday watershed is the early low of 3412. If it is broken, the market will turn weak. From the perspective of time, gold will rise in the Asian session, and there will be a second high in the European session. Focus on the strength of the European session to layout the US session. Today, gold will rise to $3,500, and the expected rise this year is $4,200-4,700. On the whole, today's short-term operation of gold suggests that callbacks should be the main focus, and rebound shorts should be supplemented. The top short-term focus is on the first-line resistance of 3500-3530, and the bottom short-term focus is on the first-line support of 3410-3440. All friends must keep up with the rhythm.
Short order strategy:
Strategy 1: Short 20% of the gold position in batches when it rebounds to around 3500-3503, stop loss 6 points, target around 3470-3450, and look at the 3440 line if it breaks;
Long order strategy:
Strategy 2: Long 20% of the gold position in batches when it pulls back to around 3440-3443, stop loss 6 points, target around 3475-3495, and look at the 3500 line if it breaks;

XAUUSD BULLISH CHART ANALYSISI Created This XAUUSD Chart Analysis In 15-M Tf
Entry: BUY from 3455
Support zone : 3450
Target Will Be : 3490
NOTE : THIS CHART ANALYSIS IS BASED ON PERSONAL ANALYSIS FOR LEARNING PURPOSES. PLEASE USE PROPER RISK MANAGEMENT

Trump and Powell's "power showdown" ignites global risk aversion
📌 Driving events
On Tuesday (April 22), gold prices soared and set a new record high. Spot gold once hit the $3,500 mark, an increase of about 2.2%. US President Trump criticized Federal Reserve Chairman Powell for worrying the market, suppressing risk appetite and pushing investors to turn to safe-haven gold. After hitting the 3,500 mark, the price of gold fell slightly. Spot gold is currently trading at nearly $3,478.55 per ounce.
📊Comment analysis
KCM Trade Chief Market Analyst Tim Waterer pointed out that under the double blow of tariff concerns and the Trump-Powell farce, investors are fleeing US assets across the board. The continued weakness of the US dollar has created an excellent opportunity for gold to rise.
On Monday, Trump made a tough statement, asking the Federal Reserve to "cut interest rates immediately" otherwise the US economy will face the risk of slowing down. Powell insisted last week that interest rates should not be easily adjusted until the impact of Trump's tariff policy on inflation becomes clear.
💰Strategy Package
Long position:
Actively participate near 3430, with profit target above 3500 points
⭐️ Note: Labaron hopes that traders can properly manage their funds
- Choose the number of lots that matches your funds
- Profit is 4-7% of the fund account
- Stop loss is 1-3% of the fund account

(XAU/USD) Bullish Setup: Demand Zone Bounce with 5.89% Trgt Ptnl🔵 Current Price: $3,451.03
🟡 EMA (9): $3,457.20
🔻 Price is just below EMA — short-term pressure.
Zones & Key Levels:
🟦 Demand Zone:
🔽 Price bounced here before — strong buyer interest!
📍 Zone Range:
* Top: $3,442.38
* Bottom (Stop Loss): $3,395.87
* 🔴 Stop Loss set here to limit risk.
🟨 Entry Point:
* Entry suggested at $3,457.20
* Just above the current price and EMA — needs confirmation
* ⚠️ Wait for bullish candle or price action signal above EMA
🟩 Target Point:
🎯 Target: $3,645
* 📈 Potential gain: +202.78 pts (5.89% upside)
* 🚀 Aiming to break previous ATH (All-Time High)
Visual Trade Plan Summary:
* ✅ Buy Entry: $3,457.20
* ❌ Stop Loss: $3,395.87
* 🎯 Target: $3,645.00
* ⚖️ Risk-to-Reward: Solid, over 3:1
Sentiment:
* If price respects demand zone and reclaims EMA — bullish setup
* 🕵️♂️ Watch for volume or confirmation candle near entry

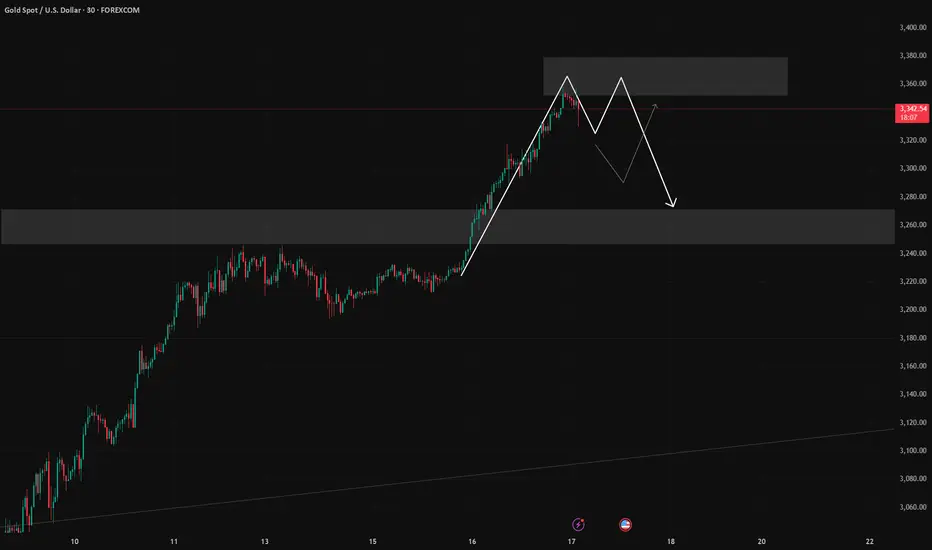
GOLD New 2 Scenarios Available , Which One You Prefer ? Here is my opinion on Gold right now , after my last 2 posts on It , now i see the price need to go down a little to make any correction and i think this will happen tomorrow , so if we have a 4h Closure below my Support , we can sell it at least for 300 pips , and if we have not , then we can buy it but i prefer to sell it before buy it again , just follow the price action and then you can take you decision .
This Is An Educational + Analytic Content That Will Teach Why And How To Enter A Trade
Make Sure You Watch The Price Action Closely In Each Analysis As This Is A Very Important Part Of Our Method
Disclaimer : This Analysis Can Change At Anytime Without Notice And It Is Only For The Purpose Of Assisting Traders To Make Independent Investments Decisions.

Gold trading ideas for todayHello everyone. Let's discuss the trend of gold this week. It can be seen that gold has retreated to around 3452, and 3452 is also the support position of the AM10 moving average.
The next operation is actually very simple. If gold stabilizes at 3445-3430, it should continue to buy.
If it falls below 3430, then you need to wait for around 3400 to buy.
There is no need to look too far for the upper target price. Continue to look at the high point of 3500, or even the new high of 3520.

#XAUUSD: Bullish Rally To Continue $3550 Area! Gold’s been on a steady upward climb, and it seems like it might keep going up. The only thing that’s really driving it up is the fundamentals. Right now, the price is super high, and selling it could be risky.
Thanks for your support! 😊
If you want to help us out, here are a few things you can do:
- Like our ideas
- Comment on our ideas
- Share our ideas
Team Setupsfx_
Cheers,
Team Setupsfx_

Is there a chance that gold will fall?Hello everyone. Let's discuss the trend of gold. Currently, the support of gold is around 3380. If the correction of gold is weak, it may continue to rise after testing 3380.
On the contrary, if it falls below 3380, then gold has a probability to continue to test the low support position near 3370.
Finally, there is the 4-hour support position of 3360-3350.
Therefore, try to pay attention to the support situation here at 3380 first. If there is a chance to reach this point and stabilize, gold will have the opportunity to continue to look at 3420 and 3435.
On the contrary, if it falls below 3380, then you need to continue to wait for the low point of 3370, or even the high point of Friday at 3360-3350 to buy.

Gold prices hit resistance as they push higherGold prices continued to fluctuate this week. Last Thursday, gold prices stabilized and rebounded near $3,284, and remained strong after breaking through $3,300. During today's Asian session, gold prices repeatedly hit the 3,385 pressure level but failed. After retreating to around 3,369 and gaining support, they rebounded again to around 3,396. The current price faces technical repair needs, but the overall upward trend has not changed, and the probability of breaking through the $3,400 mark is still high. The support level of the retracement is focused on the Asian session low of 3369 US dollars and the 4-hour MA5 moving average of 3360 US dollars. You can arrange long orders on dips; the upper pressure focuses on the 3396-3400 line. After breaking through, you need to be alert to the pressure of the daily error band indicator of 3425-3430 US dollars. At present, you can go short at the rebound of 3395 in the short term. The general trend is still dominated by low and long.
Gold recommendation: Go short near the rebound of 3395-3400, stop loss 3405, target 3370, strict stop loss for large fluctuations
Gold operation: Go long near the retracement of 3370-3375, stop loss 3362, target 3400, strict stop loss for large fluctuations

"Gold on Fire: Eyeing $3500 After RBR Zone Rebound! "1️⃣ Trend Overview
📈 Strong bullish rally from April 11 to the peak.
📉 Pullback after reaching the recent ATH (All-Time High) zone.
2️⃣ Key Zones
🔵 RBR Zone (Rally-Base-Rally):
Marked support area between $3,271.41 and $3,307.04.
Acts as a buy zone / entry point.
🟣 ATH Zone:
Minor resistance from the recent high.
Price pulled back from here before potentially continuing up.
3️⃣ Entry & Target
✅ Entry Point: Around $3,307.04 (top of RBR zone).
🎯 Target Point: Clearly defined at $3,500.71.
Potential Gain: +188.59 points
ROI: +5.70%
4️⃣ Indicator
📊 EMA (7, close):
Currently at $3,329.09
Price is slightly below EMA = short-term correction or pause.
Strategy Summary
🟢 Buy Setup:
Wait for price to return to RBR zone
Enter long position ✅
Target $3,500 🚀
⚠️ Risk Consideration:
Place stop-loss below RBR zone for safety.

4/21 Gold Trading StrategyGood morning, everyone! A brand new week begins—wishing us smooth trades and great success ahead.
Looking back to last Thursday, our gold short strategy hit the mark perfectly. Prices dropped nearly $60 as expected, and we captured around $45 in profit from that move. Overall, we secured over $200 in profit space last week—an excellent performance.
Today, gold opened higher and continues to climb. Technically, bulls still have room to push higher, with 3360 as a key resistance level. However, judging by the current momentum, we may even see a test of 3400. That said, trading is about precision, not perfection. If prices approach 3380 and the upward momentum stalls, it may be time to watch for a pullback. On the other hand, if strength continues, holding some light long positions remains a relatively low-risk strategy.
Trading Strategy for Today:
📉 Sell in the 3380–3410 range
📈 Buy in the 3307–3280 range
🔁 Flexible trades between 3360–3330 / 3272–3315

Gold breaks out strongly and rises, is it an opportunity?The 1-hour moving average of gold continues to form a golden cross and is in a bullish arrangement. Gold rose directly at the opening, breaking through the short-term downward trend and directly breaking through the previous high of 3357. Therefore, the short-term 3357 of gold has formed support. If gold falls back to 3357, continue to buy on dips. However, it should be noted that if gold falls below 3357 again, the adjustment range of gold may increase.
Gold has been rising wildly under the stimulation of recent risk aversion. In this kind of emotional market, we can only follow the trend, because gold continues to hit new highs and no one knows where it will rise. However, don’t easily chase the highs. After the fluctuations increase, the magnitude of each correction will not be small.
Trading idea: Go long near gold 3357, stop loss 3347, target 3380

Gold: Profit on Open, Focus on Key Zones Congrats to everyone who followed my long positions before last Thursday’s market close!
Gold opened higher today, bringing us the first profit of the new week — a great start with accurate direction!
Currently, gold is facing selling pressure near the historical high around 3360. On the 1H chart, technical indicators look solid. Once the pressure is absorbed, there’s a good chance the price may reach new highs today.
However, be cautious: If the upward trend weakens or stalls, there’s a risk of a double top formation — a bearish sign for the bulls.
📌 Key zones to watch today (as marked in the chart):
Support: Around 3308
Resistance: Around 3369
With price at elevated levels, a breakout above resistance often leads to a pullback to retest previous support, so adjust strategies flexibly.
Trading Advice:
Focus on support/resistance flips
Prioritize sell high, buy low within the zone
Manage risk and avoid chasing price blindly

XAU/USD Longs from 3,220 or 3,120 back to ATHMy Analysis this week for gold is for it to keep pushing higher, even though gold has been overbought and we could at any time expect a major correction or distribution. We will be going on. current market structure and currently we have seen another ATH breach as well as multiple break of structures to the upside.
From these demand zones that have been created we will be looking for a small correction a retracement in which price will then re accumulate in one of our POI, to cause another rally to the upside.
Confluences for GOLD Buys are as follows:
- Demand zone on the 4hr and 6hr is near by for potential long setups to formulate.
- Market structure has been very bullish on the lower and higher time frame
- There is asian high above that needs to get taken out as well
- Dollar index has been bearish which means bullish movement for GOLD
P.S. If price breaks through both demand zones i do have an extreme one at 3,020 but if it reaches that low we could expect price to just start moving temporarily bearish.

XAU/USD "The Gold" Metal Market Heist Plan (Swing/Day Trade)🌟Hi! Hola! Ola! Bonjour! Hallo! Marhaba!🌟
Dear Money Makers & Robbers, 🤑💰✈️
Based on 🔥Thief Trading style technical and fundamental analysis🔥, here is our master plan to heist the XAU/USD "The Gold" Metal market. Please adhere to the strategy I've outlined in the chart, which emphasizes long entry and short entry. 🏆💸"Take profit and treat yourself, traders. You deserve it!"💪🏆🎉
Entry 📈 :
"The loot's within reach! Wait for the breakout, then grab your share - whether you're a Bullish thief or a Bearish bandit!"
🏁Buy entry above 3070
🏁Sell Entry below 2950
📌However, I recommended to place buy stop for bullish side and sell stop for bearish side.
Stop Loss 🛑: "🔊 Yo, listen up! 🗣️ If you're lookin' to get in on a buy (or) sell stop order, don't even think about settin' that stop loss till after the breakout 🚀. You feel me? Now, if you're smart, you'll place that stop loss where I told you to 📍, but if you're a rebel, you can put it wherever you like 🤪 - just don't say I didn't warn you ⚠️. You're playin' with fire 🔥, and it's your risk, not mine 👊."
🚩Thief SL placed at 2960 (swing Trade Basis) for Bullish Trade
🚩Thief SL placed at 3050 (swing Trade Basis) for Bearish Trade
Using the 4H period, the recent / swing low or high level.
SL is based on your risk of the trade, lot size and how many multiple orders you have to take.
Target 🎯:
🏴☠️Bullish Robbers : TP 3260 (or) Escape Before the Target
🏴☠️Bearish Robbers : TP 2800 (or) Escape Before the Target
⚒💰XAU/USD "The Gold" Metal Market Heist Plan is currently experiencing a neutral to bullish trend,., driven by several key factors.... 👇👇👇
📰🗞️Get & Read the Fundamental, Macro, COT Report, Geopolitical and News Analysis, Sentimental Outlook, Intermarket Analysis, Index-Specific Analysis, Positioning and future trend targets.. go ahead to check 👉👉👉🔗🔗
📌Keep in mind that these factors can change rapidly, and it's essential to stay up-to-date with market developments and adjust your analysis accordingly.
⚠️Trading Alert : News Releases and Position Management 📰 🗞️ 🚫🚏
As a reminder, news releases can have a significant impact on market prices and volatility. To minimize potential losses and protect your running positions,
we recommend the following:
Avoid taking new trades during news releases
Use trailing stop-loss orders to protect your running positions and lock in profits
💖Supporting our robbery plan 💥Hit the Boost Button💥 will enable us to effortlessly make and steal money 💰💵. Boost the strength of our robbery team. Every day in this market make money with ease by using the Thief Trading Style.🏆💪🤝❤️🎉🚀
I'll see you soon with another heist plan, so stay tuned 🤑🐱👤🤗🤩

Gold bull cycle continues, 3390
Hello brothers, let's comment on the gold price next week from April 21, 2025 to April 25, 2025
💥 World Situation:
Gold prices are expected to end the year on a strong note, rising more than 2.79%, with the precious metal surging nearly $90 amid continued weakness in the U.S. dollar (USD) due to ongoing global trade uncertainties. At the time of writing, XAU/USD is trading around $3,326.
Despite hitting an all-time high of $3,358, the rally cooled slightly as both European and U.S. markets were closed as traders locked in profits ahead of the extended Easter weekend. Meanwhile, real yields edged higher, offering mild resistance. On the policy front, San Francisco Fed President Mary Daly noted that the U.S. economy remains resilient, even though some areas are showing signs of slowing. She stressed that monetary policy remains tight enough to keep inflation in check, while also hinting that the neutral rate could rise.
✡Summary:
Gold prices are still in a big uptrend, and short-term corrections will only allow gold prices to accumulate further and continue to hit new highs. Tariff tensions continue to cause gold prices to rise strongly: 3382, 3400
🔥 Technical:
According to the resistance and support levels of gold prices on the 4-hour chart, important key areas can be identified as follows:
Resistance: $3357, $3382, $3390
Support: $3284, $3260, $3155
⭐️ Note: Labaron hopes that traders can properly manage their funds
- Choose a lot size that matches your funds
- Profit is 4-7% of the fund account
- Stop loss is 1-3% of the fund account

Gold: A textbook example of an extreme short squeeze!📌 Gold has surged over $400 in just six trading days—a textbook example of an extreme short squeeze!
Yesterday, gold broke above the 3300 psychological barrier and is now trading above 3360. While safe-haven demand driven by escalating trade tensions is part of the reason, such a rapid and steep rally is clearly unsustainable.
⚠️ If you enter at these levels and get trapped, trying to "hold and hope" could result in facing $100+ of price swings—a dangerous gamble for most traders.
👉 Experienced traders might manage this volatility with scalping or short-term strategies to mitigate losses or even turn a profit.
❌ But if you don’t have that level of skill, don’t chase this rally blindly.
✅ Suggested approach:
Scale into short positions gradually, or
Wait for clear topping signals before going short
Missing this rally isn’t the end—some of the best opportunities come during corrections. Profit potential remains strong on the way down.
🎯 Bearish targets:
Short-term: 3312 → 3291 → 3250
Mid-term: 3196 → 3137

Will gold experience a sharp drop?Hello everyone. Let's discuss the trend of gold today. If you have other ideas, you can express your different ideas in the comment area. Today, gold continued yesterday's upward trend and set a new record high of 3357!
But we need to be extra careful at present, because tomorrow Friday is closed all day, which means that today Thursday is the last trading day of this week. Currently, long positions in gold are likely to be profit-taking.
Once the long positions are profit-taking, it is easy to have a large retracement, so you must be careful about this and do not buy too much.
From the hourly chart:
Today's high point was 3357 and once retreated to around 3313. It can be found that since it fell below the opening price of 3342, gold has not stood above 3342 again.
This is a strong short-term retracement signal, especially when the long positions are about to be profit-taking.
Moreover, the hourly chart is currently a bit of abc wave retracement. Once it comes down, I think it is not a problem to touch 3300, and it is not ruled out that it will be lower.
At present, the MA10 moving average position below gold is also at 3300-3280.
Therefore, it is not recommended to chase long orders today, and you should be prepared for the possibility of falling to 3300-3280 in advance.
In terms of operation, I suggest that you can maintain the entry and short near 3340, and the target can be 3300-3280.

4/17 Gold Trading StrategyYesterday, the escalation of the tariff issue significantly strengthened bullish momentum in gold, leading to a one-sided upward move. There’s no need for lengthy analysis today — in this kind of market condition, the focus should be on identifying sell opportunities. A sustained rally like this is almost always followed by a correction, even without any additional catalyst.
Furthermore, today’s initial jobless claims data may provide an opening for the bears. Even if the data is bullish for gold, the likelihood of another sharp rally is low at this stage.
Today’s Trading Recommendations:
Sell Zone: 3350 – 3390
Ideal for initiating short positions as gold approaches extreme levels.
Buy Zone: 3268 – 3252
Key support zone where long positions can be considered upon a pullback.
Range Trading Zone: 3330 – 3288
Suitable for flexible intraday trades based on market structure and real-time price action.
Summary:
After a strong one-sided surge, gold is now in overbought territory. Look for short setups at resistance zones, especially with potential catalysts like jobless claims data on the horizon. A healthy correction is both expected and necessary before any further sustained move upward.
Gold is strong and is adjusting today!The rise and fall broke the pattern of the morning cycle, which means that this wave of unilateral rising from 3211 to 3357 can temporarily come to an end. This time the whole increase was as high as 146 US dollars, and there was no correction throughout the whole process. This kind of extreme market situation is rare in history. The bold will die of overeating and the timid will starve to death. It is very suitable for novices who have just entered the market. Blindly chasing the long position will have a miraculous effect, which is the so-called novice protection period.
As the market will be closed tomorrow for Easter, gold is destined not to rise like yesterday, but will enter a period of shock correction. The price fell from 3357 to 3320 in the morning, reaching 37 US dollars. In the afternoon, we should focus on the pressure at 3342 and try to participate in the short position to see the decline. The strong pressure is at the high point of 3356-3357. If it does not break the high point during the day, we can still go short at night. The support below is 3320-3305. If it touches 3305, we can go long to see the rebound.

Gold trend analysis and latest forecastGold directly rushed to the 3358 line, continuing the previous upward trend. The spot gold price has once again hit a record high, breaking through 3350 US dollars for the first time. The decline of the US dollar index is close to a three-year low, triggering a sharp rise in risk aversion in the market, pushing up the gold price. The current basic trend of gold rising has not changed, and the bulls are strong. However, from the perspective of time nodes, even if you are bullish today, you must pay attention to the adjustment space at any time. Gold rose and fell. The European session did not continue to rise but fluctuated and fell. You must pay attention to the second bottoming out in the evening. In addition, the market will be closed tomorrow, Friday, and will not open normally until next Monday. Therefore, today, Thursday, we must do a good job of risk prevention; such as shorting, adjusting positions, and a series of other measures.
A short-term correction or sideways consolidation is a bullish opportunity for the future market. The operation idea is still to follow the trend. Pay attention to the intraday low of 3312 and the support level of 3300 area. This is a strong support area. If it does not break, it will continue to rise strongly. If it breaks, the market will turn to shock. Look down to the 3293-3288 area, which is the 0.5 division level and the support level of the low point of yesterday's European session. If it falls below 3288, gold may accelerate its decline. Therefore, don't be too bullish today. Be bold and be cautious!
Operation suggestions: Aggressive strategy: Try to buy with a light position above 3300, stop loss at 3285; Conservative strategy: Intervene after confirming that the support at 3312 is effective, and wait and see if it breaks below 3293, as the market is changing rapidly.

Gold is strong and is adjusting today!For gold today, the gold surged and then fell, breaking the pattern of the morning cycle of rise, which means that this wave of unilateral rise from 3211 to 3357 can temporarily come to an end. This time the whole increase was as high as 146 US dollars, and there was no correction throughout the whole process. This kind of extreme market situation is rare in history. The bold ones will die of overeating and the timid ones will starve to death. It is very suitable for novices who have just entered the market. Blindly chasing more will have a miraculous effect, which is the so-called novice protection period.
As the market will be closed tomorrow for Easter, gold is destined not to rise like yesterday, but will enter a period of shock correction. The decline from 3357-3320 reached 37 US dollars, so focus on the pressure of 3342 and try to participate in the short position to see the decline. The strong pressure is at the high point of 3356-3357. If it does not break the high during the day, gold can still be shorted; the support below is 3320-3305. If it touches 3305, you can go long to see the rebound.
