XAUUSD Today's Strategy AnalysisLast Friday, after consolidating around the 2980 level, bullish momentum finally broke higher, driving prices to accelerate during European trading hours. Gold pierced the psychological 3000 resistance level but was rejected and pulled back into a choppy consolidation phase. The session closed near 2985 with a doji candlestick, maintaining the strong bullish trend with unidirectional momentum.
From a 4-hour technical perspective, today's downside support levels are focused on the vicinity of 2975-80. Particular attention should be paid to the critical bull-bear dividing line support at 2960-2963. Intraday pullbacks should maintain a bullish bias initially while holding above the 2975-80 support zone. Upside targets remain focused on breaking above recent highs.
Gold trading strategy:
sell @:3000-3005
buy @:2975-2980 , 2960-2963
If you are currently not satisfied with your gold trading performance, and if you also need to obtain accurate trading signals every day, you can check the information in my profile. I hope it can be of some help to you.
Xauusdbuy

XAUUSD Start to Short?The gold price briefly pierced the $3,000 per ounce threshold again today.
From a 4-hour technical perspective, today's downside support levels remain focused on the vicinity of 2975-2980.
The current day's orders are already in profit.
Gold trading strategy:
sell @:3000-3005
buy @:2975-2980 , 2960-2963
If you are currently not satisfied with your gold trading performance and need daily accurate trading signals, you can visit my profile for free strategy updates every day.

Gold’s Big Moment: $3,000 in Play – Can Bulls Hold It?Gold has finally reached the psychological $3,000 level, triggering the first round of sell-offs as traders take profit. The question now is whether this move can sustain itself or if we are set for a deeper pullback. Given the rapid move up, I remain cautious, ready to cut the trade quickly if I see signs of weakness in the continuation.
Fundamentals:
• Market Sentiment: Bullish drivers remain strong as gold benefits from rising inflation expectations and the Fed’s rate pause, which has fueled demand for safe-haven assets.
• Geopolitical & Economic Factors:
• President Trump’s aggressive tariff agenda is fanning concerns about global trade, increasing risk aversion and driving flows into bullion-backed assets.
• Chinese jewelry stocks are soaring, signaling growing demand for gold in the region.
• The CME FedWatch Tool indicates a 97% probability that the Fed will hold rates steady at its next meeting, reinforcing gold’s appeal.
• Technical Considerations:
• Gold hit a fresh all-time high of $2,993, putting the psychological $3,000 mark in focus.
• Above $3,000, there is little historical price action to guide resistance levels, making price discovery uncertain.
• On the downside, $2,970 acts as a key pivot, with $2,951 and $2,914 serving as strong support zones if a deeper retracement occurs.
Risk Management:
• The first sell-off at $3,000 indicates short-term profit-taking.
• I am monitoring price action closely and will exit quickly if the move proves unsustainable.
Let’s see if gold can hold above $3,000 or if we are in for a correction!
Note: Please remember to adjust this trade idea according to your individual trading conditions, including position size, broker-specific price variations, and any relevant external factors. Every trader’s situation is unique, so it’s crucial to tailor your approach to your own risk tolerance and market environment.
XAUUSD:The latest trading strategyGold has once again entered a period of sideways trading at a high level. After the bearish forces of gold made a downward probe on Friday, the price continued to rebound from the bottom. Evidently, the bullish forces of gold still have the upper hand.
Last weekend, the US military launched airstrikes in Yemen, and the crisis in the Middle East is escalating,Market panic will rise further.
Currently, gold is building momentum at a high level, and there has been no significant adjustment. Therefore, the bullish sentiment still dominates the gold market. It is advisable to go long on gold when there is a pullback.
Trading Strategy:
buy@2970-2975
SL:2960
TP:3005
I always firmly believe that profit is the sole criterion for measuring strength. I will share accurate trading signals every day. Follow my lead and wealth will surely come rolling in. Click on my profile for your guide.

XAUUSD Today's strategyLast week, the gold market surged sharply, touching the long-awaited $3,000, and the world continued to increase its gold reserves with relatively large intensity, providing a solid bottom support for gold prices.
After such a sharp rise, a short-term pullback is normal, but the short-term bullish trend remains strong. If it can break through the key psychological level of $3,000 and gain a foothold, there is potential for further gains.
Today's xauusd trading strategy
buy@2965-2975
SL:2960
tp:3008

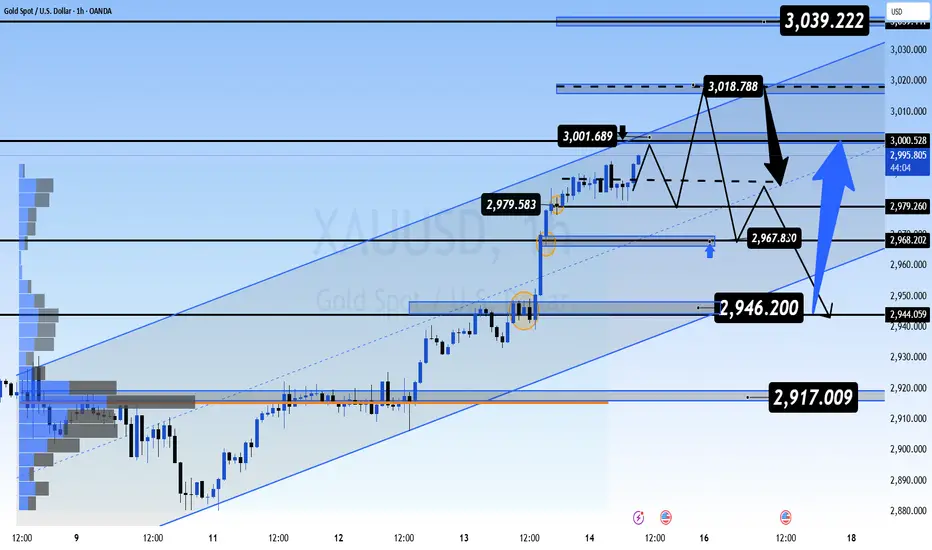
XAUUSD: Next Week's Gold Strategy AnalysisIn the coming week, the gold market will see a game centered around the Federal Reserve meeting, and the short-term volatility is expected to increase. It is recommended that investors maintain a light position, set stop-loss strictly, and pay close attention to the breakout direction of the round number mark of $3,000 and the support level of $2,970. In the medium to long term, the gold purchases by global central banks, the weakening of the US dollar's credit, and the resilience of inflation still support the upward trend of gold prices, and the correction provides opportunities for position arrangement.
Gold trading strategy:
sell@:3000-3005
buy@:2970-2975
If you are currently not satisfied with your gold trading performance, and if you also need to obtain accurate trading signals every day, you can check the information in my profile. I hope it can be of some help to you.

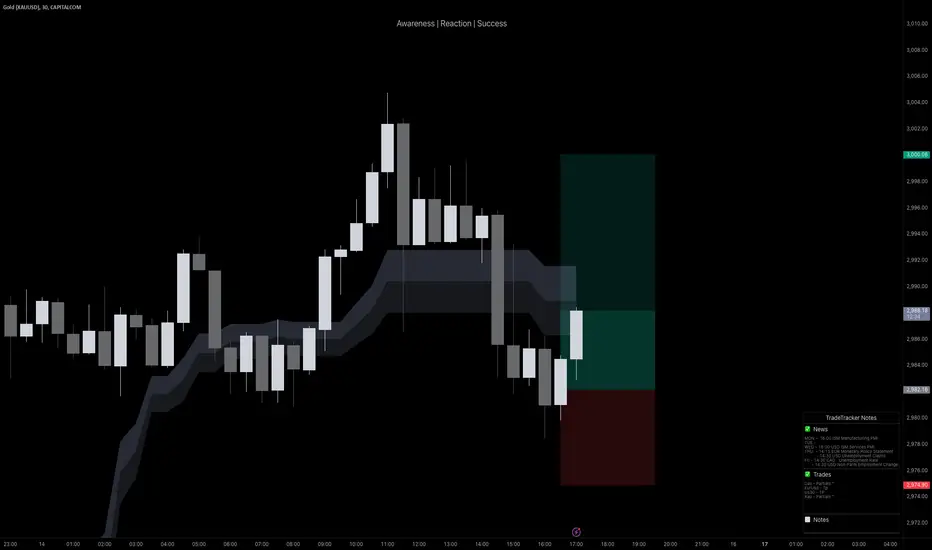
How to get a head start on MondayHow should one operate when XAUUSD opens on Monday?
After the significant rally last week, how should we plan for the subsequent trading?
Just as I analyzed yesterday, the current support level is in the range of 2,970 to 2,975. Once it breaks below 2,970, it may continue to correct and reach the second support level at 2,960, while the upper resistance level is around 3,000.
So we can set the SL at 2978 when making the first buy. If the price drops to 2978, please contact me and I will teach you how to take further actions.
XAUUSD
🎁 Buy@2983-2985
🎁 SL 2978
🎁 TP 2995-3000
If you're struggling to find direction or generate profits in finance,
I'm here to help. As a seasoned financial analyst,
I'm great at decoding market signals for profit - making chances.
I'll customize a plan for you. Contact me now to start seeing financial gains!

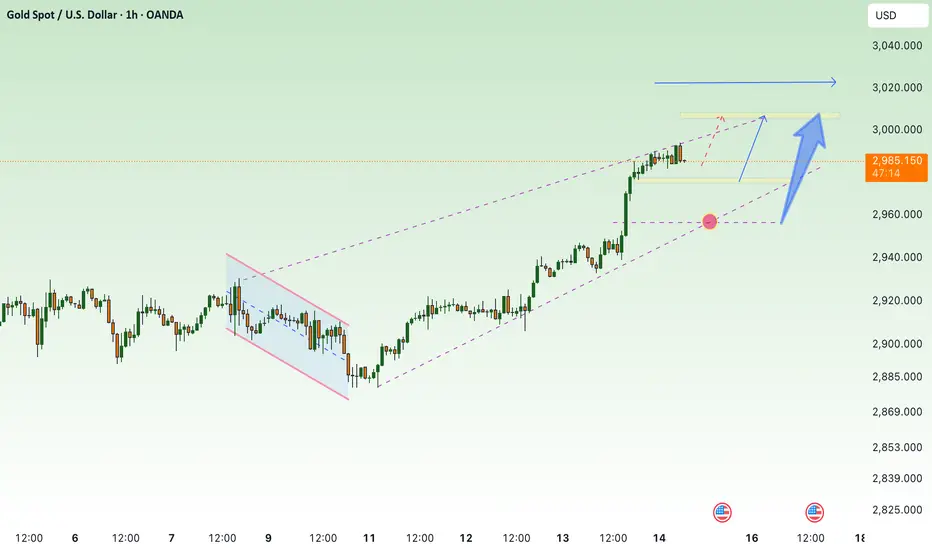
XAUUSD:Trading Strategy for Next WeekAfter a significant rally, it is reasonable for the gold price to experience a short-term pullback and adjustment. In the short term, the bullish trend of gold has not been reversed.
diverging upwards in a bullish manner, indicating that the bullish momentum of gold remains intact. Unless the moving averages start to turn downwards next week, the bullish momentum of gold may be affected.
The support level of the gold moving averages has now shifted up to around $2,968. Next week, one can continue to go long on gold at dips above $2,968. Continue to pay attention to the resistance near the high of around $3,005.
Suggestions for gold trading operations next week:
buy@2970-2975
SL:2963
TP:2998
I always firmly believe that profit is the sole criterion for measuring strength. I will share accurate trading signals every day. Follow my lead and wealth will surely come rolling in. Click on my profile for your guide.

Analysis of the Gold Price Trend Next WeekThis week, the spot gold price witnessed a breakthrough market trend. Influenced by the continuous gold purchases by central banks of multiple countries, the heightened global economic uncertainties, and the expectations of trade frictions, the gold price soared to as high as US$3,005 per ounce at one point, reaching a historical high. Although the short-term overbought signals and the pressure of profit-taking may trigger market volatility, the long-term bullish pattern has already been established.
The key resistance level on the daily chart is at 3025, which is the combination of the previous high and the 2.618 Fibonacci retracement level. The support level below is at 2956, which is the recent level where the top has transformed into the bottom. The hourly chart shows that during the U.S. trading session, the price correction only reached 2978 before gaining support. If the price stabilizes within the range of 2970 - 2975, there will still be short-term upward momentum.
Suggestions for gold trading operations next week:
buy@2970-2975
SL@2963
TP:2998

Gold Surges Past $3,000 Amid Trump, Economic FearsThe glint of gold has intensified, piercing the $3,000 per ounce threshold, a symbolic milestone that echoes through centuries of economic and political upheaval.1 This surge, fueled by a potent cocktail of market anxieties and, notably, the amplified rhetoric of a potential Trump return, underscores gold's enduring role as a safe-haven asset and a barometer of global uncertainty.2 The psychological significance of breaching this key level cannot be overstated, solidifying gold's position as a timeless store of value in an increasingly volatile world.
The current rally, while rooted in broader economic anxieties, has received a significant jolt from the political landscape. The prospect of a second Trump presidency has injected a fresh wave of uncertainty into markets. His often-unconventional policy pronouncements, coupled with the potential for trade disputes and geopolitical tensions, have created a climate ripe for gold's ascent. Investors, seeking to mitigate potential risks, are flocking to the precious metal, driving its price to unprecedented heights.3
Beyond the political sphere, persistent economic concerns are also playing a crucial role. Inflation, despite recent efforts to tame it, remains a lurking threat. Global debt levels continue to climb, and concerns about a potential recession linger. These factors, combined with the inherent instability of fiat currencies, have bolstered gold's appeal as a hedge against economic turbulence.4 Gold, unlike paper money, cannot be printed at will, offering a sense of stability in an uncertain financial landscape.5
Furthermore, geopolitical instability is a perennial driver of gold prices. Ongoing conflicts, simmering tensions between major powers, and the ever-present threat of terrorism contribute to a sense of unease that pushes investors towards safe-haven assets. The perception of gold as a reliable store of value during times of crisis has been reinforced throughout history, and the current global climate is no exception.
The $3,000 milestone also serves as a potent reminder of gold's role as a gauge of fear in the markets.6 When investors are anxious, they tend to seek out safe havens, and gold has consistently proven to be a popular choice. The current surge in gold prices reflects a growing sense of unease about the future, both economically and politically.7 This fear, whether justified or not, is a powerful force driving market behavior.
The technical aspects of the gold market are also contributing to the rally. The break above $3,000 has triggered a wave of buying, as traders and investors seek to capitalize on the momentum. This technical breakout could lead to further gains in the short term, as the market tests new highs. The sheer psychological importance of the $3,000 level also draws in investors who were previously hesitant to participate.
However, it is crucial to recognize that gold prices are not immune to volatility. While the long-term outlook for gold remains positive, short-term fluctuations are inevitable.8 Factors such as changes in interest rates, shifts in investor sentiment, and unexpected geopolitical events can all impact gold prices.9 Investors considering gold as part of their portfolio should be prepared for potential price swings.
The current rally also raises questions about the long-term sustainability of these high prices. While gold's fundamental drivers remain strong, it is important to consider the potential for a correction. Historically, periods of rapid price appreciation have often been followed by periods of consolidation or decline. However, the unique confluence of factors currently supporting gold prices suggests that the rally may have further room to run.
In conclusion, the breach of the $3,000 per ounce mark is a significant milestone for gold, reflecting a confluence of economic, political, and psychological factors. The potential return of Trump, coupled with persistent economic anxieties and geopolitical instability, has created a perfect storm for gold's ascent. This surge underscores gold's enduring role as a safe-haven asset and a gauge of fear in the markets.10 While the future remains uncertain, gold's historical performance suggests that it will continue to play a crucial role in investor portfolios, offering a sense of stability in an increasingly turbulent world. The breaking of such a psychological barrier will also inevitably drive more speculative investment, and thus, drive the market further, at least in the short term. Investors should continue to monitor the global landscape and adjust their strategies accordingly, while recognizing the inherent volatility of the precious metals market. The allure of gold, however, remains strong, a testament to its enduring appeal as a timeless store of value.

XAUUSD Analysis StrategyAs of now, gold has already broken through the 3000 level. It reached a peak of 3005 at its highest point and then pulled back for adjustment.
From the analysis of the 4-hour gold trend, we should focus on the support level at 2956-2965 below, and the resistance level at 3005-3010 above. In terms of operation, we can mainly go long when there is a pullback following the trend. In the middle price range, it is advisable to observe more and act less, and be cautious when chasing orders. We should patiently wait for entry at key price levels. I will provide specific trading strategies during the trading session. Please pay attention in a timely manner.
Gold trading strategy:
buy @ 2956-2960
tp 2990-3000
If you're not satisfied with your current gold trading performance, and if you also need to get accurate trading signals every day, you can focus me. I hope I can be of some help to you.

GOLD SURGES TO RECORD HIGH – IS $3,000 JUST THE BEGINNING?📌 Market Overview
Gold has surged to a new all-time high (ATH), approaching the critical $3,000 per ounce level. The rally has been fueled by recent inflation data (CPI & PPI), which has heightened market volatility. The US Dollar Index (DXY) has dropped to its lowest levels in recent months, further strengthening gold’s bullish momentum. As a result, investors are aggressively buying gold as a safe-haven asset amidst global economic and geopolitical uncertainty. 🚀
👉 Why is gold continuing to rise?
Investors are piling into gold, despite record-high prices, as uncertainty continues to drive demand for safe assets.
Donald Trump’s economic policies have added market instability, increasing gold's appeal.
As long as the USD remains weak, gold will continue to be a top investment choice.
📊 Will Gold Break Above $3,000?
🔹 Short-Term Outlook:
The Asian and European sessions are expected to remain bullish as investors continue accumulating gold.
The US session could bring some profit-taking, leading to temporary price swings.
Friday is historically volatile, meaning sharp pullbacks are possible before the week closes.
📉 Key Technical Levels to Watch
🔺 Resistance Levels: $3,000 - $3,019 - $3,039 - $3,052
🔻 Support Levels: $2,978 - $2,967 - $2,942 - $2,918
🎯 Trading Plan for Today
🔴 SELL ZONE: $3,039 - $3,041
📍 SL: $3,045
🎯 TP: $3,035 - $3,030 - $3,025 - $3,020 - $3,015 - $3,010 - ???
🟢 SCALP BUY: $2,968 - $2,966
📍 SL: $2,962
🎯 TP: $2,972 - $2,976 - $2,980 - $2,985 - $2,990 - $3,000
🟢 BUY ZONE: $2,948 - $2,946
📍 SL: $2,942
🎯 TP: $2,952 - $2,956 - $2,960 - $2,965 - $2,970 - $2,980 - $3,000 - ???
⚡ Final Thoughts – A Correction Before the Next Move?
📌 Gold continues its strong rally, but Friday could bring volatility as traders lock in profits.
📌 Stick to TP/SL strategies to manage risks and avoid sudden market swings.
📌 Watch the US session closely – major moves could happen!
💬 Will gold break $3,000 or face a sharp correction? Drop your thoughts below! 🚀🔥
New ATH will continue to form 3022 ! XAU ⭐️Smart investment, Strong finance
⭐️GOLDEN INFORMATION:
Gold (XAU/USD) consolidates near its record high from the Asian session on Friday, trading within a narrow range. Investor concerns over President Donald Trump's aggressive trade policies and their potential global economic impact sustain demand for the safe-haven metal. Additionally, growing expectations of further monetary easing by the Federal Reserve (Fed) provide additional support to the non-yielding bullion.
⭐️Personal comments NOVA:
The price trend is up, pay attention to the new ATH price zone 3022
⭐️SET UP GOLD PRICE:
🔥SELL GOLD zone: $3006 - $3008 SL $3011 scalping
TP1: $3000
TP2: $2995
TP3: $2990
🔥SELL GOLD zone: $3021 - $3023 SL $3028
TP1: $3015
TP2: $3000
TP3: $2980
🔥BUY GOLD zone: $2958 - $2956 SL $2951
TP1: $2965
TP2: $2977
TP3: $2990
⭐️Technical analysis:
Based on technical indicators EMA 34, EMA89 and support resistance areas to set up a reasonable BUY order.
⭐️NOTE:
Note: Nova wishes traders to manage their capital well
- take the number of lots that match your capital
- Takeprofit equal to 4-6% of capital account
- Stoplose equal to 2-3% of capital account
Gold bulls are close to reaching 3,000After gold broke through the 2830-35 line, it started a bullish trend. I have always been bullish on gold. Friends who follow my articles can see that gold directly broke through the historical high last night and set a new historical high. Gold fell back and continued to rise. Gold is only one step away from 3000. The hourly moving average of gold continued to form a golden cross and diverge upward in a bullish arrangement. After gold broke through on Wednesday night, gold bulls were even better. Gold has now broken through its historical high. If gold falls back to the last high of 2956, it is an opportunity to buy on dips. However, strong markets often have a large decline. If the decline is too large, gold will weaken instead. Then gold can buy on dips when it falls back to 2965-70. The current decline of gold is an opportunity to buy. Gold 3000 is within reach, and it is expected to test and break through 3000 today.
From the analysis of the 4-hour gold trend, we focus on the support of 2956-65 below and the suppression of 3000 above. In terms of operation, we can follow the trend to go long. Once a breakthrough occurs, we can continue to follow up in the later stage. In the middle position, we should watch more and do less, and follow orders cautiously, and wait patiently for key points to enter the market.
Gold operation strategy:
1. Buy more when gold falls back to 2965-70, and buy more when it falls back to 2956, stop loss at 2949, target 2995-3000, and continue to hold after breaking through.

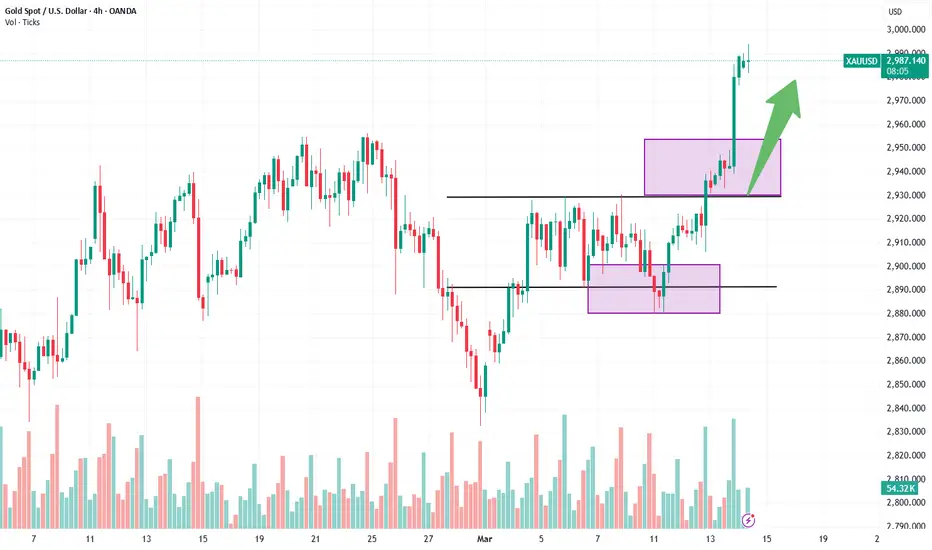
Gold 100% Profit SignalGold prices rose, hitting another record high as heightened tariff uncertainty and bets on the Federal Reserve's loosening of monetary policy kept the metal attractive. Spot gold rose 1.46% to $2,972.80 an ounce at press time, reaching an intraday high of $2,978.33, surpassing the previous record high of $2,956.15 set in February. Gold prices could soar to an unprecedented $3,500 an ounce in the third quarter as investors flock to safe-haven assets amid heightened geopolitical tensions. It is predicted that gold prices could average $3,150 an ounce between July and September. Concerns about a possible shutdown of the U.S. federal government also weighed on the market as Senate Democrats failed to agree on a temporary funding bill on Wednesday, adding to uncertainty.
Meanwhile, the weakening of US inflation data further reinforced the market's expectations of a rate cut by the Federal Reserve. The US CPI data for February released on Wednesday showed that the overall inflation rate fell from 3% in January to 2.8%, lower than market expectations; the core CPI (excluding food and energy) rose 3.1% year-on-year, also down from 3.3% in January. This data boosted the market's confidence in the Fed's loose policy, and some traders even expected the Fed to cut interest rates by 25 basis points in June, July and October respectively. The rising expectations of rate cuts directly depressed US Treasury yields. Although the US dollar index rebounded slightly from its low since October 16, it still lacked strong momentum for a strong counterattack overall. This environment provides significant support for non-interest-bearing gold.
Technical analysis of gold: On Thursday, gold in the U.S. market pushed upward and broke through the high. The price broke through the high of 2956 and then accelerated to rise. The current high is 2978. This position is 100% of the previous round of rise and expansion, which belongs to the resistance area. Pay attention to whether it can suppress the bulls. The amplitude after breaking the high is larger than expected. After gold broke through 2930 yesterday, gold bulls were strong, and no longer the same volatile market as before. Gold bulls began to exert their strength, and gold began to go long in reverse. Gold was directly long at 2933 today, and the article also directly and publicly suggested going long at 2933. Gold rose and harvested. Gold fell back to around 2940 in the U.S. market and continued to go long. Gold rose again and harvested. Gold went long in reverse and won three consecutive victories.
In the short term, the current increase of more than 40 US dollars throughout the day is obviously very risky. Going long is also against the trend. The trend belongs to the bulls. The 1-hour moving average of gold continues to cross upward and the bulls are arranged and divergent. The gold bulls are in high spirits. Today we have been emphasizing that gold falling back to 2930 is an opportunity to buy on dips. The gold bulls will become more and more fierce. Gold will rise directly when it falls back to 2939 in the US market. The US market directly breaks the historical high of 2956. Then gold will continue to buy when it falls back to 2956 in the future. Gold is likely to hit a new record high again and go to 2985. Gold has now broken through the shock range, so there is obviously a trend change. Then the only way is to follow the trend and go long. Going with the trend is light and fluttering, and going against the trend is messy. On the whole, the short-term operation strategy of gold today is recommended to focus on callbacks and short rebounds. The short-term focus on the 3000-3010 resistance line on the upper side and the short-term focus on the 2975-2965 support line on the lower side.
Strong rise to test 2956 again?Before gold broke through the suppression of 2930 yesterday, gold fluctuated, but we have always emphasized that the fluctuation should follow the previous trend. It is also difficult to fall, and every fall is an opportunity to go long! Will there be a new rise today? The low point of 2880 on Monday this week has temporarily become a long defense position, no matter from which angle. If you are bullish, you must rely on this position to defend and look up. The daily line is a big sun, but there are still two mountains to climb, one is to break through the high point of 2956, and the other is to go out of the continuous trend
Today, we need to pay attention to when the price will retreat to give us a chance to get on board, and whether it can break the high when it rises again. This is also the key to judging whether the bull market can continue. If the price fails to break the high next time it rises, but it still rises, it will fall into a high-level consolidation. We will make arrangements for this after we go long later. As for today, if the price does not change much, then the 2956 high point suppression is the key point, followed by the support of the top and bottom conversion of 2930!
2956 does not break the air, defend 2962, and the target is 2935-30! For long orders, look at the support near 2930 to enter the market at an appropriate time!

Gold market trend analysisGold trend analysis: Gold price broke through the suppression level of 2930 last night, and there was a correction in the early morning. The correction was also above 2930 and then rose. As of the time of writing, the gold price was trading around 2941. Although the previous shock range broke upward, today we need to pay attention to whether the gold price can test the previous high of 2956, and secondly pay attention to the support of the resistance-to-support level of 2930, mainly because the recent rhythm is that there is no continuity in the rise and fall.
From the hourly level, the gold price broke down to 2880 at the end of Monday, and recovered the decline at the opening of Tuesday, and crossed the previous day's high, so this upward breakthrough also needs to pay attention to the situation of the correction. After 2930 is broken, the next resistance can refer to the previous high of 2954. The short-term support below is 2930, followed by the position of 2906, which has been repeatedly corrected on the way up. Since the gold price has broken upward, today's trend will be extended to wait for the correction to go long, and the second is to go short after touching the previous high to see a wave of correction. If the European session directly corrects and falls below 2930, then adjust the thinking to execute the high short to see 2906.
1. In the early trading, if the price falls back to around 2828, take a long position with a light position and look at the upside, protect the position of 2820, and target around 2945;
2. If the price fluctuates around 2940 in the early trading, then you can directly go long in the European trading and look at the upward trend, protect 5 points, and target around the previous high of 2956;
3. If the upward trend continues in the early trading, short at 2956 and look for a retracement, protect 5 points, and target 2940;
4. If the price falls below 2920 in the European trading, then adjust the thinking to rebound and short, and analyze this in the future market.

XAUUSD Today's strategyThe Trump administration's capricious trade policy has triggered market concerns about global economic growth, opening a new front in the global trade war, leading to increased financial marekt uncertainty, investors' risk aversion is high, and they have put money into gold, driving gold prices up.
The world continues to increase its gold reserves with relatively large efforts, providing a solid bottom support for the gold price. Data from SPDR Gold Trust, the world's largest gold ETF, shows that its gold holdings in February were at the highest level since 2023. From February 27 to March 13, the holdings also increased. The strong demand for gold investment has driven up the gold price.
BUY:2965-2975
SL:2960
TP:2995-3005
We will share various trading signals every day. Fans who follow us can get high returns every day. If you want stable profits, you can contact me.

XAUUSD buy-and-profit trading signalGold news analysis: The latest data released on Thursday (March 13) showed that the US producer price index stagnated due to falling service costs, and the number of initial claims in the United States fell slightly, still close to pre-epidemic levels. At the same time, driven by demand for safe-haven assets due to tariff concerns and US inflation reports that reinforced expectations of future rate cuts, gold prices approached historical highs but failed to break through. As of press time, spot gold rose 0.5% to $2,946.68 per ounce. The number of initial jobless claims in the United States fell last week, but the government's sharp spending cuts and escalating trade wars threaten the stability of the labor market. The U.S. Department of Labor reported on Thursday that the number of initial jobless claims fell by 2,000 to 220,000 after seasonal adjustment in the week ending March 8. Economists surveyed by the agency had previously expected the number of initial jobless claims to be 225,000 last week. In late February, the number of applications for unemployment benefits soared due to seasonal fluctuations around the winter blizzard and the President's Day holiday, which made it difficult to adjust the data. Although the labor market remains solid, the Trump administration's policies pose downside risks.
Gold's 1-hour moving average is still a golden cross with upward bullish divergence. After breaking through the box and oscillating, gold continued to rise in the morning today and has basically stabilized at the 2930 line. Gold's retracement to 2930 is an opportunity to buy on dips. Gold can buy more first when it retraces to 2933 in the afternoon. If gold does not fall below 2930 again, then gold bulls will have further momentum to rise. Gold bulls are now ready to go and are expected to be even better. In the end, gold bulls have the upper hand in the oscillation, so follow the pace of the bulls. Whether gold can break through the historical high again, we will wait and see! Overall, recommends that the short-term operation of gold today is mainly long on pullbacks and short on rebounds. The short-term focus on the upper side is the resistance of 2985-2990, and the short-term focus on the lower side is the support of 2938-2928.
Trading is risky, so control your position reasonably. If you don't know when to enter the market, please follow the real-time signal announcement of my trading center or leave me a message, so that you can get rid of trading problems and realize profits as soon as possible. PEPPERSTONE:XAUUSD OANDA:XAUUSD CAPITALCOM:GOLD TVC:GOLD FOREXCOM:XAUUSD

Gold Breaks Out: Is a New All-Time High on the Horizon?Finally, after a week of range-bound trading and a false downside breakout, Gold has found direction and surged to the upside.
As expected, the inflation data served as the catalyst. With the reported figure coming in lower than anticipated, traders are now pricing in potential rate cuts.
Technically, as mentioned, the price broke above the 2930 resistance level and reached a high at 2947 just shy of the all-time high.
Currently, Gold is undergoing a normal correction, which should present traders with an opportunity to buy at lower levels. The ideal buy zone is between 2920 and 2930, with the bullish outlook negated if the price falls back into the previous range.
In terms of targets, the old ATH acts as resistance, but I wouldn’t be surprised if Gold pushes higher and sets a new record above the 2960 zone.
Disclosure: I am part of Trade Nation's Influencer program and receive a monthly fee for using their TradingView charts in my analyses and educational articles.

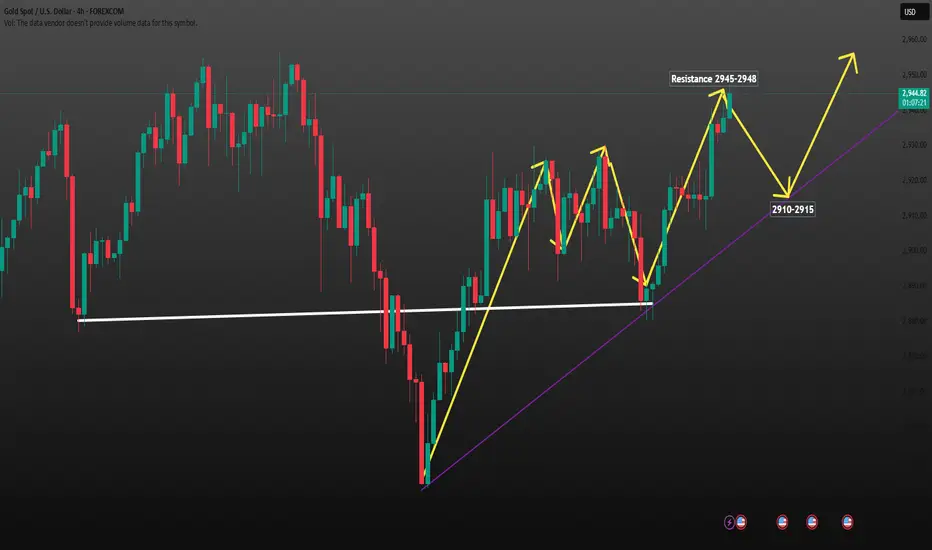
How to continue to short (2)As in my last analysis, currently XAUUSDXAUUSD is about to hit that 2945-2948
Operation policy reference:
Short Position Strategy
1:XAUUSD sell@2945-2948 20%Transaction of funds , tp:2930-2920-2910
2:XAUUSD Buy@2910-2915 20%Transaction of funds , tp:2930-2945-2955
The Signals have timeliness , if you also need to get accurate signals every day,follow the link below to get my daily strategy updates
If your account is still in the red, you need to pay attention to whether the resistance is valid. If the resistance is valid, there may be a decline. You can close your order on the decline and trade in the right direction again
Gold Top Trading SignalsThe first definition of trend is continuity. So if the market turns bearish, then it will continue to fall today. It is best to break below 2880 to be a bearish trend. If it rebounds during the day, it is still a shock. As long as the low point of 2880 is not broken, gold has just changed to a shock range. There is little point in being bearish, because the position of 2880 itself is also a support.
There is also a key support of 618 golden ratio at 2870 and a strong support at 2860. If these are broken, it will be difficult to hold the previous low of 2832, and there may be further declines. Therefore, gold will not go straight up and down here at present, and it is more likely to run in a volatile and bearish market, accumulating upward momentum before rising.
Because, from an overall perspective, the current position of gold is where it rebounded after a sharp rise in the previous period. It is not appropriate to be overly bullish or overly bearish on gold at the moment. Let it move for a while, and it will naturally come out in time. We need to be more patient.
For today, we can first see the European session continue to fall, focusing on the pressure at the 2900 line. The watershed is at 2910, and the support below is at 2880-2870, with strong support at 2860. If the rebound in the European session is too strong, then it will still be volatile.
In terms of trading, gold still fluctuated sideways within the range yesterday. We took a cautious wait-and-see attitude. It is not easy to act rashly when the direction is unclear, not to mention that it is still running in the middle of the range. Therefore, we waited until the evening to go short at 2905, held overnight, and took profit at 2884 this morning, earning 21 US dollars.

Gold Top Analysis StrategyGold, yesterday the bears finally broke the recent range of shocks, and stopped after touching the lowest level of 80, and rebounded again after opening in the morning, touching the 00 position, and this position is also the effective point of the previous top and bottom conversion, which was also mentioned in the previous period. Once this position is broken, we will still choose to follow up and look at gold. At present, it continues to rebound near this position, which is also an ideal point for us to continue to arrange short orders. From the daily line, the current big Yinxian pattern has broken down, and the short-term moving average has reversed to form a suppression system, and the moving average position is concentrated above. The middle track position gives suppression, while the support below is maintained at yesterday's point 80, which is basically equivalent to the previous rising position. Since the bears have already formed a downward break, we still choose to follow up the short order in the short term and wait for the second pullback. We can directly short gold near 98-99 during the day. This position is also the key pressure point of the daily line, and the target is around 80-70. If the European session continues to be weak, then the US session can continue to short, and if it stands above 00 for a while, you can consider withdrawing and exiting, and it is very likely to rise again.
Gold is shorted at around 98-99 during the day, with a target of around 80-70, and a stop loss of 0.55
