Xauusddaily


XAUUSD Bullish speculationExpecting a bullish movement after the retracement is done and the bearish flag is broken OR we might shoot straight up, price action will tell.

XAUUSD - Needs to test trend line again2 importants lines,
- Horizontal resistance
- Trend line
Both of them has been working for years, difficult to break them,
I'm waiting move through the trend line

GOLD DAILY 09/21/2018Gold still moves above the pivot and looks to continue the pattern by forming the 3rd wave, invalid if the price breaks below 1200, a big chance of a break up, completing the wave (E) in the weekly movement.
Daily Pivot:
R4 1227.83
R3 1220.43
R2 1213.03
R1 1210.26
Pivot 1205.63
S1 1202.86
S2 1198.23
S3 1190.83
S4 1183.43
Option :
-Open long positions if the price does not break down the first support
-TP at the first or second daily daily resistance
-SL first daily support or previous swing low
-Wait for confirmation to open a position
Follow, thumbs up, and share for updates every day

GOLD DAILY 09/20/2018Gold still moves above the pivot and looks to continue the pattern by forming the 3rd wave, a big chance to break up, finish the wave (E) in the weekly movement.
Daily Pivot:
R4 1227.31
R3 1219.11
R2 1210.91
R1 1207.43
Pivot 1202.71
S1 1199.23
S2 1194.51
S3 1186.31
S4 1178.11
Option :
-Open long positions
-TP at the first and second daily daily resistance
-SL previous pivot or swing low support
-Wait for confirmation to open a position
Follow, thumbs up, and share for updates every day

GOLD DAILY 09/18/2018Gold still looks moving in the pattern formed, and moves in the daily pivot area for today. Today if the price does not break the pattern by breaking below the first daily support ($ 1194.03 / oz) there is a good chance the price will move to the first daily resistance area ($ 1206.43 / oz).
Daily Pivot:
R4 1236.66
R3 1224.26
R2 1211.86
R1 1206.43
Pivot 1199.46
S1 1194.03
S2 1187.06
S3 1174.66
S4 1162.26
Option :
-Open long positions if the price does not break below the first daily support
-TP at the first daily resistance
-SL first daily support or previous swing low
-Wait for confirmation to open a position
Follow, thumbs up, and share for updates every day

GOLD DAILY 09/17/2018Gold closes below the daily pivot for today, the RSI indicator is already in the oversold area and the price seems to start losing momentum. The chance is that if the price does not break the first daily support, the price will move back up to the pivot area.
Daily Pivot:
R4 1246.30
R3 1230.40
R2 1214.50
R1 1204.40
Pivot 1198.60
S1 1188.50
S2 1182.70
S3 1166.80
S4 1150.89
Option :
-Open long positions if the price does not break below the first daily support
-TP on a daily pivot
-SL first daily support or previous swing low
-Wait for confirmation to open a position
Follow, thumbs up, and share for updates every day

GOLD DAILY 09/14/2018Gold moved again in the pivot area after having broken down the daily pivot for today. There are two possibilities, if 5th wave has finished in yesterday's hike then the chances are bearish, if it turns out yesterday's hike is a continuation of the 3rd wave then the chances are still bullish. Since divergence appears then the chances are greater in the first possibility, conrfirm if it breaks down the pivot.
Daily Pivot:
R4 1242.65
R3 1230.00
R2 1217.35
R1 1209.40
Pivot 1204.70
S1 1196.75
S2 1192.05
S3 1179.39
S4 1166.74
First option:
-Open long positions if the price does not break below the daily pivot
-TP at the first daily resistance
-SL pivot daily or previous swing low
-Wait for confirmation to open a position
Second option:
-Open short positions if the price breaks daily pivot
-TP at the first daily support
-SL on the previous pivot or previous swing high
-Wait for confirmation before opening a position
Follow, thumbs up, and share for updates every day

GOLD DAILY 09/11/2018Gold is still consolidating to form a triangle pattern and moving in the daily pivot area.
Daily Pivot:
R4 1216.93
R3 1209.63
R2 1202.33
R1 1198.76
Pivot 1195.03
S1 1191.46
S2 1187.73
S3 1180.43
S4 1173.13
First option:
-Open long positions when the price breaks up the triangle
-TP at the first daily resistance
-SL can be placed in the first daily support or previous swing low
-Wait for confirmation to open a position
Second option:
-Open short positions if the price breaks down the triangle
-TP at the second daily support
-SL on the previous pivot or swing high
-Wait for confirmation to open a position

GOLD DAILY 09/07/2018Gold moves in the pivot area for today after yesterday having broken R2 but still back down. wich is the price breaks down the pivot down there is a chance to continue the pattern, but if the price breaks the previous high then the chance to continue move up.
Prices now have formed a bearish candlestick.
Daily Pivot:
R4 1235.23
R3 1223.78
R2 1212.33
R1 1206.26
Pivot 1200.88
S1 1194.81
S2 1189.43
S3 1177.98
S4 1166.53
Option:
-Open short positions
-TP1 at the first daily support (S1)
-TP2 at the second daily support (S2)
-Economic data today will add to volatility, there is a chance that prices will pass through the second daily support.
-SL can be placed on the previous swing high pivot
-Wait for confirmation to open a position

GOLD DAILY 10/09/2018Gold consolidates to form a triangle pattern, looks like there is a bullish exaggerated divergence even though the pattern forms a descending triangle, if you look at the chance for weekly movement then the chance for daily if the price moves bullish then the chance it move to the first daily resistance area.
and if bearish then the chance it will move to the second daily support.
Daily Pivot:
R4 1228.61
R3 1218.31
R2 1208.01
R1 1202.23
Pivot 1197.71
S1 1191.93
S2 1187.41
S3 1177.11
S4 1166.81
First option:
-Open long positions when the price breaks up the triangle
-TP1 is a few points above the pivot
-TP2 at the first daily resistance (R1)
-SL can be placed in the first daily support or previous swing low
-Wait for confirmation to open a position
Second option:
-Open short positions if the price breaks down the triangle
-TP at the second daily support
-SL on the previous pivot or swing high
-Wait for confirmation to open a position

GOLD DAILY 09/05/2018Yesterday Gold moved down and closed below the daily pivot for today. Price is already in the first weekly support area ($ 1192.70 / oz) and is at the channel support line that is formed. Looking at the daily price movements in the past week there is a chance the price moves to form XABCD or maybe three drives pattern. Chances are the price will move back up to the weekly pivot area ($ 1203 / oz).
Option:
-Open long positions if the price does not break the channel or break the first daily support
-TP1 on daily pivots
-TP2 at the first daily resistance
-SL can be placed in the first daily support or previous swing low
-Wait for confirmation to open a position

GOLD DAILY 09/06/2018Prices are moving up and still in the channel, the price is at the first daily resistance, 200 MA on TF 1H chart is in the second daily resistance area, if price continues three drives pattern then there is a good chance it will turn down at the second daily resistance, invalid if price breaks up out of the channel.
Daily Pivot:
R4 1218.20
R3 1210.50
R2 1202.80
R1 1199.50
Pivot 1195.10
S1 1191.80
S2 1187.40
S3 1179.70
S4 1172.00
Option:
-Open short positions if price does not break the channel or break the second daily resistance
-TP1 on daily pivots
-TP2 at the first daily support (S1)
-SL can be placed at the second daily resistance or previous swing high
-Wait for confirmation to open a position

GOLD DAILY 09/03/2018Gold closes below the daily pivot for today, and forms a lower low and lower high, the chance of a price increase will continue to move lower.
First Option:
-Open short positions below the first daily resistance ($ 1206.72 / oz) if the price rises above the pivot but cannot pass and hold above the first daily resistance.
-TP1 on the daily pivot ($ 1202.46 / oz)
-TP2 at the first daily support ($ 1196 / oz) if the price moves past the pivot.
-SL at a few points above the first daily resistance or on previous swing high.
-Wait for confirmation to open a position
Second Option:
-Open short positions below the daily pivot ($ 1202 / oz) if the price can't go above and stay above the daily pivot.
-TP1 at the first daily support ($ 1196 / oz)
-TP2 at the second daily support ($ 1191 / oz)
-Wait for confirmation to open a position

GOLD DAILY OPPORTUNITY 09/04/2018today opened slightly above pivot, and still moves in the daily pivot area for today. The price movement looks to be consolidating and forming a triangle pattern, wait for the price to break out the pattern to open a position.
First option:
-Open long positions if the price breaks up
-TP1 at the first daily resistance
-TP2 at the second daily resistance
-SL on pivot or a few points below it
-Wait for confirmation to open a position
Second Option:
-Open short positions if the price breaks down the pattern
-TP1 at the first daily support
-TP2 at the second daily support
-SL on pivot or a few points above it
-Wait for confirmation to open a position

GOLD DAILY 31/08/2018Gold starts moving below the pivot and breaks suppot on trading yesterday, but still looks bullish divergence and the price is still in the previous demand zone.
First option:
-Open long positions if the price breaks and moves above the pivot
-TP 1 at the first daily resistance
-TP 2 to the second daily resistance
-SL in pivot or in the last swing low.
-Wait for confirmation to open a position
Second Option:
-Open short positions if the price goes to the second daily resistance
-TP 1 at the first daily resistance
-TP 2 is the first daily support if the price breaks down the pivot
-SL at the second daily resistance or at the last swing high
-Wait for confirmation to open a position
Third option:
-Open short positions if the price turns out to be unable to break and stay above the pivot
-TP 1 is the first daily support
-TP 2 is the second daily support
-SL in the pivot or in the last swing high
-Wait for confirmation to open a position

GOLD DAILY 08/29/2018Prices have moved below the daily pivot but are still stuck and there is still a chance to continue the channel formed.
First Option:
-Open a Buy position if the price moves up again above the pivot.
-TP 1 at the first daily resistance
-TP 2 at the second daily resistance
-SL can be placed below the pivot or at the last low ($ 1199 / oz)
-Wait for confirmation to open a position
Second Option:
-Open a Sell position if the price breaks low and exits the channel ($ 1195 / oz)
-TP is the second daily support
-SL can be placed above the first daily support or some points in it
-Wait for confirmation to open a position

GOLD DAILY 08/28/2018Prices are already in the supply zone and there is a divergence between prices and RSI
Open short positions if the price moves below the daily pivot:
-TP 1 first daily support
-TP 2 second daily support
-SL can be placed on the last swing high or a few points above the pivot.
-Wait for confirmation to open a position

XAU/USD - Decision Time - Prom or Hospital?XAU/USD (GOLD) is about to make a crucial decision.
If the yearly support trend-line is broken, then I will loose all my faith in this precious metal until $1100.
However, it it manages to bounce in a corrective manner, then I will be happy to look at it with moist eyes later on.

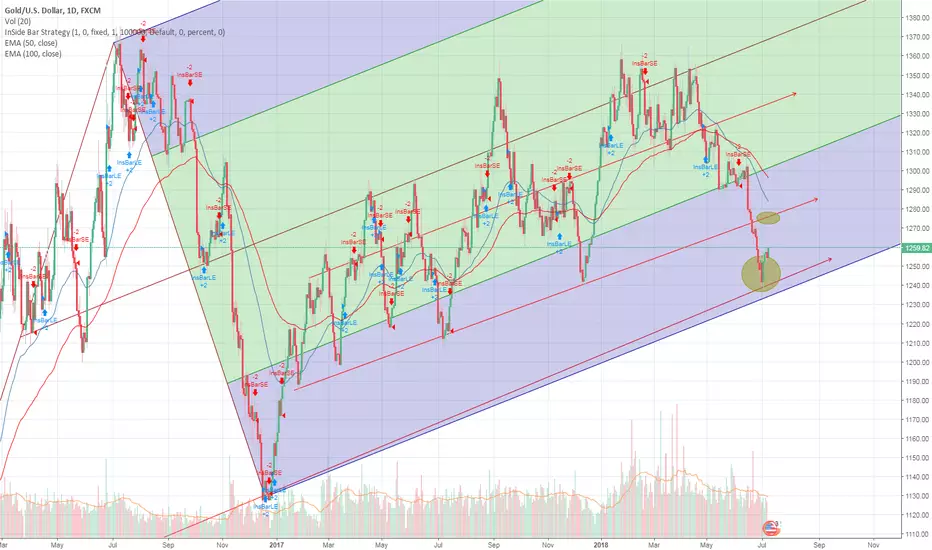
GOLD Bulls Taking Over (DAILY)GOLD bulls seem to be taking over, as shown by the bullish engulfing candle and increase in buying momentum. We also have confirmation of the trend line and bottom of the pitchfork area acting as support. Best target looks to be the bottom of the channel that gold broke out of before, which might act as resistance.
XAU/USD Complete Price RangeXAU/USD Complete Price Range then will sideways or make some correction to contineu bearish trend
Watch and wait price action in vital price & area
Write trading planing and exit planing to backup your trade if your analysis going wrong
Always write exit planing first before you go in market calculate the risk according to which you are able to receive it
limit your losses and let gains run

GOLD - Fourteen hundredGold had every chance to tag to the purple trendline while the dollar rallied.
That never happened though. Gold's intermediate corrections was getting shorter and shorter during the last year. The reason is the central banks' money printing since 2009. I think that money landed in the stock market first and in the last year it was migrating into the precious metal sector.
Notice how shallow was the gold drop despite the dollar rally :
This long call is based on the Heikin Ashi daily chart : we are printing the 3rd green candle with MACD crossing over and RSI 6 intermediate correction signals.
A daily close above 1358-1360 will signal the breakout and a clear path to 1400.
First target is 1400 in the next 3 weeks.
Levels to watch:
20 EMA
Blue trendline
100 SMA
1360 Level
