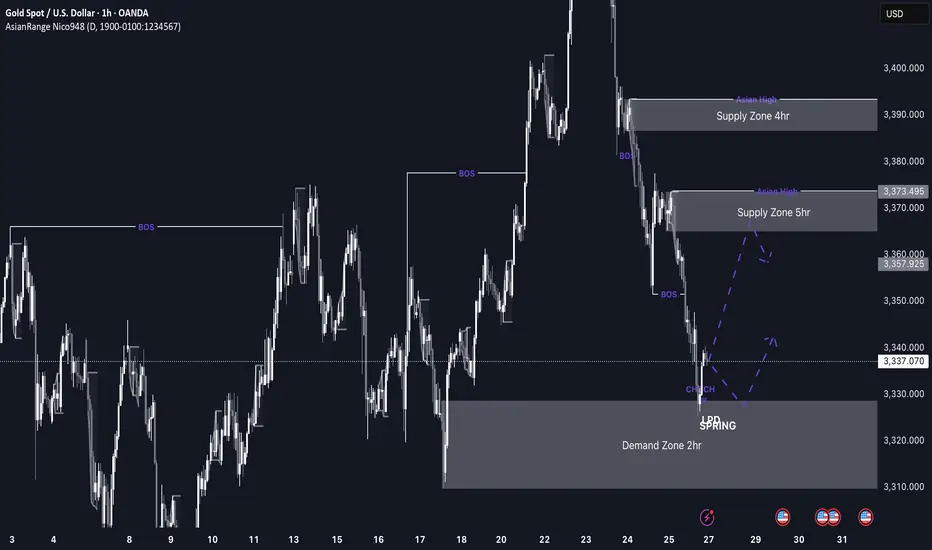
GOLD imminent possible buys up to 3,370 This week’s price action on GOLD is shaping up to be very interesting. After weeks of sustained bearish pressure, price has now entered a discounted 2hr demand zone sitting at a swing low, which makes it a high-probability area for a bullish reaction, especially as markets open.
If we do get the expected bullish reaction from this level, I’ll be watching the 3,370 region, where there’s a clean 5hr supply zone. If price reaches that level, I’ll be looking out for distribution and a potential short setup from there.
Confluences for GOLD Longs:
Price has been very bearish recently, so a retracement is expected
Currently sitting in a discounted 2hr demand zone
The overall long-term trend is still bullish
Early signs of accumulation and bullish reaction from this zone
P.S. If price fails to hold this current demand zone and breaks lower, then bearish momentum may continue. In that case, I’ll look for new long opportunities around 3,290 where a deeper demand zone exists.
Xauusdforecast
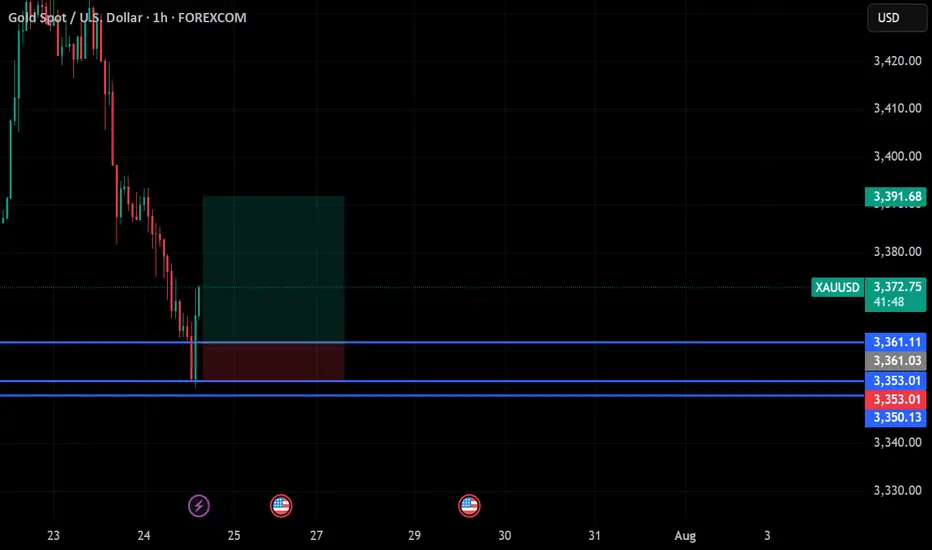
gold on buy reverse#XAUUSD price we await a little retrace below 3361 to continue bullish. Market price can follow
Entry at 3361, target 3391, stop loss 3353.
Bearish can follow depending on if tariff is lower.
LONG Setup - Smart Money Bias (15m)
## 🟢 LONG Setup - Smart Money Bias (15m)
- **Pair**: XAU/USD (Gold)
- **Timeframe**: 15m
- **Entry Zone**: Around **3390.050**
- **Stop Loss (SL)**: **3377.200**
- **Take Profit Targets**:
- **TP1**: 3402.800
- **TP2**: 3410.500
- **TP3**: 3418.800
---
### 📌 Confluences:
- Demand zone respected and tapped.
- Bullish reaction from POI (Point of Interest).
- FVG (Fair Value Gap) filled and reversal initiated.
- BOS + CHoCH in lower timeframe confirmed.
- Forecast projection aligns with upside inefficiency.
---
### 🧠 Strategy:
- Smart Money Concepts (SMC)
- Liquidity Sweep below demand
- Risk-Reward Ratio: ~1:2.3
🚨 **Note**: Trade with caution around US market open hours (volatility expected).
📌 Disclaimer & Reflection
Before we dive into today's mark down, I want to take a moment to address the previous signal that hit stop loss. As traders, we must acknowledge that losses are part of the process—no matter how solid our analysis may be. I take full responsibility for the outcome, and I appreciate the trust and patience of this community.
Every stop is a reminder that perfection doesn't exist in the markets—only probabilities. What matters most is how we adapt, learn, and continue to evolve.
Let's move forward with clarity and discipline.

gold on bullish#XAUUSD price expect bullish range between 3430, breakout there will take the price above 3450-3453.
Entry on buy 3430, target 3453, stop loss 3419.
Below 3416 holds a strong bearish continuation, target 3400.

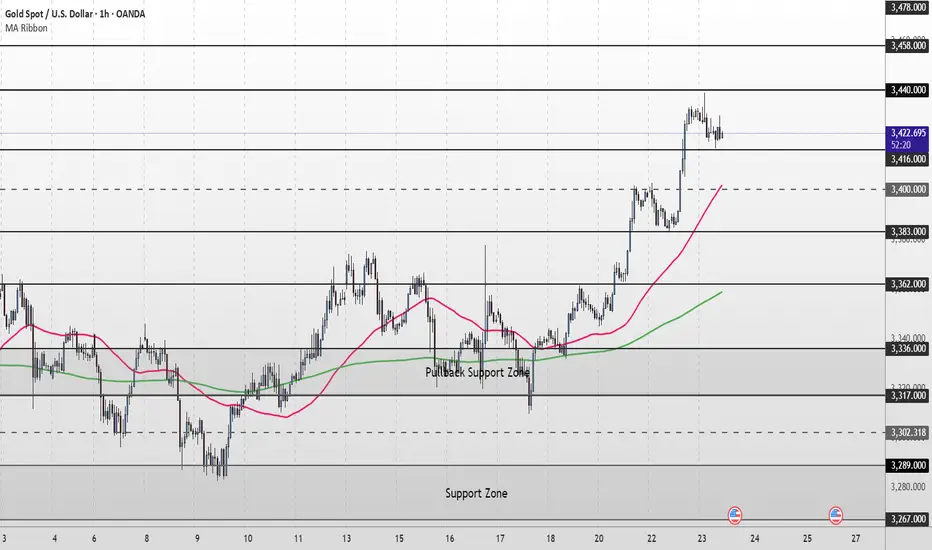
XAU/USD Intraday Plan | Support & Resistance to WatchGold has continued its rally, breaking through the 3,416 resistance and pushing into the next upside zone.
Price is now trading around 3,421, just below the 3,440 resistance cluster.
The structure remains bullish with price holding firmly above both the 50MA and 200MA, which are acting as dynamic support.
A confirmed break and hold above 3,440 would open the path toward 3,458 and potentially the higher‑timeframe target at 3,478 if momentum extends.
If price fails to sustain above 3,416–3,440 and begins to fade, watch the initial pullback toward 3,400.
A deeper move below that would shift focus to 3,383 - 3,362 and then the Pullback Support Zone.
Failure to hold there could expose price to the lower Support Zone if bearish pressure builds.
📌 Key Levels to Watch
Resistance:
‣ 3,440
‣ 3,458
‣ 3,478
Support:
‣ 3,416
‣ 3,400
‣ 3,383
‣ 3,362
‣ 3,336
🔎 Fundamental Focus
⚠️Not much on the calendar today. Still, manage your risk and stay prepared for any unexpected volatility.
GOLD: Price Made A New HHLooking to buy gold, market structure is bullish on the H1 and H4. I went over 2 different scenarios in the video...
1. Pullback Entry (Preferred)
🟢Entry Zone: 3365–3380
TP1: 3432
TP2: 3450
TP3: 3475–3500 (extended target if momentum holds)
2. Breakout Buy (Aggressive)
Trigger: M15 breaks and closes above 3405–3410 with strong displacement.
Entry: Retest of breakout zone at 3402–3405
Same Targets
Don't forget to set those price alerts!

gold still strong on buyinggold still taking the bullish stand, possible we expect price to keep buying if the H1 closes above 3405 area, then followed by M30 close below 3395 for selling.
the bullish is still strong depending on how the H1 react

gold on bulish reverse#XAUUSD await multiple breakout above 3389, possible target will reach new Day high 3305.
Entry at 3389 on 2 times breakout, target 3405 stop loss 3381.
Below 3380. on m15 closure will drop the price

XAU/USD Intraday Plan | Support & Resistance to WatchGold broke above the 3,362 resistance and extended its rally into the 3,400 resistance zone, currently trading around 3,386. Price remains comfortably above both the 50MA and 200MA, which are sloping upward and acting as dynamic support—keeping short‑term structure bullish.
A confirmed break and hold above 3,400 would open the path toward the next upside targets at 3,416 and 3,440, with 3,458 as a higher‑timeframe extension if momentum continues.
If price fails to sustain above 3,383–3,400 and begins to fade, watch the initial pullback toward 3,362.
A deeper move below that would shift focus to the Pullback Support Zone.
Failure to hold there could expose price to the Support Zone and potentially the HTF Support Zone if bearish pressure builds.
📌 Key Levels to Watch
Resistance:
3,383 ‣ 3,400 ‣ 3,416 ‣ 3,440
Support:
3,362 ‣ 3,336 ‣ 3,317 ‣ 3,302 ‣ 3,289
🔎 Fundamental Focus –
📌 Fed Chair Powell Speaks – key event that can move USD and gold sharply.

XAUUSD Analysis – Smart Money Perspective XAUUSD Analysis – Smart Money Perspective
🧠 Market Structure & BOS (Break of Structure):
The chart clearly shows multiple Break of Structure (BOS), confirming bullish intent.
After the final BOS around 3,370, price aggressively broke above resistance, forming a new high at 3,397.
This indicates bullish market momentum backed by strong demand.
🔎 Key Zones Identified:
🔼 Strong Resistance (3,390 – 3,400 Zone)
This level has been tested and now shows potential exhaustion, possibly trapping late buyers.
Price currently rejecting this zone with a bearish reaction.
🔽 Support Zone (3,300 – 3,320)
Prior consolidation and BOS originate from here.
Strong bullish OB and demand lie here—key area for future long setups.
📉 Expected Short-Term Move:
The projection arrow indicates a potential retracement toward 3,360, a previous BOS + potential FVG area.
This aligns with Smart Money's tendency to rebalance inefficiencies before continuation.
🔺 Volume Analysis (VRVP - Volume Profile):
Notice how high volume nodes align with the support and resistance zones.
Price is currently sitting in a low-volume gap, supporting the idea of a retracement to a more balanced area.
⚡ Momentum Shift Signal:
The steep angle of the last move up suggests possible liquidity grab above resistance.
Expectation: Price may dip to mitigate demand or OB before resuming the uptrend.
✅ Conclusion:
This chart illustrates a textbook SMC scenario:
Bullish BOS confirms structure shift.
Liquidity sweep above resistance may lead to a retracement.
3,360 is a key price point to watch for FVG fills or bullish continuation.

XAUUSD Analysis todayHello traders, this is a complete multiple timeframe analysis of this pair. We see could find significant trading opportunities as per analysis upon price action confirmation we may take this trade. Smash the like button if you find value in this analysis and drop a comment if you have any questions or let me know which pair to cover in my next analysis.

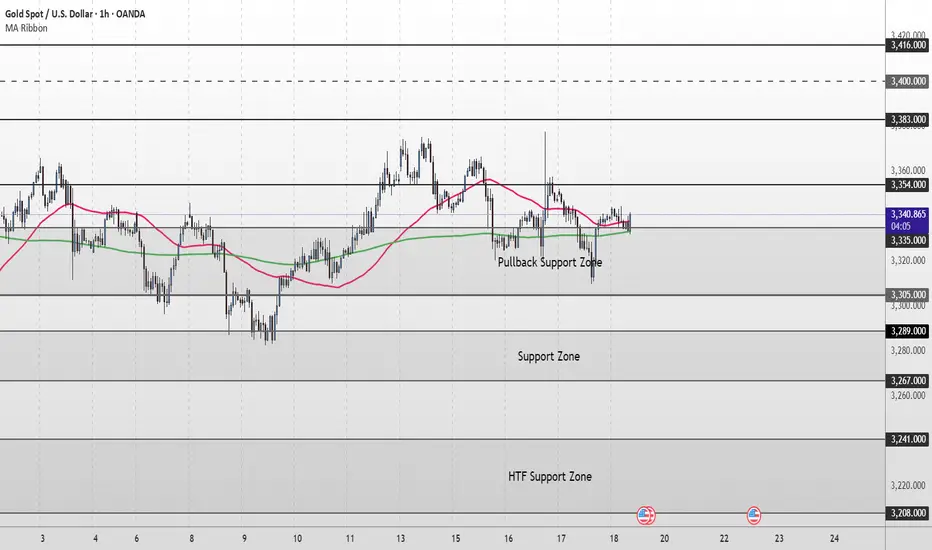
Gold Short Term Outlook Gold has held above the Pullback Support Zone (3,335–3,305) after yesterday’s volatility, with buyers stepping in to defend the zone.
Price is now trading around 3,338, caught between the 50MA and the 200MA.
Despite the recent dip, the structure remains supportive as long as price holds above 3,335.
A clean break and hold above 3,354 would confirm renewed bullish momentum, opening the path toward 3,383 and 3,400, with 3,416 as a higher‑timeframe target.
If price fails to clear 3,354 and turns lower again, watch for signs of exhaustion back into the Pullback Support Zone (3,335–3,305).
A decisive break below 3,305 would shift focus to the Support Zone (3,289–3,267), with further downside exposing the HTF Support Zone (3,241–3,208).
📌 Key Levels to Watch
Resistance:
‣ 3,354 ‣ 3,383 ‣ 3,400 ‣ 3,416
Support:
‣ 3,335 ‣ 3,305 ‣ 3,289 ‣ 3,267 ‣ 3,241
🔎Fundamental Focus
📌 4:00pm: UoM Sentiment & Inflation Expectations – can spark sharp USD/gold moves.
➡️ Expect volatility around releases.
Expectations On GoldPEPPERSTONE:XAUUSD Looking at the daily Range, The market has reached the equilibrium level, is that a sign to go short? no, we could still see a drive to the upper side, but ultimately, the relative equal lows which are close to 3,245.00 big figure should likely be the draw.
I would love to see a drive below the 3,282.00 mark for perfect show to prove the obvious move below the 3,245.00, or seeing a consecutive break below each previous days low would also confirm the directive.
Seeing higher prices would of course negate this analysis, seeing a run into the 3,375.00 big figure yesterday makes me skeptical as this has also left some area of relatively equal highs, so I would give in to the idea of higher prices at least to that level to see what would like occur, but I strongly doubt that this would be the scenerio.
Generally, I am bearish on Gold till I see a run below that 3,245.00 big figure or prices closer to that level.

gold on sell#XAUUSD await breakout below 3324 which holds sell continuation. Expected target is below 3305-3292.
Below 3324 will drop the price, target 3305-3292, stop loss 3337.
Fundamental can change price back to Bullish. So we watch closely.

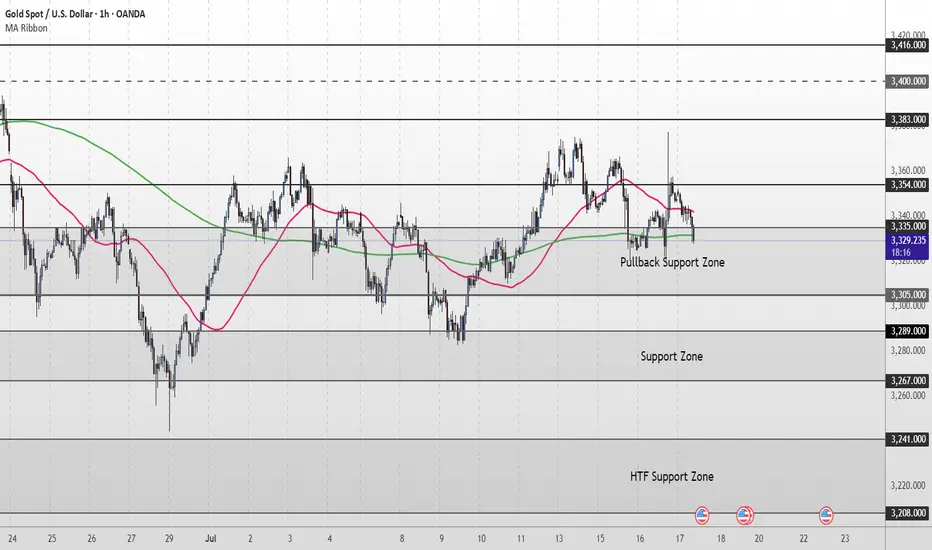
Gold Short Term OutlookYesterday, gold staged a strong rally, pushing up toward 3,377, which was followed by a strong rejection. Price has pulled back sharply and is now testing the Pullback Zone once again.
Currently trading around 3,329, price is caught between the 50MA overhead acting as dynamic resistance and the 200MA below offering dynamic support.
For the bullish structure to regain momentum, we need to see a clean break and hold back above 3,354. This would reopen the path toward 3,383 and 3,400, with 3,416 as a higher‑timeframe target.
If buyers fail to defend the Pullback Support Zone, and price breaks decisively below 3,305, attention shifts to the Support Zone (3,289–3,267). A deeper selloff could then expose the HTF Support Zone (3,241–3,208).
📌 Key Levels to Watch
Resistance:
‣ 3,354
‣ 3,383
‣ 3,400
‣ 3,416
Support:
‣ 3,335
‣ 3,305
‣ 3,289
‣ 3,267
‣ 3,241
🔎 Fundamental Focus – High‑Impact U.S. Data Today
A packed U.S. calendar could drive volatility:
📌Core Retail Sales m/m and Retail Sales m/m
📌Unemployment Claims
📌Philly Fed Manufacturing Index
These red‑folder releases can create sharp intraday swings.
Additionally, multiple FOMC member speeches later in the session could add headline‑driven moves.
GOLD 2H STRUCTURE ROADMAP – JULY 2025🧭 GOLD 2H STRUCTURE ROADMAP – JULY 2025
📉 Market Structure | 📊 Liquidity Zones | 🎯 Bearish Scenario
---
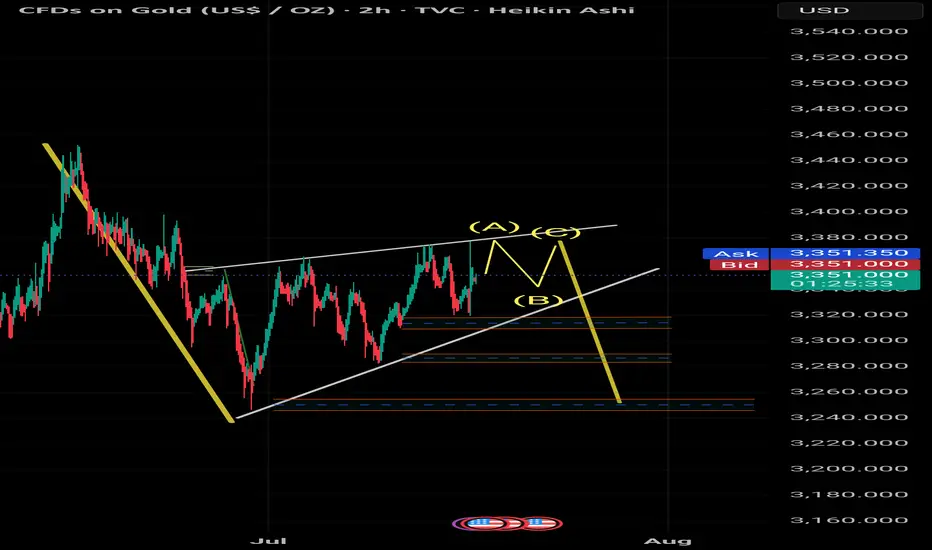
📌 🧱 Structure Analysis – Bigger Picture
The current macro structure on Gold is clearly bearish, confirmed by:
A sequence of Lower Highs (LH) and Lower Lows (LL)
Price respecting a descending channel / wedge structure
Failure to hold above key break-of-structure (BOS) zones on prior rallies
Recent rallies forming corrective patterns, not impulsive bullish structure
This indicates that smart money is distributing at higher levels and planning liquidity raids before final markdowns.
---
🔁 Wedge + ABC Trap Formation
The chart shows a classic bearish wedge (rising contraction pattern) with an embedded ABC correction, which can trap long-biased retail traders before reversal.
Wave (A): Short-term rejection at previous minor high
Wave (B): Shallow pullback to create illusion of strength
Wave (C): Final liquidity sweep above the wedge → Perfect trap zone
---
💧 Triple Liquidity Targets – Smart Money Blueprint
Smart money often targets liquidity in layers. Below are the three major zones:
1. 🔻 First Liquidity Pool (~$3,320 – $3,310):
Minor internal structure lows with previous BOS area
2. 🔻 Second Pool (~$3,285 – $3,275):
Strong liquidity cluster near order block formed after impulsive move
3. 🔻 Final Demand Zone (~$3,245 – $3,260):
Deep liquidity + unmitigated bullish OB = High Probability Reaction Zone
---
⚔️ Bias & Trading Insight
✅ Bias: Bearish unless price closes above $3,400 with strength
🚫 Avoid chasing longs during (B)-(C) unless clear breakout + volume
🧠 Patience pays — Wait for sweep of all three zones before any long-term bullish commitment
---
> 🧠 Precision Analysis by: Mohsen Mozafarinezhad
👑 Presented under: PERSIAUX KING — A Legacy of Persian Discipline in Markets
Gold Short Term OutlookGold has pulled back sharply from the 3,354 resistance but found support inside the Pullback Zone (3,335–3,3305 where buyers have stepped back in. Price is now attempting to reclaim ground, trading around 3,341, with the 50MA acting as dynamic resistance overhead and the 200MA as dynamic support.
For the bullish move to continue, we need to see a clean break and hold above 3,354. That would reopen the path toward 3,383 and 3,400, with 3,416 as the higher-timeframe target.
If price fails to clear 3,354 and rolls over again, watch the Pullback Zone (3,335–3,305) for signs of exhaustion. A break below 3,305 would shift focus to the deeper Support Zone (3,289 - 3,267) and potentially toward 3,241 - 3,208 if bearish pressure accelerates.
📌 Key Levels to Watch
Resistance:
‣ 3,354
‣ 3,383
‣ 3,400
‣ 3,416
Support:
‣ 3,335
‣ 3,305
‣ 3,289
‣ 3,267
‣ 3,241
🔎 Fundamental Focus – PPI Release Today
Today’s U.S. Producer Price Index (PPI) will be closely watched as a follow‑up to yesterday’s CPI data.
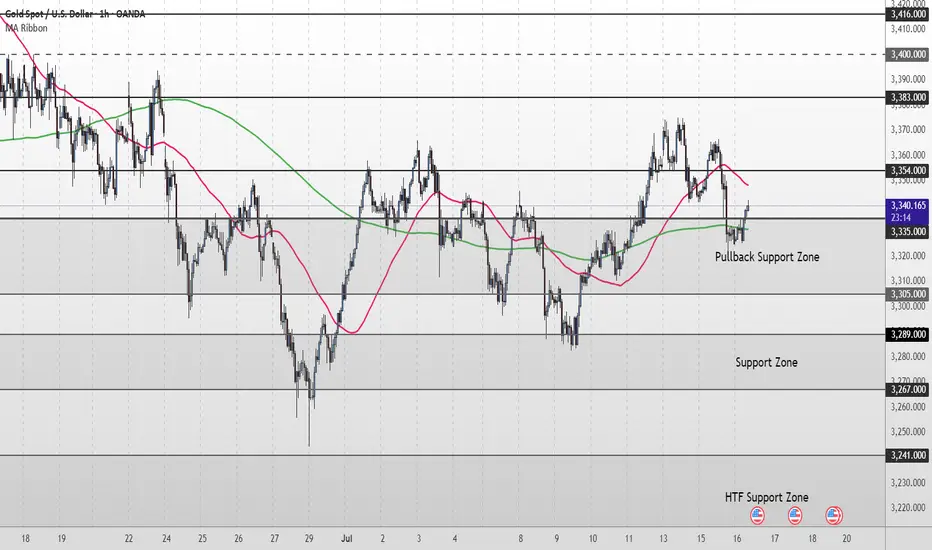
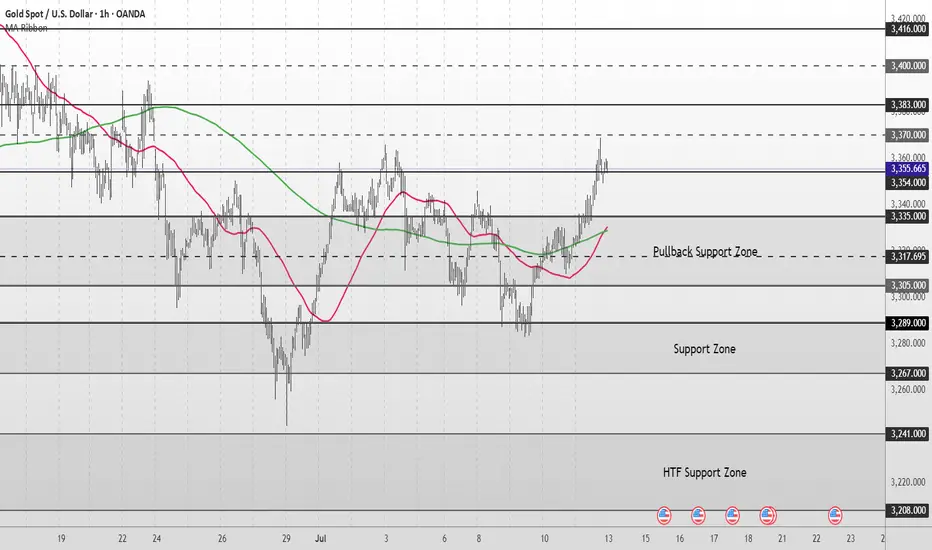
Gold Short Term OutlookGold has extended its recovery after holding above the Pullback Support Zone and is now trading around 3,359, attempting to build momentum toward higher resistance levels.
The structure remains bullish with price trading above both the 50MA and 200MA , which are starting to slope upward and act as dynamic support.
A confirmed break and hold above 3,354 would open the path toward the next resistance cluster at 3,383 and potentially 3,400, with 3,416 and 3,440 as higher-timeframe resistance targets.
If price fails to hold above 3,354 and begins to fade, watch the Pullback Support Zone (3,335–3,305) closely for signs of renewed buying interest.
A clean break below that zone would shift focus to the deeper Support Zone (3,289-3,267) and potentially the HTF Support Zone (3,241–3,208) if selling pressure builds.
📌 Key Levels to Watch
Resistance:
‣ 3,364
‣ 3,383
‣ 3,400
‣ 3,416
Support:
‣ 3,354
‣ 3,335
‣ 3,305
‣ 3,289
‣ 3,267
‣ 3,241
‣ 3,208
🔎 Fundamental Focus
All eyes are on today’s U.S. CPI release

Gold Medium to Short Term Outlook Gold has shifted into a bullish structure after reclaiming key technical levels.
The strong impulsive move from below $3,300 into the $3,354–$3,370 resistance area reflects renewed buying interest, likely driven by improving sentiment and shifting macroeconomic expectations.
If bulls maintain control and price breaks and holds above $3,354, we could see continuation toward $3,383 and $3,400, with $3,416 marking the next major higher-timeframe resistance. These levels will be critical in determining whether gold resumes a broader bullish trend or begins to stall into a deeper correction.
On the flip side, if gold begins to fade below $3,354, then the $3,335–$3,305 pullback support zone will be key for potential bullish re-entry attempts.
A sustained break below this area would invalidate the current bullish leg and expose the market to a deeper retracement toward $3,289–$3,267, with $3,241–$3,208 acting as the higher-timeframe support floor.
📌 Key Levels to Watch
Resistance
‣ $3,370
‣ $3,383
‣ $3,400
‣ $3,416
Support
‣ $3,335
‣ $3,305
‣ $3,289
‣ $3,267
‣ $3,241
‣ $3,208
🔎 Fundamental Focus
Multiple high-impact U.S. data releases this week, including CPI, PPI, Retail Sales, and Unemployment Claims.
Expect elevated volatility across sessions.
⚠️ Manage your risk around news times. Stay sharp.
XAUUSD Analysis todayHello traders, this is a complete multiple timeframe analysis of this pair. We see could find significant trading opportunities as per analysis upon price action confirmation we may take this trade. Smash the like button if you find value in this analysis and drop a comment if you have any questions or let me know which pair to cover in my next analysis.

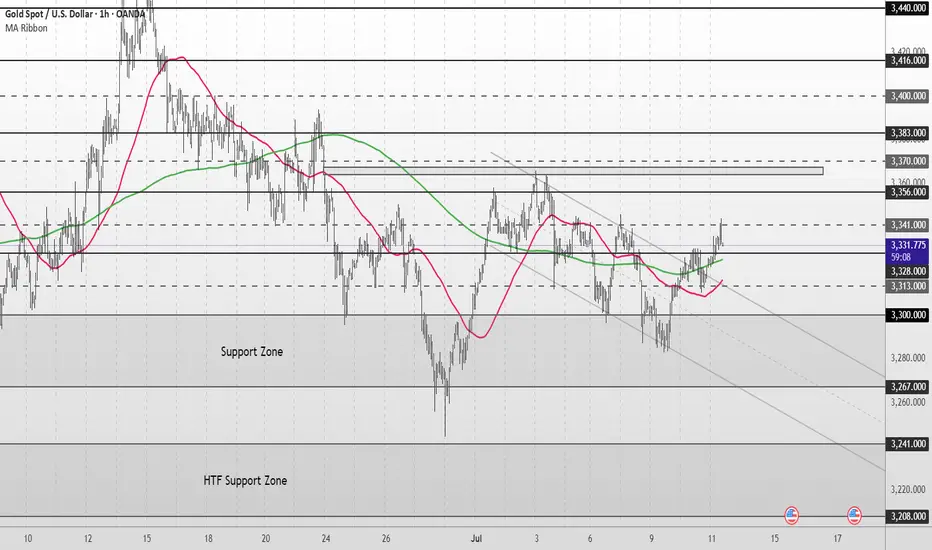
Gold Short Term OutlookGold has extended its recovery after reclaiming both the 50MA and 200MA, now trading just below the $3,341 resistance. Price has broken out of the short-term descending channel and is showing early signs of bullish continuation.
A confirmed break and hold above $3,341 would open the path toward the next resistance cluster at $3,356–$3,370, followed by $3,383.
If price rejects this resistance and pulls back, the $3,328–$3,313 area will be key to maintain the bullish structure. Below that, focus returns to the $3,300 level and the broader Support Zone.
📌 Key Levels to Watch
Resistance:
‣ $3,341
‣ $3,356
‣ $3,370
‣ $3,383
Support:
‣ $3,328
‣ $3,313
‣ $3,300
‣ $3,267
⚠️ It’s Friday! Stay sharp and manage your risk.
gold on sell#XAUUSD on retest, price on a third pattern which needs to correct below.
Firstly breakout below 3317, target 3310-3303, stop loss 3326
The manipulation in the market is strong, breakout above 3330 can not fully buy but reverse down below.

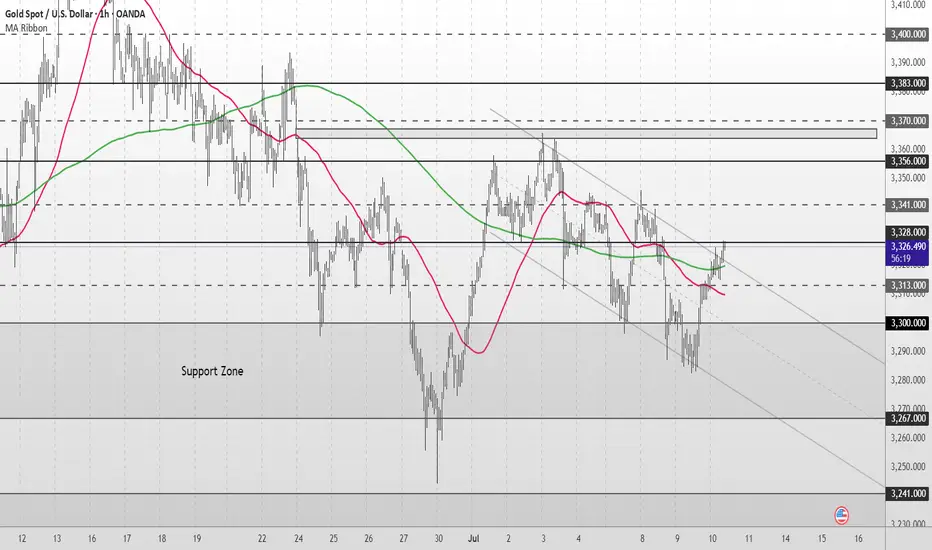
Gold Short Term OutlookGold continues its short-term recovery after bouncing from the Support Zone and reclaiming the $3,300 level. Price is now testing the $3,328 resistance zone, with both the 50MA and 200MA converging just below price.
A confirmed break and hold above $3,328 would open the door to higher resistance levels. However, failure to clear this zone could lead to a retest of the Support Zone. If that fails to hold, a deeper retracement toward the HTF Support Zone may follow.
📌 Key Levels to Watch
Resistance:
‣ $3,328
‣ $3,341
‣ $3,356
‣ $3,383
Support:
‣ $3,313
‣ $3,300
‣ $3,267
‣ $3,241
🔎 Fundamental Focus
All eyes on U.S. unemployment claims today
Expect volatility around the release – stay sharp.