XAUUSD GoldXAUUSD ( Gold / U.S Dollar )
Bullish Channel as an Corrective Pattern in Short Time Frame with the Breakout of Lower Trend Line and Retracement. We have a Break of Structure with Strong Divergence. It has completed " 1234 " Impulsive Waves
Xauusdforecast

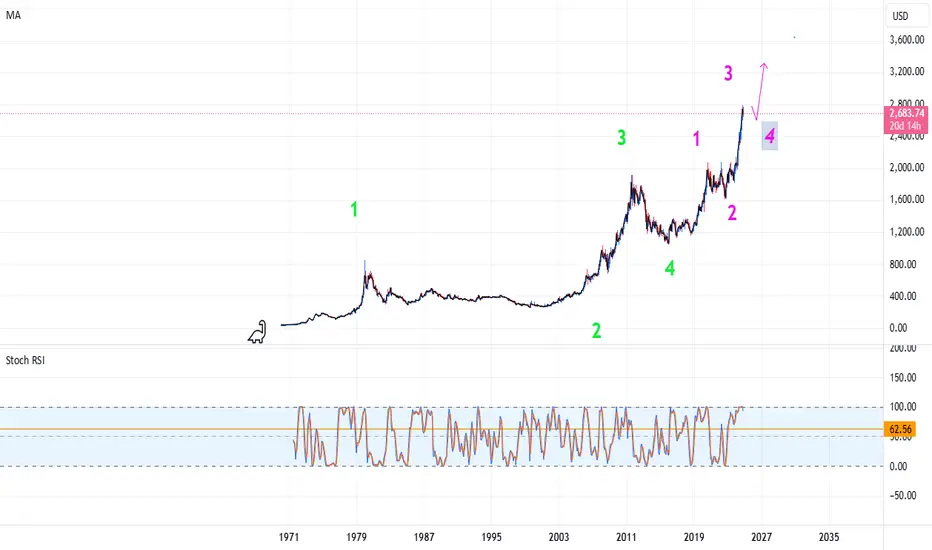
Where are we in Monthly timeframe in XAUUSD ?If this analysis be correct! its so important where is the end of 4TH wave (Purple)
XAUUSD XAUUSD ( Gold / U.S Dollar )
Completed " 125345 " Impulsive Waves
Break of Structure
RSI - Divergence
Bullish Channel as an Corrective Pattern in Short Time Frame with the Breakout of Lower Trend Line
Fibonacci Level - 78.60%

XAU/USD 05 November 2024 Intraday AnalysisH4 Analysis:
Analysis/bias remains the same as analysis dated 31 October 2024
-> Swing: Bullish.
-> Internal: Bullish.
Gold’s rally persists, driven by the Fed’s dovish stance and heightened geopolitical tensions, strengthening its safe-haven appeal.
Price has recently printed higher highs, bringing CHoCH positioning significantly closer to current price level. A bearish CHoCH has printed, signaling the first indication, though not a confirmation, of a potential bearish pullback phase initiation.
Price is now trading within an established internal range.
Intraday Expectation: Price is expected to continue bearish, potentially reacting at the H4 demand zone or the discount of the H4 internal 50% EQ before targeting the weak internal high.
We should however remain mindful that Daily TF is showing very early signs of bearish pullback phase initiation. Therefore, price could potentially print a bearish iBOS.
H4 Chart:
M15 Analysis:
-> Swing: Bullish.
-> Internal: Bearish.
As highlighted in yesterday's intraday analysis dated 04 November 2024, I mentioned that price was expected to continue targeting the weak internal low.
Price followed this expectation, reaching the weak internal low and printing a bearish iBOS.
Subsequently, price has printed a bullish CHoCH, indicating the initiation of a bullish pullback phase. Internal structure has also been confirmed.
Intraday Expectation: Price is expected to react at either premium of the 50% EQ or the M15 supply level before targeting weak internal low.
M15 Chart:

Gold Updateon lower timeframe we can see gold formed a descending trendline if it get broken and coose above 2745 we can enter a buy position with a stop loss 2730
Ood Luck
follow for more

XAUUSD GoldXAUUSD ( Gold / U.S Dollar )
Completed " 12345 " Impulsive Waves, " A " Corrective Waves and making its " B " Corrective Wave in a Consolidation in Short Time Frame. Strong Bullish Divergence in RSI. Need to wait until it Breaks and Retest its Extreme Point of Interest ( POI ) and Complete its Order Block

Gold UpdateThis update on gold is on a high timeframe
Their is 2 possibilities here but most probably it will be the red (sell/short) one
It can go to 2480 if it breaks the ascending trendline or it can go to 2818 if it breaks 2792
Trade safe pips and follow us for more

Gold UpdateThis update on gold is on a high timeframe
Their is 2 possibilities here but most probably it will be the red (sell/short) one
It can go to 2480 if it breaks the ascending trendline or it can go to 2818 if it breaks 2792
Trade safe pips and follow us for more

XAU/USD 4-8 November 2024 Weekly AnalysisWeekly Analysis:
Swing Structure: Bullish.
Internal Structure: Bullish.
Analysis/bias remains the same as last week's analysis dated 27 October 2024
Price has continued its surge, reaching new all-time highs with no signs yet of bearish pullback phase initiation.
The initial indication of a pullback would be a bearish Change of Character (CHoCH), marked by a blue dotted line. Price's ongoing ascent has now positioned CHoCH significantly closer to most recent price action.
Weekly Chart:
Daily Analysis:
-> Swing: Bullish.
-> Internal: Bullish.
Gold's price has maintained its upward surge after printing a bullish Internal Break of Structure (iBOS), fueled by softer U.S. macroeconomic data and intensified geopolitical tensions.
In my weekly analysis dated 27 October 2024, I mentioned that price could potentially reach new highs, moving the bearish CHoCH positioning closer to current price. This shift would create a realistic opportunity for price to indicate the start of a bearish pullback phase.
This forecast played out as expected, with CHoCH positioning now significantly nearer to recent price action, marked by a blue dotted vertical line.
Following the bullish iBOS, a bearish pullback is anticipated. While price is currently giving very early signs of this by printing a higher high that has brought the CHoCH positioning closer, this is still an indication, not a confirmation of a potential pullback. The first more concrete signal of a pullback would be a bearish Change of Character (CHoCH).
Daily Chart:
H4 Analysis:
Analysis/bias remains the same as analysis dated 31 October 2024
-> Swing: Bullish.
-> Internal: Bullish.
Gold’s rally persists, driven by the Fed’s dovish stance and heightened geopolitical tensions, strengthening its safe-haven appeal.
Price has recently printed higher highs, bringing CHoCH positioning significantly closer to current price level. A bearish CHoCH has printed, signaling the first indication, though not a confirmation, of a potential bearish pullback phase initiation.
Price is now trading within an established internal range.
Intraday Expectation: Price is expected to continue bearish, potentially reacting at the H4 demand zone or the discount of the H4 internal 50% EQ before targeting the weak internal high.
We should however remain mindful that Daily TF is showing very early signs of bearish pullback phase initiation. Therefore, price could potentially print a bearish iBOS.
H4 Chart:

Is the bullish rally over?Gold continues to show upside potential, maintaining a bullish trend. It is currently supported around the 2731 level and may test resistance at 2758, followed by 2790. If it breaks through these levels, it could aim for a new all-time high around 2880. However, a drop below the 2731 support level would bring attention to the next support levels at 2708 and then a stronger support at 2685. Some indicators hint that a pullback might follow after testing these higher levels, signaling a possible shift toward bearish momentum.

Gold Price Outlook: Key Insights for Next Weeks Trading DecisionAs we head into the new week, gold prices remain resilient, fueled by heightened Middle East tensions and U.S. election uncertainty that keeps investors seeking safe-haven assets. Despite dollar strength and recent rate cuts by the Federal Reserve, gold has surged over 32% this year, reflecting sustained demand in the face of global instability.
In this analysis, we cover critical areas for buyers and sellers alike, focusing on structural patterns, market psychology, and potential trade opportunities you won’t want to miss. Whether you're watching the price action or setting up entry points, these insights will equip you with a clear roadmap for the week ahead.
Will gold continue its strong performance, or could a new catalyst shift the trend?
📌 Stay tuned as we navigate the next big moves in the Gold market!
#goldprice #goldtrading #investing #commodities #marketanalysis #tradingstrategy #goldforecast #geopolitics #election2024 #safehaven #financialmarkets #forex #daytrading #swingtrading #middleeast #usdollar #economicuncertainty📺🔔💼
Disclaimer Notice:
Trading in the foreign exchange market and other instruments carries a high risk and may not be suitable for all investors. The content provided here is for educational purposes only. Evaluate your financial situation and consult with a financial advisor before making any investment decisions. Past performance is not indicative of future results.

GOLD Rising Support Ahead!GOLD is going down
Now but will soon hit a rising support line from
Where we will be expecting a
Local bullish rebound !

XAUUSDPair : XAUUSD ( Gold / U.S Dollar )
Description :
Completed " 12345 " Impulsive Waves
Break of Structure
RSI - Divergence
Bullish Channel as an Corrective Pattern in Short Time Frame
Order Block
Resistance Level

XAU/USD 31 October 2024 Intraday AnalysisH4 Analysis:
-> Swing: Bullish.
-> Internal: Bullish.
Gold’s rally persists, driven by the Fed’s dovish stance and heightened geopolitical tensions, strengthening its safe-haven appeal.
Price has recently printed higher highs, bringing CHoCH positioning significantly closer to current price level. A bearish CHoCH has printed, signaling the first indication, though not a confirmation, of a potential bearish pullback phase initiation.
Price is now trading within an established internal range.
Intraday Expectation: Price is expected to continue bearish, potentially reacting at the H4 demand zone or the discount of the H4 internal 50% EQ before targeting the weak internal high.
H4 Chart:
M15 Analysis:
-> Swing: Bullish.
-> Internal: Bearish.
In yesterday’s intraday analysis, I mentioned that technically, price was expected to react at the internal 50% EQ discount to target the weak internal high. However, there was also potential for a bearish iBOS, which is exactly what unfolded.
Price has made multiple attempts to breach the strong internal high at 2,789.855 but has yet to succeed, leaving it intact.
Intraday Expectation: Price has reacted from the H4 supply zone. Technically, price is now expected to target the weak internal low at 2,770.925.
Note: Price remains highly volatile due to ongoing geopolitical tensions and the Fed’s dovish stance.
M15 Chart:

#XAUUSD: On the way to $2800! 600+ Pips Swing Buy**XAUUSD: 1-Hour Chart Analysis**
Hello Traders,
Gold experienced a surge, reaching 2605 before reversing its direction. Investors anticipated a decline below 2700$. However, the price rebounded to 2743$, filling the volume gap and subsequently dropping to 2715$, which marked the last low. Despite this, the price failed to establish another lower low. Subsequently, it fluctuated within the vicinity before exhibiting a shift in price character.
The upcoming chart analysis indicates an exceptionally bullish outlook. Price has the potential to create another higher high, supported by robust fundamentals and technical indicators signaling a strong bullish sentiment. Traders with open buy positions may consider holding them.
Best of luck and trade safely.

XAUUSD Gold at a Key Extended Level: My Entry Criteria for a Lon👀👉 XAUUSD Gold has reached all-time highs and is currently exhibiting a double top formation. We’re considering a long position on the 4H timeframe if a significant pullback occurs towards equilibrium. *Disclaimer: This is not financial advice. 📊✅

Gold Short: Pullback from Overbought HighsCurrently, Gold (XAU/USD) is showing signs of nearing overbought levels, with price action testing the upper resistance channels on the 30-minute timeframe. A descending trendline aligns with key Fibonacci retracement zones, suggesting a potential reversal opportunity from recent highs around $2,764. In this setup, I’m monitoring price action around the trendline for any signs of rejection, which could indicate the start of a short-term downward movement.
The Relative Strength Index (RSI) is approaching overbought territory, currently close to 69, which often signals an imminent pullback. This, combined with recent highs, gives a strong technical basis for a short position targeting a reversion to lower support levels.
Fundamental Context:
Fundamental factors are adding weight to this setup. Market sentiment remains risk-off due to persistent geopolitical uncertainties in the Middle East and a closely watched U.S. presidential election, both of which have driven safe-haven demand for Gold. Additionally, there is a 96% market expectation for a Fed rate cut of 25 basis points, creating a low-interest rate environment, further supporting bullish Gold sentiment.
However, despite these bullish drivers, any signs of easing in geopolitical tensions or unexpected outcomes in the Fed’s rate decision could diminish the upward momentum. Combined with RSI overbought conditions, this presents a tactical opportunity to capitalize on a potential corrective move in Gold’s price.
Trade Plan:
1. Entry: Short position near the $2,755 resistance level.
2. Stop Loss: Set above the recent high around $2,770 to guard against a false breakout.
3. Target: Initial target at $2,720, with potential to add partials or adjust if price action shows signs of reversal.
Note: Please remember to adjust this trade idea according to your individual trading conditions, including position size, broker-specific price variations, and any relevant external factors. Every trader’s situation is unique, so it’s crucial to tailor your approach to your own risk tolerance and market environment.

XAUUSD Top-down analysis Hello traders, this is a complete multiple timeframe analysis of this pair. We see could find significant trading opportunities as per analysis upon price action confirmation we may take this trade. Smash the like button if you find value in this analysis and drop a comment if you have any questions or let me know which pair to cover in my next analysis.

Escalating Middle East Tensions and Gold Trading StrategyIsrael has launched an attack on Iran, but the missiles were intercepted by Iran's air defense system, resulting in minimal casualties. Interestingly, in the attacked areas, people stood on rooftops to watch the “fireworks,” which is quite a humorous image. The response from Iran regarding this attack will be important to monitor.
Regardless, the war continues, and for gold, another rise seems inevitable. After the market opens on Monday, I believe we can pursue the bullish trend. When the price approaches previous highs, we should close our long positions and begin selling, aiming for a small swing trade. If the price gets near MA20 and shows strong support, we can continue to buy; if not, we’ll consider buying again near MA60.

XAU/USD 28 October 2024 Intraday AnalysisH4 Analysis:
Analysis/bias remains the same as yesterday's analysis dated 27 October 2024.
-> Swing: Bullish.
-> Internal: Bullish.
Gold’s rally persists amid the Fed’s dovish tone and heightened geopolitical tensions, solidifying its safe-haven appeal.
Price has printed a bearish Change of Character (CHoCH), signaling, but not yet confirming, the start of bearish pullback phase.
Intraday Expectation: Despite the bearish CHoCH, price has yet to pull back into the internal 50% EQ discount. We could see a reaction at the H4 supply level before any confirmation of bearish pullback initiation.
Technical Note: The strong high at 2,758.525 is anticipated to remain protected. However, with CHoCH positioning on the daily timeframe somewhat distant, price may print a bullish iBOS in the near term to align with the daily timeframe’s movement.
H4 Chart:
M15 Analysis:
-> Swing: Bullish.
-> Internal: Bearish.
Analysis/intraday expectation remains the same as analysis dated 24 October 2024.
Yesterday's intraday expectation was not met, as price failed to target the weak internal high and instead printed a bearish Internal Break of Structure (iBOS). This aligns with the H4 timeframe being in a pullback phase.
As previously highlighted, price remains highly volatile, driven by ongoing geopolitical tensions and the Fed's softer stance.
Price has since printed a bullish Change of Character (CHoCH), suggesting but not confirming the initiation of a bullish pullback phase. Currently, price is trading within a well-established internal range.
Intraday Expectation: Price is reacting around the 50% equilibrium of the internal range and may also react at nested H4 and M15 supply levels before targeting the weak internal low.
M15 Chart:

Gold next weekI know this mf always pull some stuff to my house :skull:
These are basically my idea.
Hope i can help

XAUUSD Top-down analysis Hello traders, this is a complete multiple timeframe analysis of this pair. We see could find significant trading opportunities as per analysis upon price action confirmation we may take this trade. Smash the like button if you find value in this analysis and drop a comment if you have any questions or let me know which pair to cover in my next analysis.
XAU/USD 25 October 2024 Intraday AnalysisH4 Analysis:
Analysis/intraday expectation remains the same as yesterday's analysis dated 24 October 2024.
-> Swing: Bullish.
-> Internal: Bullish.
Driven by the Fed's dovish stance and escalating geopolitical tensions, gold, as a safe-haven asset, has continued its upward surge.
Price has printed a bearish Change of Character (CHoCH), signaling but not confirming the initiation of a bearish pullback phase.
Intraday Expectation: While there are no clear signs of a pullback yet, price is expected to react at either the 50% equilibrium (EQ) or H4 demand zone before targeting the weak internal high. I'll remain on standby for further developments.
H4 Chart:
M15 Analysis:
-> Swing: Bullish.
-> Internal: Bearish.
Analysis/intraday expectation remains the same as yesterday's analysis dated 24 October 2024.
Yesterday's intraday expectation was not met, as price failed to target the weak internal high and instead printed a bearish Internal Break of Structure (iBOS). This aligns with the H4 timeframe being in a pullback phase.
As previously highlighted, price remains highly volatile, driven by ongoing geopolitical tensions and the Fed's softer stance.
Price has since printed a bullish Change of Character (CHoCH), suggesting but not confirming the initiation of a bullish pullback phase. Currently, price is trading within a well-established internal range.
Intraday Expectation: Price is reacting around the 50% equilibrium of the internal range and may also react at nested H4 and M15 supply levels before targeting the weak internal low.
M15 Chart:
