XAUUSD: Bullish Move to Continue Dominate!Dear Traders,
Hope you are well, our previous analysis did not work out in our favour as price dropped to 2295$ region taking the sell side liquidity. Now, we think that price will remain bullish and the trend will be going as we expect. Please use the accurate risk management and do your research before entering or taking entry solely using our analysis.
Team Setupsfx_
Xauusdforecast

XAUUSD: Three take profit area set, worth 1500+ pips. Dear Traders,
Based on our last analysis, we still have the same bias where we expect price to continue the bullish momentum upside 2400$ which is the least target that we have set. Now, we have witness the changes in price, price behaved very bullish in last few 4h timeframe. Which suggest future growth in the market. Good luck and trade safe.
Team Setupsfx_

#XAUUSD: 1500+ PIPS Buying Opportunity! Dear Traders,
Gold rejected at $2287 and then went on hitting $2370, however, we have witnessed a strong 4H bearish candle occurred due to rejection at very key level. However, our bullish sentiment has not yet changed, we still expecting price to reverse from our buying zone. You can take a well risk managed buying entry, if our analysis support your bias. Do your own research as always.
Team Setupsfx_

XAUUSD: Time for Bullish Reversal! 2400$ Possible Next Target Dear Traders,
Price dropped to 2305$ area where price rejected and then rebounded, we expecting buying volume to increase and our first target will be $2350 and then going forward our last target will be at 2380$.Please use accurate risk management.
Team Setupsfx_

XAUUSD - GOLD - Scalping Mode! 8th JulyLet's see what the market has to offer.
Disclaimer:
This is simply my personal technical analysis, and you're free to consider it as a reference or disregard it. No obligation! Emphasizing the importance of proper risk management—it can make a significant difference. Wishing you a successful and happy trading experience!

XAUUSDPair : XAUUSD ( Gold / U.S Dollar )
Description :
RSI - Divergence
Bullish Channel as an Corrective Pattern in Short Time Frame
Completed " 12345 " Impulsive Waves
Break of Structure
Fibonacci Level - 78.60%

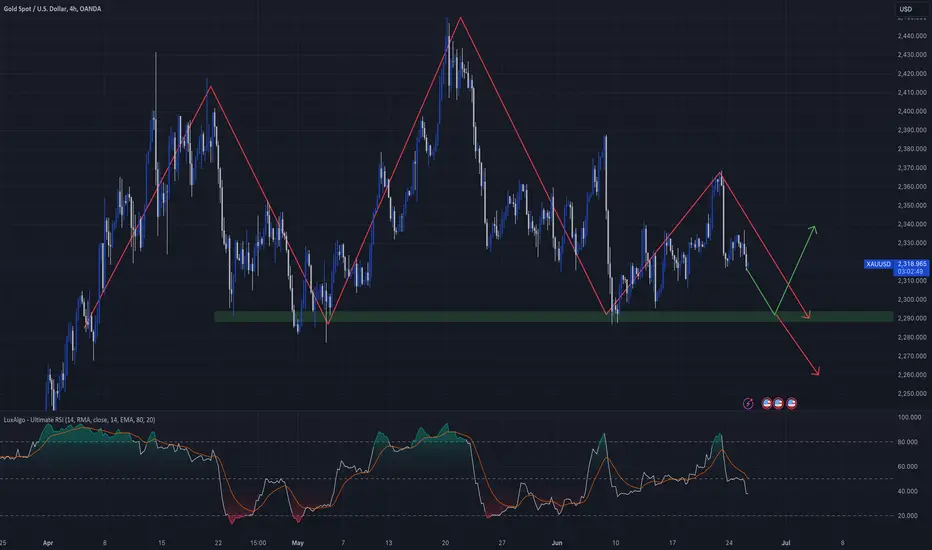
Gold Shorts from 2,410 back downScenario A:
Gold is looking promising for upcoming sells within the 2-day supply zone. As price has been bullish, I expect it to slow down and weaken when approaching this supply. Once price mitigates, I anticipate a Wyckoff distribution to form, providing a precise entry for a valid sell.
Scenario B:
If price retraces before reaching the supply and enters a demand zone, I will look to buy back up towards the supply, following the current bullish trend. Key zones include the 16-hour demand zone or the daily demand zone, where I will be looking to enter buys.
Confluences for Gold Shorts:
- Price has been bullish and requires a retracement.
- Entering a 2-day supply zone that has caused a CHOCH to the downside.
- Lots of liquidity to the downside that needs to be taken.
- If price wants to continue going up, it must retest a demand zone I have marked.
P.S. Scenario C:
If price breaks past the 2-day supply and continues rallying, it will likely carry on its long-term bullish trend, potentially breaking new all-time highs.

XAUUSD GoldPair : XAUUSD ( Gold / U.S Dollar )
Description :
Completed " 12345 " Impulsive Waves
Break of Structure
RSI - Divergence
Fibonacci Level - 261.8%
S / R Level
Break out of the Demand Zone

XAUUSD - hanging high above the 236x threshold
Gold from past to present I see that Plan Sideway is reacting around 6>8 prices.
There's a lot of news on Friday, so I think Gold is easy to scan in both directions. If anyone trades today's news, you should wait for the news to come out before trading.
Today I Will Still Watch To Buy Gold According To The Trend Of MA.
> Everyone please refer to Buy Gold around 2354>2358
SL 2350
TP 2366>237x
This plan If Gold cannot increase strongly but still reacts in the Sideway range, then sell Gold right at the candlestick 2365>2366.
SL 2368
TP 2360>2354
For Selling, you should go for a small volume. The main thing is to Buy according to the Trend, everyone
--
--World gold costs did now no longer range a great deal throughout the United States Independence Day holiday. The marketplace is awaiting US non-farm payroll facts to be launched today. Market analyst Christopher Lewis of FX Empire stated that this record could have a massive effect on gold costs withinside the future. Lewis stated that if gold costs fall after the record, buyers ought to see it as a shopping for possibility due to the fact this valuable metallic is in an uptrend and will reach $2,400/ounce or greater way to the boost. through sturdy call for from principal banks and shelter-in-area shopping for because of issues approximately geopolitical tensions.
Previously, on July 3, the United States introduced a brand new non-public area employment record in June of 150,000 jobs, down from 157,000 jobs in May and decrease than expectancies of 160,000 jobs. Initial unemployment gain programs final week have been 238,000, better than the 235,000 formerly forecast and better than the 233,000 performed the preceding week.
Weak non-public employment facts precipitated the USD to fall sharply, assisting gold costs to upward push to a 2-week excessive yesterday.

XAUUSD - GOLD - Scalping Mode! 4th JulyLet's see what the market has to offer.
Disclaimer:
This is simply my personal technical analysis, and you're free to consider it as a reference or disregard it. No obligation! Emphasizing the importance of proper risk management—it can make a significant difference. Wishing you a successful and happy trading experience!

XAUUSDPair : XAUUSD ( Gold / U.S Dollar )
Description :
Symmetrical Triangle as an Corrective Pattern in Short Time Frame with the Breakout of Upper Trend Line
RSI - Divergence
Break of Structure and Retracement
Demand Zone
Completed " 12345 " Impulsive Waves and " ABC " Corrective Waves

XAUUSD - Sharp reversalSELL 2360-2365
SL 2370
TP 2340 - 2330- 2300
---------------------------
BUY when break 2372
TP 2380-2400
SL 2360
---------------------------
World gold rate stood at 2,361 USD/ounce, a pointy boom of 32 USD/ounce as compared to the equal hour the previous day morning. Converted on the financial institution change fee except for taxes and fees, the arena gold rate is ready 72.five million VND/tael, approximately 4.forty eight million VND/tael decrease than the SJC gold rate sold.
World gold charges jumped greater than 1% for the duration of the session, attaining the very best stage withinside the beyond 2 weeks as new facts strengthened forecasts that the United States Federal Reserve (Fed) will lessen hobby fees in September. The marketplace is presently having a bet at the opportunity The opportunity of the Fed slicing hobby fees in September is 68%.
Last week, the variety of programs for US unemployment blessings elevated for the primary time. US provider enterprise hobby in June fell to a four-12 months low amid a pointy drop in orders. Experts say that that is a sign that the economic system is dropping momentum on the quit of the second one quarter.
At the maximum latest assembly in June, Fed officers admitted that the United States economic system became slowing down and "rate stress is easing". Investors are presently anticipating the non-farm payroll record to be launched this Friday to higher examine the opportunity of this company adjusting hobby fees.

XAUUSD Gold Technical Analysis and Trade Idea - Trading A Range👉🔍 XAUUSD is curently rangebound and we are looking for an opportunity into the London Open. Additionally, we cover essential topics such as trend analysis, market structure, price action, and other key aspects of technical analysis. Please remember, this video is for educational purposes only and does not constitute financial advice. 📊✅

Gold directed to the support. Will it hold up this time?Gold is forming a head and shoulders, and looks like it is headed towards the $2,290 support, will it bounce off it and get back up this time?
If it completes the structure we could see it pierce the support, and in that case having many areas to fill at the bottom, it could go down a lot.
In trading everything will be filled, there are many areas still open, please be careful to open long on the $2,290 support, check before the price rebounds solidly.
XAUUSD Pair : XAUUSD ( GOLD / U.S DOLLAR )
Description :
Head and Shoulder Pattern in Long Time Frame
RSI - Divergence
Break of Structure
Completed " 123 " Impulsive Waves
Demand Zone

XAUUSD Pair : XAUUSD ( GOLD / U.S DOLLAR )
Description :
Head and Shoulder Pattern in Long Time Frame
RSI - Divergence
Break of Structure
Completed " 123 " Impulsive Waves
Demand Zone

XAUUSDPair : XAUUSD ( Gold / U.S Dollar )
Description :
Symmetrical Triangle as an Corrective Pattern in Short Time Frame
Break of Structure
Completed " 12345 " Impulsive Waves
RSI - Divergence
Demand Zone

XAUUSD - GOLD - Scalping Mode! 1th JulyLet's see what the market has to offer.
Disclaimer:
This is simply my personal technical analysis, and you're free to consider it as a reference or disregard it. No obligation! Emphasizing the importance of proper risk management—it can make a significant difference. Wishing you a successful and happy trading experience!

XAUUSD, selling expected from M15 Ex OBIn XAUUSD, I am selling expected from M15 Extreme Order block, you can take a sell entry now.
good luck

XAUUSD GoldPair : XAUUSD ( Gold / U.S Dollar )
Description :
Completed " 12345 " Impulsive Waves and " ABC " Corrective Waves
Break of Structure
RSI - Divergence
Bullish Channel as an Corrective Pattern in Short Time Frame
Fibonacci Level - 78.60%

XAUUSD GoldPair : XAUUSD ( Gold / U.S Dollar )
Description :
Completed " 12345 " Impulsive Waves and " ABC "Corrective Waves
Break of Structure
RSI - Divergence
Falling Wedge as an Corrective Pattern in Short Time Frame
Fibonacci Level - 61.80%

XAUUSD - Strong uptrendXAU - 10:00 June 28, 24
Gold is currently increasing again in the Strong Buying Trend Plan. With this momentum, Gold will probably increase 235x again soon, everyone.
Everyone today refer to Canh Buy Gold around 2317>2319
SL 2315
City 2326>2335
If Gold Increases again without breaking past 2327, then Sell Gold again around the old candlestick area around 2327>2329
SL 2331
TP 2320>231x
On Friday, I do not encourage much trading. Last week, there were a few short SL days, but overall, I still had good trending beats. Last week, anyone who installed a Bot or followed a Bot was flooded with profits 👌👌 @All
Across maximum timeframes, BB is narrowing and buying and selling sideways over the weekend after the valuable steel capitalized on a sturdy in a single day recuperation from two-week lows. The fee is presently trying out the 2320 guide stage amid moving sentiment. With the cutting-edge fashion, fee will increase are viable however the resistance stage at 2345 is not likely to be damaged due to the fact the primary fashion of the marketplace continues to be correction.
The attention now turns to the maximum applicable US macroeconomic report, the Personal Consumption Expenditures (PCE) Price Index. The Federal Reserve`s desired inflation index could be launched on Friday and is predicted to expose inflation growing 2.6% 12 months-on-12 months in May, barely decrease than preceding stage of 2.7%. Easing inflationary pressures will raise hopes for an upcoming US hobby price reduce and cause a decline withinside the USD. However, because the marketplace might also additionally turn out to be optimistic, the opportunity of XAU/USD growing may be very constrained.
The admin in my view believes that the fee will now go back to the constrained resistance location of the BB band, gold will decline. The predicted goal for this decline is at the least the 2300 stage.

XAUUSD (GOLD) EVERYDAY TRADE SETUPHello traders ,
This my idea for Short. XAUUSD (GOLD) The Zone 5MIN choch. then i will go to short.
this is my ideas only. what you are flow your trading statistics you can continue.
If you Like my ideas follow me...
