Scalping Strategy Using BOS & OB | Gold Spot | by Mohsen MozafarDescription:
> This is a 30-minute scalping setup on Gold Spot (XAU/USD), based on Smart Money Concepts (SMC) — focusing on Break of Structure (BOS) and Order Blocks (OB).
Analysis and strategy are prepared by Mohsen Mozafari Nejad.
---
📊 Market Context:
Current Structure: Bearish
Short-Term Market Structure: MSU (Market Structure Up)
Efficiency: Confirmed (clean price action & response zones)
---
🧠 Technical Highlights:
1. Double BOS confirms recent shifts in momentum
2. TLQ (Top Liquidity Quest) formed after HH (Higher High) and liquidity sweep
3. Key Demand OB identified (labeled A) — valid based on BOS confirmation
4. Expecting a bounce from OB (A) towards (B) as a reaction to unfilled imbalance
5. Potential drop from TLQ zone (B) to (C) if liquidity is fully absorbed
---
🎯 Scalping Plan:
Entry Zone:
Order Block at (A), waiting for CHoCH or bullish price action confirmation
(preferably on lower timeframe like M5)
Stop Loss:
Just below OB (around 3327)
Take Profits:
TP1: Near TLQ / Extreme zone (B)
TP2: Further liquidity grab or possible continuation above previous HH
---
❗ Alternative Bearish Scenario:
If price fails to hold at OB (A) and breaks below 3327 with BOS,
→ short opportunity opens toward new lows at 3314–3310 (labeled C).
---
✅ Summary:
This is a clean scalping setup following SMC principles:
BOS → OB → Liquidity → Reaction
Focus on structure, precision, and quick confirmation signals.
Prepared by:
📌 Mohsen Mozafari Nejad
Xauusdforecast

Gold Short Term OutlookYesterday’s chart analysis played out well.
Price broke above the MA50 and tested the $3,346 resistance zone. However, this zone failed to hold, and gold dropped aggressively toward the $3,306 support.
Once again, price is trending below both the 50 and 200 moving averages, indicating continued bearish pressure.
For now, the $3,306 support is holding. Bulls need to break above $3,330-$3,346 for higher levels to open up.
🔑 Key Levels:
Resistance:
$3,346 • $3,361 • $3,375
Support:
$3,306 • $3,287 • $3,271 • $3,242

Gold Builds Bullish Momentum After $3,294.0 ReboundGold bounced from $3,294.0, forming a double bottom pattern as XAU/USD consolidates near $3,330.0. Stochastic has exited oversold territory, signaling strengthening bullish momentum.
If $3,294.0 holds as support, the uptrend may continue toward the $3,393.0 target.

Gold Short Term OutlookYesterday, we noted that gold needed to close and hold above the $3,330 resistance to open the path toward $3,346 and potentially $3,375.
Since then, price rejected the intraday support and is now trending above the $3,330 level.
Currently, the 50MA is acting as dynamic resistance. A clean break above it could trigger a move toward $3,346 and possibly higher resistance zones.
However, if bullish momentum fades, price may drop back toward the key support area, where buyers could look to step in again.
🔑 Key Levels:
Resistance:
$3,330 • $3,346 • $3,361 • $3,375
Support:
$3,306 • $3,287 • $3,271 • $3,242

gold on short bullish#XAUUSD on bullish reverse till 3340 for sell.
Buy on 2 times breakout above 3330, target 3340, SL 3325 short.
Above 3340 sell, target 3305, SL 3349
Below 3320 have bearish range, we watch the price closely to sell till 3315-3305.

XAUUSD Ready bounce back?XAUUSD 3295.00 is an important weekly and daily key level price has just bounced back from the key level with double bottom formation. It is possible for the price to continue to bounce back to daily resistance level?
While was in down trend price has left significant imbalance in the market showing possible uptrend with the filling of FVG.
A buy trade with strong liquidity grab is high probable.

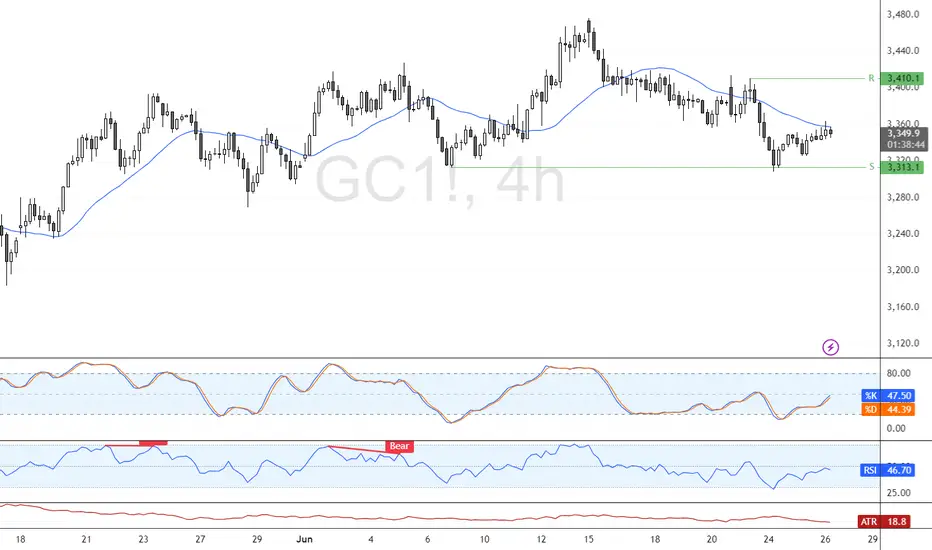
Gold Short Term OutlookGold dipped into the Support Zone but failed to sustain the breakdown below it. After briefly breaking below the zone, price has rebounded and is now attempting a short-term recovery.
However, structure remains bearish, with price trading below both the 50MA and 200MA, signalling continued downside pressure unless momentum shifts.
For bullish momentum to continue, we need to see a clean break and hold above $3,330, which may open the path toward $3,346, then $3,361.
If the move up doesn’t hold, the next reaction is expected near key support.
🔑 Key Levels:
Resistance:
$3,330 • $3,346 • $3,361 • $3,375
Support:
$3,306 • $3,287 • $3,271 • $3,242
📌 Stay patient and wait for confirmation before committing to a direction.

Gold Short Term OutlookYesterday’s chart idea is playing out as analysed.
Gold failed to break above the $3,395 resistance and has now pulled back, currently testing the first support zone — aligned with the 4H 200MA and Daily 50MA.
If this area fails to hold, price is likely to head toward the next key support zone, where we expect a potential reaction.
To resume bullish momentum, we need to see a strong close above $3,346. Key bullish zones remain $3,375 and $3,395.
📌 Key Levels to Watch:
Resistance:
$3,375 • $3,395 • $3,418 • $3,439
Support:
$3,361 • $3,346 • $3,330 / $3,306
$3,287 – Critical demand zone
🧠 Fundamental Focus:
All eyes are on Fed Chair Powell’s testimony today, which may offer clues about the Fed’s rate outlook and inflation stance. Any hint of continued hawkishness could weigh on gold, while dovish commentary may trigger renewed upside interest.
Expect heightened intraday volatility around his remarks — stay cautious.

Gold, Will USA-Iran-Israel conflict affect it? The USA-Iran-Israel conflict can significantly impact gold prices. Gold is a safe-haven asset, so demand often rises during geopolitical tensions, pushing prices up
3406 gonna be first target for me, if it breaks this lvl with huge volume and FVG on 1h+ then most likely we will see ATH in near future
bearish scenario(lest likely) - price breaks down 3340 and close with nice volume and fvg on 1h+ which will open move all the way down to MO

Gold Short Term OutlookGold is currently trading around $3,368, caught between dynamic moving average resistance and an intraday resistance zone.
Price must break and hold above the $3,378 resistance to open the path toward $3,395. A confirmed break above the key $3,395 level could signal the start of the next bullish leg.
However, repeated failure to break above $3,395 — or even $3,378 — may drag gold lower into key support zones.
📌 Key Levels to Watch:
Resistance:
$3,375 • $3,395 • $3,418 • $3,439
Support:
$3,361 • $3,346 • $3,330 / $3,306
$3,287 – Critical demand zone
🧠 Fundamental Insight:
Gold remains supported amid rising geopolitical tensions. Over the weekend, U.S. airstrikes targeted Iranian nuclear sites, escalating concerns over a broader conflict in the Middle East. This has reignited safe-haven demand, with gold catching a bid despite recent technical pullbacks.
Meanwhile, traders are weighing softer U.S. inflation signals against the Fed’s cautious stance. If tensions persist and economic data weakens, gold could benefit from both risk-off flows and increased speculation around potential rate cuts.

Gold Medium Term OutlookGold is currently trending within a rising channel after rejecting the $3,439 resistance zone, which marked a new Higher High (HH). Price is respecting the ascending channel support and is now testing the 50MA. The uptrend remains intact, with a sequence of Higher Lows (HL) and Higher Highs (HH) forming within the channel.
A break and hold above $3,378 could open the path for a re-test of $3,439 and potentially $3,501. However, failure to hold the rising channel support may shift momentum bearish, with $3,303 and $3,226 as the next major downside targets.
📌 Key Levels to Watch This Week:
Resistance: $3,378 • $3,439 • $3,501
Support: $3,303 • $3,226 • $3,171
🧠 Fundamental Insight:
Gold remains supported amid rising geopolitical tensions. Over the weekend, U.S. airstrikes targeted Iranian nuclear sites, escalating concerns over a broader conflict in the Middle East. This has reignited safe-haven demand, with gold catching a bid despite recent technical pullbacks.
Meanwhile, traders are weighing softer U.S. inflation signals against the Fed’s cautious stance. If tensions persist and economic data weakens, gold could benefit from both risk-off flows and increased speculation around potential rate cuts.

gold on sell#XAUUSD price await breakout below 3354.5 for selling.
Below 3354.5 have low bearish which will drop firstly below 3346-3334.46, SL 3364.8
Below 3345 have a strong bearish continuation which will drop more. Any possible buy above 3364.8 on H1 closure will start bullish from there.

gold on bullish reverse#XAUUSD buy below 3375-3377, but firstly we wait for 3375 to touch before buying.
Target 3406, stop loss at 3365
Below the 3365 holds bearish flag which will continue falling till 3349.

gold on buy#XAUUSD price holds on 3398 for buy continuation.
Above 3398 will take bullish which will breakout 3406, entry 3398, SL 3384, TP 3406-3425.
If price breakout 3406 and H1 closes above there then bullish will continue till 3425, but reverse and closure below 3402 down will drop the price more.

XAUUSD: Analysis H4 next weekThe continued tension in the Middle East (Israel–Iran) has led to a flight to safe havens, a key driver for gold.
Reduced pressure from the USD due to expectations that the Fed will slow down its rate cut (~September), coupled with inflationary pressures, could support gold prices
If tensions in the Middle East do not ease next week, gold's rally could extend and we could see 3500. But be careful, as if tensions ease and some good news from the USD comes, the rally could be halted.
gold on sell reverse#XAUUSD multiple 2 times breakout below 3408 will drop the price till 3400-3376.
Price holds bearish reversal below 3408, target 3400-3376. SL 3419.
Bullish range and reverse is at 3403.6 price can reverse from here but if drop happens first below 3399 its invalid.
H1 closure above 3425 holds longer bullish.

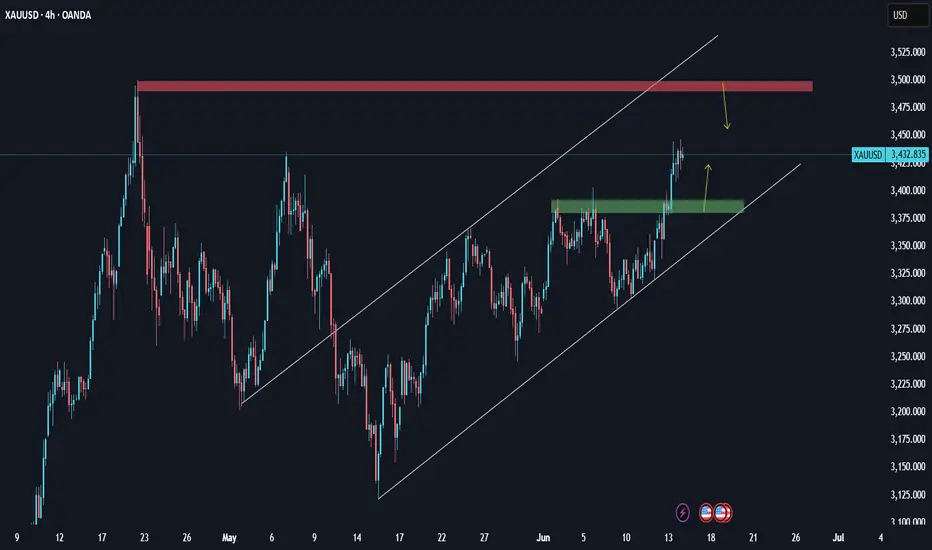
XAUUSD: Analysis June 16Gold has a lot of momentum to increase and could head towards testing the all-time high around 3500 as there are too many risks emerging, from geopolitical developments to interest rate outlook, and tariffs. Major conflicts in the Middle East, Russia - Ukraine, trade war between the US and the rest of the world, ... are all sudden risk support that makes gold likely to surge in the short term.
Gold, after increasing around 3450 this morning, is currently correcting down. But overall, the uptrend with gold is still solid after breaking the downtrend channel. However, we should avoid buying in strong corrections.
The support area around 3400 will be the ideal place for us to BUY today.
And the resistance area 3440 - 3445 will be where we SELL.

XAU/USD 16-20 June 2025 Weekly AnalysisWeekly Analysis:
Swing Structure -> Bullish.
Internal Structure -> Bullish.
Analysis and bias remains the same as analysis dated 16 March 2025.
In my analysis dated 27 October 2024 I mentioned (below) that price could potentially print higher-highs in order to reposition CHoCH. This is exactly how price printed. CHoCH positioning has been brought significantly closer to current price action. CHoCH positioning is denoted with a shortened blue dotted horizontal line.
The remainder of my analysis and bias remains the same as analysis dated 09 February 2025.
Price has printed a further bullish iBOS.
Price is currently trading within an internal low and fractal high. CHoCH positioning is denoted with a blue dashed line.
Price Action Analysis:
In my analysis dated 27 October 2024, it was noted that the first sign of a pullback would be a bearish Change of Character (CHoCH), indicated by a blue dotted line. Price's consistent upward momentum had repositioned previous CHoCH much closer to recent price levels as expected for weeks. Current CHoCH positioning is quite a distance away from price, therefore, it would be viable if price continued bullish to reposition ChOCH.
Note:
It is highly unlikely price will "crash" as many analysts are predicting. My view is this is merely a corrective wave of the primary trend.
Given the Federal Reserve's dovish policy stance alongside heightened geopolitical risks, market volatility is likely to remain elevated, influencing intraday price swings.
Price could also be driven by President Trump's policies, geopolitical moves and economic decisions which are sparking uncertainty and potential repricing of Gold.
Weekly Chart:
Daily Analysis:
Swing -> Bullish.
Internal -> Bullish.
Analysis and Bias remains the same as Analysis dated 11 May 2025.
Since my last weekly analysis price has finally printed a bearish CHoCH.
This is the first indication, but not confirmation of bearish pullback phase initiation.
Price is now trading within an established internal range.
Price should now technically trade down to either discount of 50% internal EQ, or Daily demand zone before targeting weak internal high, priced at 3,500.200.
Note:
The Federal Reserve’s continued dovish stance, coupled with escalating geopolitical uncertainties, is expected to sustain elevated market volatility, influencing both intraday and broader trend developments.
Additionally, price action may be further shaped by U.S. policy decisions, including measures enacted under President Trump. Shifts in geopolitical strategy and economic policymaking could introduce further uncertainty, contributing to the ongoing repricing dynamics within the gold market.
Daily Chart:
H4 Analysis:
-> Swing: Bullish.
-> Internal: Bullish.
Analysis and bias remains the same as analysis dated 23 April 2025
Price has now printed a bearish CHoCH according to my analysis yesterday.
Price is now trading within an established internal range.
Intraday Expectation:
Price to trade down to either discount of internal 50% EQ, or H4 demand zone before targeting weak internal high priced at 3,500.200.
Note:
The Federal Reserve’s sustained dovish stance, coupled with ongoing geopolitical uncertainties, is likely to prolong heightened volatility in the gold market. Given this elevated risk environment, traders should exercise caution and recalibrate risk management strategies to navigate potential price fluctuations effectively.
Additionally, gold pricing remains sensitive to broader macroeconomic developments, including policy decisions under President Trump. Shifts in geopolitical strategy and economic directives could further amplify uncertainty, contributing to market repricing dynamics.
H4 Chart:

Gold (XAUUSD) Trading Setup – Mid-June 2025 Analysis🔰 Gold (XAUUSD) Trading Setup – Mid-June 2025 Analysis
This chart represents a strategic price action-based setup on Gold (CFDs on Gold – US$/Oz) using a 15-minute timeframe. It includes clearly defined entry zone, support/resistance levels, and profit-taking targets (TP1, TP2) for both bullish and bearish scenarios.
🔍 Current Market Context
Current Price: ~$3431.77
Structure: The price has been in an upward trend with a consolidation phase forming near the key mid-zone.
Highlighted Zone: A decision zone is marked in red (between ~$3422 and ~$3418), acting as the key liquidity zone or breakout area.
📈 Bullish Bias
If price breaks and holds above the red zone:
✅ TP1: $3480
✅ TP2: $3580
These levels act as short- to mid-term bullish targets based on projected extensions of recent upward momentum.
📉 Bearish Bias
If price breaks and holds below the red zone:
✅ TP1: $3320
✅ TP2: $3260
This indicates a possible reversal or correction phase, with targets derived from recent swing lows and support areas.
📌 Trading Notes
The blue shaded areas represent target zones for partial or full exits.
Red zone is the critical breakout decision point.
Ideal for breakout or pullback traders.
Can be combined with volume/confirmation indicators (e.g., RSI, MACD, or price action candles) for entry timing.

gold on sell retest#XAUUSD on price reverse, possible expect price to drop below those bearish zone before buying.
Entry on sell 3421, SL 3431, TP 3399-3378.
Below 3378 holds bullish reverse, if H1 and next H1 closes long above 3433 then bullish will reach 3470.

XAUUSD Analysis todayHello traders, this is a complete multiple timeframe analysis of this pair. We see could find significant trading opportunities as per analysis upon price action confirmation we may take this trade. Smash the like button if you find value in this analysis and drop a comment if you have any questions or let me know which pair to cover in my next analysis.

Great analysing from smart analysis This Wyckoff Accumulation scenario on Gold was like a blueprint—every stage played out almost exactly as anticipated. From the Selling Climax (SC) to the Spring and Test, it was as if the market followed the textbook. Watching this unfold live last night was both thrilling and affirming. Truly, it was a masterclass in market behavior.
Analysis : mohsen mozafari nejad 😎
