Gold: Rebounding and Stabilizing Near 3340Gold Market Outlook: Watching Inflation, Technical Pressure Builds
Markets are squarely focused on the upcoming U.S. Consumer Price Index (CPI) release, which could serve as a pivotal moment for shaping Federal Reserve policy expectations ahead of the September meeting. Current market pricing suggests a roughly 52% probability of a rate cut, but this is highly sensitive to how inflation data unfolds. The consensus anticipates headline CPI growth of 0.2% and core inflation at 0.3%. Any deviation—especially a softer reading—could significantly sway sentiment in favor of monetary easing, thereby reinforcing gold’s appeal as a defensive asset.
Beyond the macroeconomic calendar, broader geopolitical undercurrents continue to influence the landscape. Optimism stemming from recent progress in U.S.-China trade discussions has buoyed risk appetite, yet this is tempered by lingering concerns after a court ruling upheld former President Trump’s authority to maintain certain tariffs. This legal development introduces fresh layers of ambiguity, keeping the U.S. dollar on the defensive and lending indirect support to gold prices.
From a technical standpoint, gold remains confined within the narrowing bounds of a symmetrical triangle pattern—a classic sign of consolidation and potential volatility ahead. The price action reflects a broader indecisiveness prevalent across multiple asset classes, as traders await clearer macro signals before committing to directional moves.
Key support lies at 3301, 3330, and 3340, while resistance is seen at 3349, 3361, and 3375. Special attention should be paid to the critical 3330–3340 range, which has acted as a magnet for price in recent sessions. A decisive break and sustained hold above this zone—especially if supported by softer inflation data—could hand the bulls a tactical advantage, opening the door for a push toward higher resistance areas and renewed bullish momentum.
In summary, gold is at a technical and fundamental crossroads. Inflation data will likely determine whether the metal can break free from its current consolidation or remain range-bound amid ongoing uncertainty.
Xauusdforecast

gold on short buy#XAUUSD price have been multiple retesting and continuation on bullish, now we expect price to hit 3362-3364 for bearish.
Buy limit at 3342.5, SL 3335, TP 3362-3364.
Above 3349 holds bullish range also.
Above the rectangle 3362-3364 holds bearish reversal.
If H1 closes below 3332 then bearish is active also

gold on buy#XAUUSD price on buy.
Below 3352 holds bearish flag, take profit 3339.94, stop loss 3361.
At 3339.94 holds bullish reverse, target 3378.
Above 3370 when H1 close on buy holds bullish breakout, TP 3390, SL 3360.

gold bearish await#XAUUSD price have retest below the third pattern, now main expectation is about to come.
Below the 3350 shows a strong bearish continuation which will reform below 3341, main possible target is below 3326, SL 3365.
Above 3368 on breakout will continue bullish movement till 3388

Smart Trade Insight – XAU/USD Technical BreakdownKey Levels & Technical Zones:
🔹 Resistance Zone (🔼 SELL Area):
📌 3,315 – 3,340
This area has been tested and rejected multiple times, as highlighted by the strong bearish wicks. The recent price action failed to break above it, triggering short interest.
🔹 Minor Support Zone:
📌 Around 3,243
Acted as intraday bounce area previously, now likely to offer weak support in the coming move down.
🔹 Major Demand Zone (💚 BUY Interest Zone):
📌 3,120 – 3,140
Labelled as "BEST SUPPORT DEMANDING ZONE" – historical demand visible with strong bounce history. Ideal for monitoring bullish reversal opportunities.
📈 EMA Levels:
🔴 50 EMA: 3,299
🔵 200 EMA: 3,254
Current price action is hovering near the EMAs. The rejection at the resistance while below the 50 EMA indicates weakening bullish momentum.
🔍 Market Structure Overview:
The double-top formation near the resistance shows exhaustion in buying.
Lower highs forming → structure turning bearish short-term.
Solid rejection confirms that this is a valid zone to initiate short positions 🛑📉.
📉 Forecast Path:
🔮 Projected Move:
Price is expected to break below minor support at 3,243.
Intermediate target: 3,206, then 3,167 🟠.
Final destination: Demand Zone at 3,120 – 3,140 🟩 for potential bounce 📈.
💬 "Market not break the resistance level and rejected solid — this is a good entry for short-term sell trades." ✅
✅ Trade Idea Summary:
🟥 Bias: Short
🎯 TP Targets: 3,206 → 3,167 → 3,122
📉 SL Suggestion: Above 3,340 resistance zone
🧭 Risk-Reward Setup: Favorable for short-term traders

XAU/USD 26 May 2025 Intraday AnalysisH4 Analysis:
-> Swing: Bullish.
-> Internal: Bullish.
Analysis and bias remains the same as analysis dated 23 April 2025
Price has now printed a bearish CHoCH according to my analysis yesterday.
Price is now trading within an established internal range.
Intraday Expectation:
Price to trade down to either discount of internal 50% EQ, or H4 demand zone before targeting weak internal high priced at 3,500.200.
Note:
The Federal Reserve’s sustained dovish stance, coupled with ongoing geopolitical uncertainties, is likely to prolong heightened volatility in the gold market. Given this elevated risk environment, traders should exercise caution and recalibrate risk management strategies to navigate potential price fluctuations effectively.
Additionally, gold pricing remains sensitive to broader macroeconomic developments, including policy decisions under President Trump. Shifts in geopolitical strategy and economic directives could further amplify uncertainty, contributing to market repricing dynamics.
H4 Chart:
M15 Analysis:
-> Swing: Bullish.
-> Internal: Bearish.
Analysis and bias remains the same as analysis dated 22 May 2025.
In my analysis from 12 May 2025, I noted that price had yet to target the weak internal high, including on the H4 timeframe. This aligns with the ongoing corrective bearish pullback across higher timeframes, so a bearish internal Break of Structure (iBOS) was a likely outcome.
As anticipated, price targeted strong internal low, confirming a bearish iBOS.
Price has remained within the internal range for an extended period and has yet to target the weak internal low. A contributing factor could be the bullish nature of the H4 timeframe's internal range, which has reacted from a discounted level at 50% of the internal equilibrium (EQ).
Intraday Expectation:
Technically price to continue bullish, react at either premium of internal 50% EQ or M15 demand zone before targeting weak internal low priced at 3,120.765.
Alternative scenario:
Price can be seen to be reacting at discount of 50% EQ on H4 timeframe, therefore, it is a viable alternative that price could potentially print a bullish iBOS on M15 timeframe.
Note:
Gold remains highly volatile amid the Federal Reserve's continued dovish stance and persistent geopolitical uncertainties. Traders should implement robust risk management strategies and remain vigilant, as price swings may become more pronounced in this elevated volatility environment.
Additionally, President Trump’s recent tariff announcements are expected to further amplify market turbulence, potentially triggering sharp price fluctuations and whipsaws.
M15 Chart:

XAUUSD Analysis todayHello traders, this is a complete multiple timeframe analysis of this pair. We see could find significant trading opportunities as per analysis upon price action confirmation we may take this trade. Smash the like button if you find value in this analysis and drop a comment if you have any questions or let me know which pair to cover in my next analysis.

XAUUSD Market OutlookMy current bias on XAUUSD remains bullish, as we are targeting the lower high (LH) around the 3,438 level. However, the market is currently in a pullback phase within the LH & LL. Price has entered an OTA level within a Daily Fair Value Gap (FVG), ranging between 3,370 and 3,333. This presents a potential opportunity for short setups as we move towards the 3,251 level.
On the 4-hour timeframe, there's a valid FVG Breaker near our Fibonacci-based OTA level, aligning closely with the 3,251 support zone. This is a key area to watch for bullish confirmations. Any long positions should ideally be considered from this zone.
Important Note:
When trading gold, patience and discipline are essential. Only act on clear, confirmed setups that align with your strategy. Quality over quantity always wins in the long run.

[20250522] - Gold Overview1️⃣ Market Overview:
📌 Recent Closed: 3315
📌 Bullish sentiment confirmed above (3265)
📌 Key reversal threshold: (3296)
2️⃣ Key Observations:
✅ Price above (3253) suggests continued bullish bias.
✅ Recent High 3320—watch for a strong breakout or exhaustion.
✅ Next liquidity Range: 3337 (upside), 3264 (downside).
3️⃣ Potential Scenarios:
🔹 Bullish Continuation: Closing above 3320 confirms momentum toward 3337.
🔹 Bearish Exhaustion: Failure to hold 3296 could trigger a reversal toward 3253.
🔹 Invalidation: 💡 A break below 3296, failing Bull POC (3265), would shift sentiment bearish.
4️⃣ Entry & Target Levels:
🔹 Bullish Entry:
✔️ Price holding above 3296 strengthens bullish sentiment.
✔️ A confirmed break above 3320 opens room for a run toward 3337 liquidity zone.
🔹 Bearish Entry:
✔️ If price fails to sustain above 3296, watch for confirmation near 3253 VAH.
✔️ A strong rejection leads price toward next liquidity at 3264.
🎯 Targets:
Upside: 3320 breakout leads toward 3337 liquidity zone.
Downside: Failure at 3296 opens movement toward 3264 liquidity support.
📢 Your Thoughts? Drop a comment and let me know what you think! 🚀

XAU USD NEXT POSSIBLE MOVE WITH SO MUCH UP AND DOWNIn hourly time frame it takes rejection and after opening session we can see two scenarios...
After opening new session if it comes down then tgt: 3385, from here have 90% chances to reverse for tgt: 3340, if it will not reverse and continue down side then we can go for the tgt:3275 to 3209

Will gold continue to rise to 3280-3330 today?Hello everyone. Let's discuss the trend of gold this week. Today, Moody's downgraded the US sovereign credit rating from AAA to Aa1 on the grounds of "debt surge and fiscal out of control", ending the US's last "top credit" title among the three major rating agencies.
Due to this influence, gold opened sharply higher today, Monday, and the highest so far is around 3250.
Here is the 1-hour chart:
If gold can continue to rush above 3250 in the short term, then we will see 3280-3300 later.
The high point of 3250 may be broken at any time.
For now, I think that as long as gold is above 3200 today, gold will continue to rise.
So, if you do it in the short term, you can buy in the 3200-3220 range, with 3200 below as defense, and as long as the upper target stands firm at 3250, you can continue to see the 3280-3300-3330 range.

Rangbound with rising patternXAUUSD H1& H4 Timeframe .
Although gold is intact with the rising channel at trend line meets with 3205-3250
- I will sell on top from 3270-3280 structural resistance area if i got confirmation of rejection and to long target at 3130.
-if we get candle above 3235 then we'll see upside surprise towards 3252 first then 3270.
BEARISH SCANARIO:
-if 3210-3205 breaks then we should leave the upside back behind and sell towards 3180 in first stage then we will have to wait for the 3180 structural support Invalidation towards bottom side .once 3180 breaks in h4 then move your weapons towards 3130 target.
#XAUUSD

Will gold fall to 3180-3158?Hello everyone. Let's discuss the trend of gold this week. If you have a different opinion, you can express your different opinions in the comment area. Yesterday, Monday, retail traders made a record bottom-fishing in US stocks, reversing the 1% drop in the S&P 500 index caused by Moody's downgrading the US credit rating last weekend.
Yesterday, Monday, gold opened at a high point near 3250, but after the US stock market opened, it basically maintained a downward trend.
From the current 1-hour chart, gold has been fluctuating above the 1-hour chart range yesterday, Monday, but there has been a change today. It has continuously fallen below the hourly chart range support position at the opening.
Therefore, from the current point of view, gold is likely to retreat downward today, and the 3200 mark is currently difficult to hold.
Therefore, we must be alert to the possibility of a retracement today. As for the operation, you can rely on the 3220-3225 range to sell, and look at the target to 3180-3158.

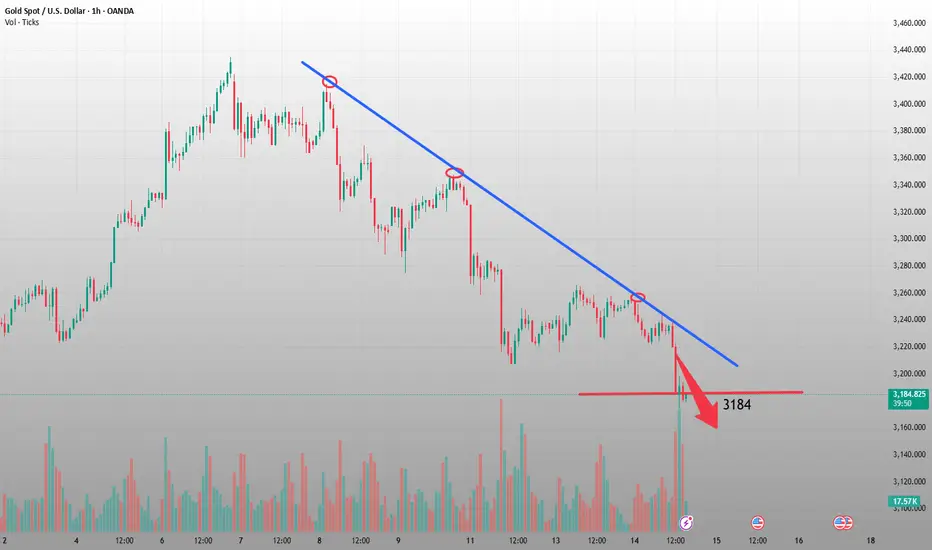
GOLD set for another drop?As expected in our previous analysis XAUUSD bounced to daily resistance and started to get rejected with a strong momentum in the major direction of the trend. As we see series of lower high formation XAUUSD may continue to drop to daily support level following the long term trend.


XAUUSD FLAG BULLISH PATTERN (HIGHER HIGH) ANLYSISThe XAUUSD Market momentum has made a flag bullish pattern showing the strong uptrend had the confirm targets at different zones.
1st Target Zone 3260
Final Target Zone 3350
resistance level: 3100
Conclusion: If the market momentum moves towards target then hold on your trades but if the market moves against to the target then there is an option of stop loss point active and all the trades should be closed.
XAUUSD Waiting for the huntI will wait for the price to react to the red zone to decide how to enter the trade. I think we are at a crucial time for this. The most beautiful visualization for the continuation of the price movement is a pullback to the red zone and a continuation of the decline.

Will gold rise today?Hello everyone. Let's discuss the trend of gold this week. From the current 1-hour chart range, gold is at risk of falling again to 3200.
The current 1-hour chart range has been broken. After breaking the range support today, it has rebounded again, so the previous support has become a suppression position.
Therefore, if gold cannot stand above 3250, then we must be careful of the risk of gold testing 3200.
You can focus on 3240-3250. As long as it cannot stand above 3250, you can sell gold at 3240-3250. The target below is still around the bottom of the range 3200.

Gold fell below 3200 as expected. How to operate gold?An overall bearish trend of consecutive negative and single positive declines is formed. The double top above 3400 is suppressing the decline, and a top shape structure of a large M head is formed. The key lies in whether a substantial breakthrough can be formed at the previous low of 3200. Once it breaks down, the space below will be opened up, and the other half of the M head will continue to extend downward. At that time, the daily level may usher in an accelerated decline.
At present, gold has broken through 3200 and has been exploring downward. We have said before that we have been emphasizing that gold is mainly short. Keep paying attention to the trend of gold. Today's successful prediction of the trend of gold has been very rewarding. Keep up with my pace and you will definitely gain something. In the future, gold will still be mainly short. Go short immediately after the rebound
XAUUSD A place to decideWe will be ready to buy or sell. The price is at a decisive level and we will have to wait and see how the price reacts to it. It won't take long

Will gold continue to rise?Hello everyone. Let's discuss the trend of gold this week. If you have a different opinion, you can express your thoughts in the comment area. At present, the first important position of gold is around 3295, and the second is 3320-3330.
3295 is the 382 position of gold in this round. If the rebound does not pass here, then if it falls again next, it is very likely to break the support of 3200.
The second is 3320-3330, which is the gap on Monday. If it goes up, the possibility of filling the gap is also very high.
So, next pay attention to the two positions I mentioned above, 3295 and 3320-30. If you want to sell gold, it is best to wait for these three price positions.

XAUUSD GOLD LONG/BUYBy utilizing Fibonacci retracement levels, historical patterns, , we can formulate a hypothesis that the market might follow a similar trajectory if bullish sentiment prevails.

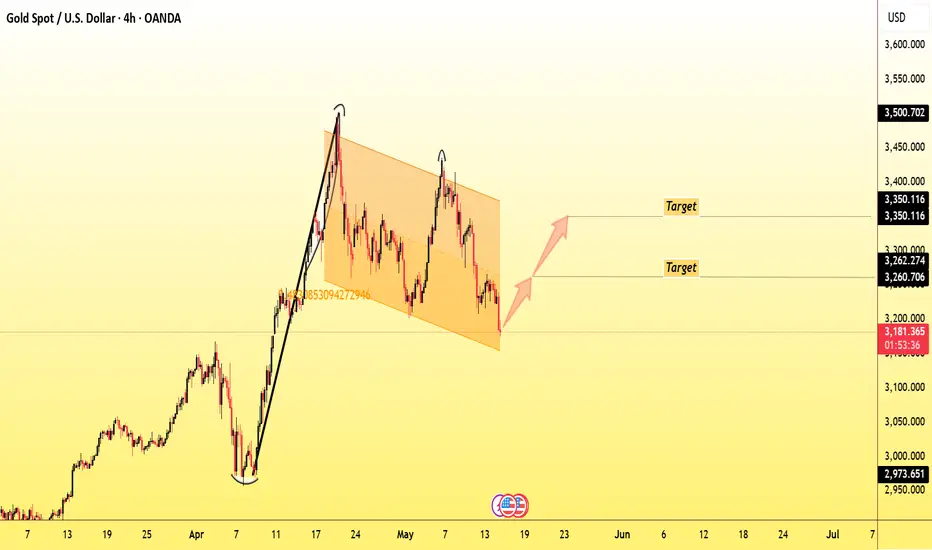
XAUUSD/GOLD WEEKLY BUY PROJECTION 11.05.25Pattern: A bullish pennant pattern has formed, signaling a potential upward continuation.
Breakout Confirmation: Price has broken the daily short-term downtrend line and is retesting the breakout zone, which suggests potential for a strong upward move.
Support & Resistance Zones:
Support Levels: S1 (≈ 3325), S2 (~3270)
Resistance Levels: R1 (~3350), R2 (~3375), ATH & Resistance 3 (~3425)
Entry Zone: Price is in a buy zone, reinforced by a bullish spinning top candlestick and alignment with an uptrend line.
Stop Loss: Placed just below Support S2 (~3270)
Take Profit (tp): Near ATH zone (~3425)
