GOLD Possible bearish movesGOLD Weekly Outlook – Waiting for a Clean Entry
My focus this week on gold is based around the recent mitigation of the 3H supply zone. It was a clean setup, but unfortunately I didn’t get tapped in — and with it being late Friday, I decided to wait for a better entry, potentially on Monday.
As bullish pressure begins to weaken, I’m also keeping an eye on the 4H supply zone above, which could offer a stronger bearish reaction and a better opportunity to sell.
On the flip side, for any potential bullish continuation, I can see price sweeping the liquidity sitting below and then reacting from the 5H demand zone I’ve marked out. That area could provide the base for a re-accumulation and another move to the upside.
Confluences for GOLD Sells:
- Clear bearish reaction from the 3H supply zone with a completed Wyckoff distribution
- Liquidity to the downside remains untapped
- Weakening bullish momentum opens room for a possible sell-off
- DXY is showing short-term bullish strength, supporting a bearish bias on gold
P.S. If price reverses and takes out the current supply zone, I’ll be watching the next 4H supply zone for further reaction — but in the meantime, I’ll adapt by monitoring for a closer demand zone setup.
Have a great trading week ahead and stay sharp, traders!
Xauusdforecast

XAU/USD "The Gold" Metals Market Heist Plan (Swing/Day Trade)🌟Hi! Hola! Ola! Bonjour! Hallo! Marhaba!🌟
Dear Money Makers & Robbers, 🤑 💰💸✈️
Based on 🔥Thief Trading style technical and fundamental analysis🔥, here is our master plan to heist the XAU/USD "The Gold" Metals Market. Please adhere to the strategy I've outlined in the chart, which emphasizes long entry. Our aim is to escape near the high-risk ATR Zone. Risky level, overbought market, consolidation, trend reversal, trap at the level where traders and bearish robbers are stronger. 🏆💸"Take profit and treat yourself, traders. You deserve it!💪🏆🎉
Entry 📈 : "The heist is on! Wait for the NEUTRAL LEVEL breakout (3400) then make your move - Bullish profits await!"
however I advise to Place Buy stop orders above the Moving average (or) Place buy limit orders within a 15 or 30 minute timeframe most recent or swing, low or high level for Pullback entries.
📌I strongly advise you to set an "alert (Alarm)" on your chart so you can see when the breakout entry occurs.
Stop Loss 🛑: "🔊 Yo, listen up! 🗣️ If you're lookin' to get in on a buy stop order, don't even think about settin' that stop loss till after the breakout 🚀. You feel me? Now, if you're smart, you'll place that stop loss where I told you to 📍, but if you're a rebel, you can put it wherever you like 🤪 - just don't say I didn't warn you ⚠️. You're playin' with fire 🔥, and it's your risk, not mine 👊."
📍 Thief SL placed at the recent/swing low level Using the 4H timeframe (3200) Day trade basis.
📍 SL is based on your risk of the trade, lot size and how many multiple orders you have to take.
🏴☠️Target 🎯: 3680 (or) Escape Before the Target
🧲Scalpers, take note 👀 : only scalp on the Long side. If you have a lot of money, you can go straight away; if not, you can join swing traders and carry out the robbery plan. Use trailing SL to safeguard your money 💰.
💰💵💴💸XAU/USD "The Gold" Metals Market Heist Plan (Day / Swing Trade) is currently experiencing a Neutral trend (there is a chance to move bullishness🐂).., driven by several key factors.👆👆👆
📰🗞️Get & Read the Fundamental, Macro economics, COT Report, Geopolitical and News Analysis, Sentimental Outlook, Intermarket Analysis, Index-Specific Analysis, Positioning and future trend targets with Overall Score...... go ahead to check👉👉👉🔗🔗🌎🌏🗺
⚠️Trading Alert : News Releases and Position Management 📰 🗞️ 🚫🚏
As a reminder, news releases can have a significant impact on market prices and volatility. To minimize potential losses and protect your running positions,
we recommend the following:
Avoid taking new trades during news releases
Use trailing stop-loss orders to protect your running positions and lock in profits
💖Supporting our robbery plan 💥Hit the Boost Button💥 will enable us to effortlessly make and steal money 💰💵. Boost the strength of our robbery team. Every day in this market make money with ease by using the Thief Trading Style.🏆💪🤝❤️🎉🚀
I'll see you soon with another heist plan, so stay tuned 🤑🐱👤🤗🤩

GOLD Technical Analysis - Deeper Pullback in PlayOANDA:XAUUSD remains within a broader ascending channel, but recent price action suggests that the market is undergoing a deeper corrective phase. Following a prolonged bullish rally, price appears overextended and is now pulling back more decisively.
This correction aligns with expectations for a healthy retracement after such strong upward momentum. I anticipate that the pullback will extend further toward the $3,160 level, a key technical level defined by the confluence of horizontal support, ascending trendline support, and the 0.618 Fibonacci retracement of the latest bullish impulse.
This zone will be critical for determining whether the broader bullish structure remains intact. If price holds at this level and shows signs of reversal, it may present a strong re-entry opportunity for buyers. However, a decisive break below this zone would invalidate the current bullish structure and open the door to a deeper correction.
Always confirm your setups and trade with a proper risk management.
Best of luck!

Can gold continue its decline and hit a new low?US President Trump said he had no intention of firing Fed Chairman Powell. Affected by this, the US dollar soared in the short term and spot gold plummeted dramatically. This remark marks a huge change in Trump's attitude. He has recently stepped up his criticism of Powell and refused to rule out the possibility of taking the unprecedented step of firing Powell.
Gold technical analysis: This wave of gold correction is still continuing. The market has actually warned about today's pullback. After all, yesterday's closing line was a big negative line, so there must be a continuation in the trend of gold. Moreover, after gold rose to 3500 yesterday, the trend weakened. The market fell all the way and broke through the 3400 mark and 3300 mark, and fell to the lowest level of 3290! To be honest, this round of decline is still quite strong. After breaking the continuous positive, the market ushered in the suppression of the market pullback, and at present, there is still a trend of continuation!
In terms of short-term operation ideas for gold, it is recommended to sell short. The short-term focus on the upper side is 3320-3330 resistance, and the short-term focus on the lower side is 3285-3245 support.

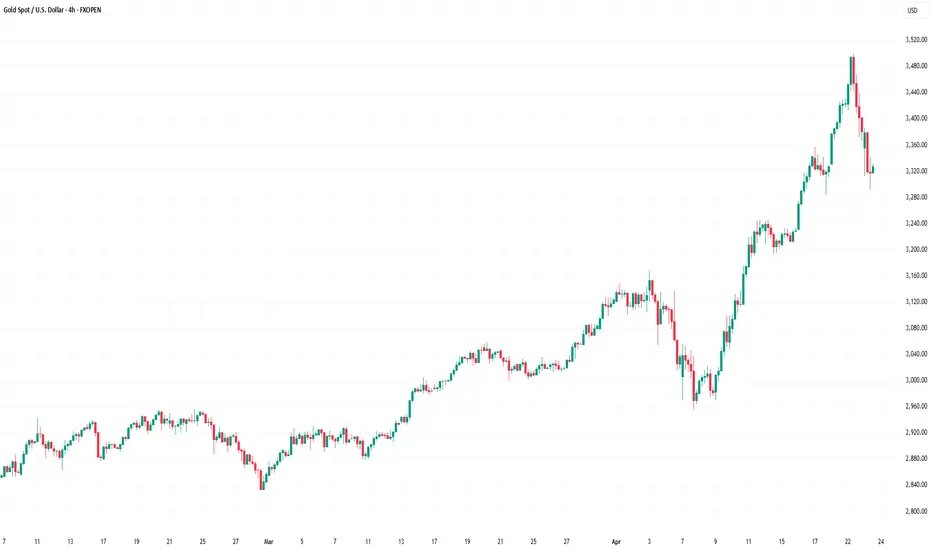
Gold Price Plunges After Climbing to $3,500 for the First TimeGold Price Plunges After Climbing to $3,500 for the First Time
As the XAU/USD chart shows:
→ Yesterday, the spot gold price stopped just a few cents short of the key psychological level of $3,500 (and even exceeded it on the futures market);
→ But this morning, an ounce is trading around $3,300, having dropped aggressively by more than 5%.
Why Did Gold Suddenly Drop?
The sharp decline followed a shift in rhetoric from President Trump. According to Reuters:
→ The US President backed away from threats to dismiss Federal Reserve Chair Jerome Powell;
→ He also signalled a more moderate stance on tariffs against China.
Market participants interpreted this as a reason to take profits on long positions, as the softened tone from the White House reduced demand for safe-haven assets. As a result, gold collapsed from its historic high, while the US dollar index rebounded from multi-month lows.
Technical Analysis of the XAU/USD Chart
Gold price fluctuations have formed an upward channel (highlighted in blue), with key reversal points marked for constructing the channel. From this perspective, one interpretation is that the upper boundary marked a price area where gold was extremely overbought. Now, the imbalance in market sentiment may be driving the price back towards the median, where supply and demand tend to stabilise.
And although the $3,300 level is currently acting as support, the XAU/USD chart reveals several signs suggesting that bears are taking control:
→ The price has dropped by approximately $200 in less than two days;
→ A bearish Fair Value Gap has formed during the decline (highlighted by a rectangle) – a pattern typically interpreted as sellers outweighing buyers;
→ The steep purple ascending channel has been broken.
It can be assumed that even if the fundamental backdrop offers reasons for a short-term price recovery, this may prove to be only a temporary bounce following a sharp shift in sentiment towards bearishness at the start of the current week.
This article represents the opinion of the Companies operating under the FXOpen brand only. It is not to be construed as an offer, solicitation, or recommendation with respect to products and services provided by the Companies operating under the FXOpen brand, nor is it to be considered financial advice.
The first negative line after three consecutive positive linesThe current gold market is facing dual drivers of policy and fundamentals. Trump's tariff policy trend has become a key variable. Coupled with expectations of a slowdown in the US economy in 2025 and rising global geopolitical risks, safe-haven demand continues to support gold prices.
Gold technicals show the first small negative line after three consecutive positive lines, and the correction signal is to be confirmed. The intraday shock adjustment is obvious, and the magnetic effect of the 3235-3200 range is significant. It is recommended to maintain the range thinking at the operational level. The upper resistance is currently at 3232-3235, and the lower support is at 3200-3195. Wait for the key guidance on Wednesday to clarify the direction. The market is in a sensitive period of market change, and it is necessary to focus on the pulsed impact of policy dynamics and geopolitical risk evolution on gold prices.
Operation strategy 1: It is recommended to rebound to 3233-3237 short, stop loss 3245, and the target is 3210-3200.
Operation strategy 2: It is recommended to pull back to 3190-3185 long, stop loss 3178, and the target is 3210-3230.

Gold is strong and faces adjustments today!For gold today, the morning surge and fall broke the pattern of the morning cycle rise, which means that this wave of unilateral rise from 3211 to 3357 can temporarily come to an end. This time the whole increase was as high as 146 US dollars, and there was no correction throughout the whole process. This kind of extreme market situation is rare in history. The bold ones will die of overeating and the timid ones will starve to death. It is very suitable for novices who have just entered the market. Blindly chasing more will have a miraculous effect, which is the so-called novice protection period.
As the market will be closed tomorrow for Easter, gold is destined not to rise like yesterday, but will enter a period of shock correction. The decline from 3357-3320 reached 37 US dollars, so focus on the pressure of 3342 and try to participate in the short position to see the decline. The strong pressure is at the high point of 3356-3357. If it does not break the high during the day, you can still go short; the support below is 3320-3305. If it touches 3305, you can go long to see the rebound.

Gold trading ideas for todayHello everyone. Let's discuss the trend of gold this week. It can be seen that gold has retreated to around 3452, and 3452 is also the support position of the AM10 moving average.
The next operation is actually very simple. If gold stabilizes at 3445-3430, it should continue to buy.
If it falls below 3430, then you need to wait for around 3400 to buy.
There is no need to look too far for the upper target price. Continue to look at the high point of 3500, or even the new high of 3520.

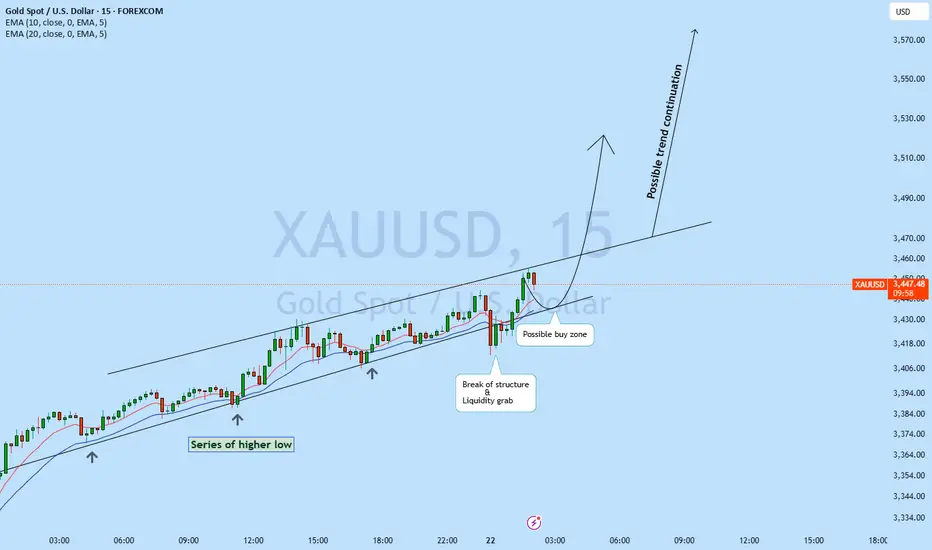
XAUUSD possible buy zone!XAUUSD is moving in the major direction of the rend with series of higher high and higher low
with multiple liquidity grab. Currently upon daily close, there has been a break of structure with strong liquidity grab giving this instrument a strong probability to move back to the upside with new moment. Upon pullback to the trend line is an area looking to buy upon price action confirmation.
Is there a chance that gold will fall?Hello everyone. Let's discuss the trend of gold. Currently, the support of gold is around 3380. If the correction of gold is weak, it may continue to rise after testing 3380.
On the contrary, if it falls below 3380, then gold has a probability to continue to test the low support position near 3370.
Finally, there is the 4-hour support position of 3360-3350.
Therefore, try to pay attention to the support situation here at 3380 first. If there is a chance to reach this point and stabilize, gold will have the opportunity to continue to look at 3420 and 3435.
On the contrary, if it falls below 3380, then you need to continue to wait for the low point of 3370, or even the high point of Friday at 3360-3350 to buy.

Will gold experience a sharp drop?Hello everyone. Let's discuss the trend of gold today. If you have other ideas, you can express your different ideas in the comment area. Today, gold continued yesterday's upward trend and set a new record high of 3357!
But we need to be extra careful at present, because tomorrow Friday is closed all day, which means that today Thursday is the last trading day of this week. Currently, long positions in gold are likely to be profit-taking.
Once the long positions are profit-taking, it is easy to have a large retracement, so you must be careful about this and do not buy too much.
From the hourly chart:
Today's high point was 3357 and once retreated to around 3313. It can be found that since it fell below the opening price of 3342, gold has not stood above 3342 again.
This is a strong short-term retracement signal, especially when the long positions are about to be profit-taking.
Moreover, the hourly chart is currently a bit of abc wave retracement. Once it comes down, I think it is not a problem to touch 3300, and it is not ruled out that it will be lower.
At present, the MA10 moving average position below gold is also at 3300-3280.
Therefore, it is not recommended to chase long orders today, and you should be prepared for the possibility of falling to 3300-3280 in advance.
In terms of operation, I suggest that you can maintain the entry and short near 3340, and the target can be 3300-3280.

Gold Price Surpasses $3,300 for the First Time in HistoryGold Price Surpasses $3,300 for the First Time in History
Just six days ago, we highlighted the historic breakthrough of the $3,200 level for the first time. Now, as the XAU/USD chart shows today, the price of an ounce of gold on global exchanges is fluctuating above $3,300.
Bullish sentiment is being driven by a weakening US dollar and rising trade tensions between the United States and China, which are boosting gold’s appeal as a safe-haven asset. In response to these developments, Goldman Sachs analysts have raised their year-end 2025 forecast to $3,700.
However, technical analysis is beginning to flash some bearish signals.
Technical Analysis of XAU/USD
Using the latest data, we have drawn an ascending channel on the hourly chart that more accurately reflects price action since 8 April. Initially, the price moved within a narrow range, but after breaking the S-line, it found support (indicated by an arrow) at the lower boundary of the channel.
At present, there are signs of fading upward momentum in the gold market, as the price:
→ is failing to reach the median line (marked with a symbol);
→ is falling below the lower boundary of the channel.
After a rally of over 26% since the beginning of the year, the market may now be heavily overbought, and a correction could help “let off steam”. In this case, a test of the $3,250 level cannot be ruled out.
This article represents the opinion of the Companies operating under the FXOpen brand only. It is not to be construed as an offer, solicitation, or recommendation with respect to products and services provided by the Companies operating under the FXOpen brand, nor is it to be considered financial advice.

GoldXAUUSD
- Completed " 12345 " Impulsive Waves
- Break of Structure
- RSI - Divergence
- Bullish Channel as an corrective pattern in Short Time Frame
- Change of Characteristics

Will gold fall today?Hello everyone. Let's discuss the trend of gold this week. From the current daily chart, gold is currently in a five-wave upward trend.
You can see that the low point of gold last week was near 2955, which is exactly the top position of the first wave of this wave.
The retracement from 3167 to 2955 is the retracement of the fourth wave, and the retracement did not break the top position of the first wave near 2950.
So, the current trend from near 2955 is running in the fifth wave of rise.
I also drew it in the picture, and it may eventually reach the high point near 3308-3328.
Today's highest point reached near 3275, and then it retreated sharply to near 3256.
Maybe you think this is a high and fall, but I don't think so from the trend.
Gold opened at 3230. If you look at the trend of 3230-3275, you can find that 3255 is exactly the 618 support position of this trend.
If the retracement does not break 618, then there will definitely be a new high.
Using 123 to find 4, we can see that if the high point of 3290 continues to break, the subsequent high point will be around 3300, followed by 3328.
And 3300 coincides with the daily high above.
Therefore, if gold can reach around 3300 next, we must be careful of the possibility of a high fall.

Gold Maintains Weekly Bullish Structure Amid PullbackGold Weekly Technical Outlook
Gold (XAU/USD) remains in a clear bullish trend on the weekly chart, currently trading around $3,230. After marking a new high, price action suggests a potential pullback—a healthy retracement that could set the stage for further gains.
Key Levels to Watch:
Current Price: $3,230
Retracement Zone:
First support at $3,100, a recent consolidation level
Deeper support between $2,950 – $2,900, aligned with prior breakout structure and strong demand from earlier in the trend
These levels are key for a potential bounce, as they mark high-probability zones for buyers to re-enter the market.
Upside Targets:
Short-term resistance: $3,280
Primary target (by mid-May): $3,400
This level aligns with the projected extension of the ascending structure and continuation of bullish momentum
Technical Outlook:
As long as gold holds above $2,900, the weekly bullish trend remains intact. A rebound from the retracement zone would likely lead to a renewed rally targeting the $3,400 region.

GOLD Analysis: Will buyers push toward 3,230?OANDA:XAUUSD continues to trade within a clearly defined ascending channel, with price action consistently respecting both upper and lower boundaries. The recent price action suggests buyers are currently in control, indicating the potential for continued upside.
Given the strength of the current bullish momentum, there is a strong likelihood that price may break above the key resistance zone. If that happens, it could come back to retest the level as support before continuing higher. A successful retest would reinforce the bullish structure and open the door for a potential move toward the 3,230 target, which aligns with the channel’s upper boundary.
However, if price fails to break above the resistance zone, it could signal weakening bullish momentum and open the door for a deeper pullback toward the lower boundary of the ascending channel.
Always confirm your setups and manage your risk accordingly.
Best of luck!

XAU 1M Gold price formation history and future expectationsGold , or as denote the main trading pair XAUUSD , has been gaining a lot of attention around itself in recent years.
As soon as major analysts or hedge fund top-managers begin to say that the next crisis is near, investors immediately start buying gold as a defensive asset, and its price, accordingly, goes up.
Let's walk a little through the history of the Gold price.
We finished drawing the graph, to what exists on tradingview.com, based on the data that is freely available.
1) In 1933, to overcome the crisis after the "Great Depression", US President Roosevelt issued a decree on the confiscation of gold from the population. The price for an ounce of gold is set at $20.66.
2) In 1971, a real rise in the value of gold begins. After decoupling the US dollar rate from the "gold standard", which regulated the cost of 1 troy ounce of gold at $35 for a long period from 1934 to August 1971.
3) 1973 - "The First Oil Crisis" and the rise in the value of gold from $35 to $180 - as the main anti-crisis instrument, a means of hedging investment risks.
4) 1979-1980 Islamic Revolution in Iran (Second Energy Crisis). The cost of gold, as the main protective asset, in a short period of time grows more than 8 times and sets a maximum at around $850
5) During 1998-2000, the world swept through: the "Asian economic crisis", defaults in a number of countries, and the cherry on the cake - the "Dotcom Bubble". During this period, the price of gold was twice aggressively bought out by investors, from the level of $250. It was a clear signal - there will be no lower, next, only growth!
6) And so it happened, from 2001 to 2011 there was an increase in the value of gold from $250 to $1921 . Even the mortgage crisis of 2008 could not break the growth trend, but only acted as a trigger for a 30% price correction.
Looking at the XAUUSD chart now, one can assume that large investors were actively buying gold in the $1050-1350 range during 2013-2019.
It is hard to believe that investors who have been gaining long positions for 6 years will be satisfied with such a small period of growth in 2019-2020.
For ourselves, we establish a Gold purchase zone in the range of $1527-1600 per troy ounce, from where we expect the growth trend to continue to the $3180-3350 region
What are your views on the future price of gold? Share them in the comments!

Gold Price Surpasses $3,200 for the First Time in HistoryGold Price Surpasses $3,200 for the First Time in History
According to the XAU/USD chart today, the price of an ounce of gold is fluctuating above the $3,200 level on global exchanges — a level never reached before.
Since the beginning of 2025, gold has gained approximately 22%.
Why Is Gold Rising Today?
Today’s bullish momentum in the gold market is driven by two key factors.
First, inflation data. Figures released yesterday for the CPI (Consumer Price Index) revealed a slowdown in inflation in the United States. This suggests a greater likelihood of monetary policy easing by the Federal Reserve. According to Reuters, gold prices now reflect expectations of three interest rate cuts by the end of 2025 — and lower rates typically support a stronger XAU/USD.
Second, fears of a global recession. Although US President Donald Trump has introduced a 90-day delay on the implementation of international trade tariffs, this does not apply to China, where tariffs have been increased to a striking 145%. Traders fear that Beijing could retaliate by raising tariffs on US goods beyond the current 84%.
Technical Analysis of XAU/USD
At present, the gold market is showing strong upward momentum, which began in early March (as illustrated by the blue trend channel). Key points include:
→ A breakout above the upper boundary of the channel;
→ The RSI indicator suggests a potential bearish divergence forming.
This points to the possibility of a short-term pullback into the blue channel, which would be a natural correction — especially considering the rapid $200 surge from $3,000 to $3,200 over just two days. However, given the current news backdrop, it seems unlikely that the bulls will relinquish control anytime soon.
This article represents the opinion of the Companies operating under the FXOpen brand only. It is not to be construed as an offer, solicitation, or recommendation with respect to products and services provided by the Companies operating under the FXOpen brand, nor is it to be considered financial advice.

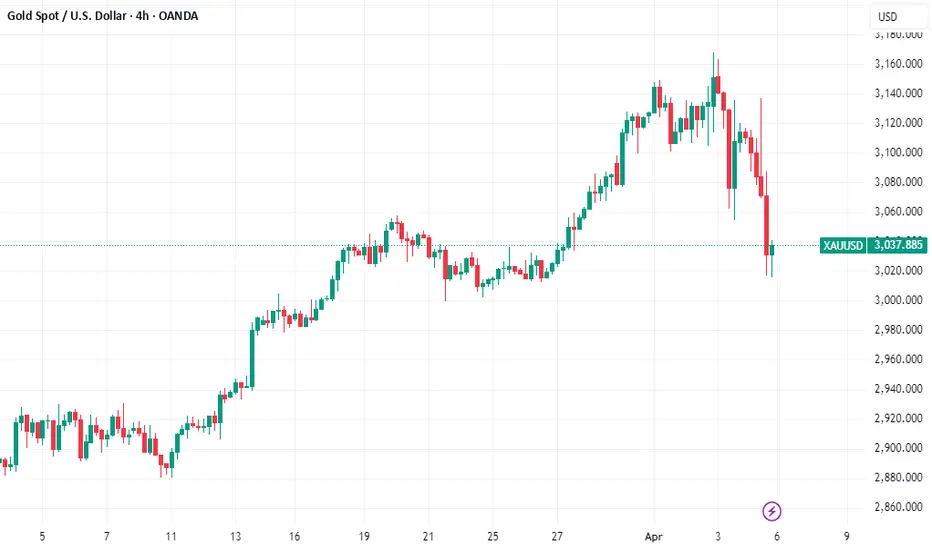
Gold's Downtrend PersistsGold's Bearish Outlook Continues Despite Temporary Upside Spike
Market Overview:
The overall outlook for gold remains bearish, even though the market recently experienced a surprising and sharp upward movement. While a deep correction was anticipated and in line with prior expectations, the nature and timing of the recent surge raised some eyebrows among analysts and traders alike.
The unexpected bullish reaction came shortly after former U.S. President Donald Trump announced a 90-day suspension on reciprocal tariffs—a development that typically would not warrant such a dramatic price rally in gold. Normally, easing geopolitical or economic tensions would dampen safe-haven demand, causing gold to retreat. In this case, however, the opposite occurred, which suggests the possibility of non-fundamental drivers at play, potentially even artificial market influence or manipulation.
Technical Outlook:
Despite the sudden upward movement, gold’s larger technical structure has not changed significantly. The overall trend remains bearish unless we see a sustained breakout above the 3167 resistance level. A clean breach above that threshold would be uncharacteristic based on current fundamentals and could indicate external interference or speculative overreaction rather than a genuine shift in sentiment or macroeconomic conditions.
The price action continues to favor the bears, with lower highs and lower lows still forming on the larger timeframes. Until there’s clear evidence to the contrary, any rallies should be viewed with skepticism and treated as potential selling opportunities rather than the start of a new bullish trend.
Key Support Zones:
Looking at potential areas where gold may find some temporary footing, the following support levels should be closely monitored:
3054 – Minor support; could serve as a short-term pause point.
3000 – A psychological level and round number that often acts as a magnet for price action.
2925 – More significant historical support zone with prior buying interest.
2840 – Deeper support, aligning with the longer-term bearish trajectory.
Conclusion:
In summary, while gold has shown a sudden upward burst, the broader picture remains cautious. The technical indicators, market context, and recent price behavior all point toward a continuation of the downtrend unless key resistance levels are convincingly breached. Traders are advised to remain vigilant, avoid emotional reactions to short-term volatility, and refer closely to technical signals when making decisions.
The chart provides further clarity on this setup—feel free to review it for a more visual representation of the analysis.
Thank you for reading, and best of luck in the markets!

Market Analysis: Gold Crashes As Trade War EscalatesMarket Analysis: Gold Crashes As Trade War Escalates
Gold price started a fresh decline below $3,050.
Important Takeaways for Gold Price Analysis Today
- Gold price climbed higher toward the $3,150 zone before there was a sharp decline against the US Dollar.
- A key bearish trend line is forming with resistance near $3,068 on the hourly chart of gold at FXOpen.
Gold Price Technical Analysis
On the hourly chart of Gold at FXOpen, the price climbed above the $3,050 resistance. The price even spiked above $3,150 before the bears appeared.
A high was formed near $3,167 before there was a fresh decline. There was a move below the $3,100 support level. The bears even pushed the price below the $3,000 support and the 50-hour simple moving average.
It tested the $2,970 zone. A low is formed near $2,970 and the price is now showing bearish signs. There was a minor recovery wave above the 23.6% Fib retracement level of the downward move from the $3,167 swing high to the $2,970 low.
However, the bears are active below $3,050. Immediate resistance is near $3,040. The next major resistance is near the $3,068 zone and a key bearish trend line. It is close to the 50% Fib retracement level of the downward move from the $3,167 swing high to the $2,970 low.
The main resistance could be $3,135, above which the price could test the $3,165 resistance. The next major resistance is $3,200.
An upside break above the $3,200 resistance could send Gold price toward $3,250. Any more gains may perhaps set the pace for an increase toward the $3,320 level. Initial support on the downside is near the $3,000 level.
The first major support is near the $2,970 level. If there is a downside break below the $2,970 support, the price might decline further. In the stated case, the price might drop toward the $2,950 support.
This article represents the opinion of the Companies operating under the FXOpen brand only. It is not to be construed as an offer, solicitation, or recommendation with respect to products and services provided by the Companies operating under the FXOpen brand, nor is it to be considered financial advice.

XAUUSD breakdown?XAUUSD possibly break below as market opened with gap and the price started to drop from the most important level. Past week with NFP price has rejected with a head & shoulder formation and signaling possible change of trend. In a way price is moving it may respect 3051.00 level and may continue to drop for possible long term change of trend.

Gold Price Drops on Tariff Selloff
Gold, long considered a safe-haven asset during times of economic uncertainty, experienced a sharp reversal of fortune this Friday, tumbling as much as 2.4% and extending losses from the previous session. This significant decline came as a surprise to many who had witnessed the precious metal steadily climb to record highs in recent weeks, fueled by persistent inflation concerns, geopolitical instability, and expectations of easing monetary policy. However, the resurgence of tariff anxieties has triggered a broad selloff across various asset classes, including gold, as investors recalibrate their risk exposure in the face of heightened economic uncertainty.1
The catalyst for this sudden shift in market sentiment has been the renewed threat of escalating trade tensions.2 While the specifics of the "tariff shock" are crucial in understanding the market reaction, the general principle is that the imposition or threat of tariffs can disrupt global supply chains, increase costs for businesses and consumers, and ultimately dampen economic growth.3 This increased uncertainty and the potential for negative economic consequences have prompted investors to reassess their portfolios and, in many cases, reduce their exposure to assets perceived as riskier or less liquid, even those traditionally considered safe havens.4
Gold's traditional role as a safe haven stems from its historical use as a store of value, its limited supply, and its lack of correlation with traditional financial assets during periods of stress.5 In times of economic turmoil, investors often flock to gold as a hedge against inflation, currency devaluation, and market volatility.6 This flight to safety typically drives up the price of bullion.7
However, the current market reaction suggests a more nuanced dynamic at play. The tariff shock appears to have triggered a broader reassessment of risk, leading to a selloff that encompasses not only equities and other riskier assets but also traditional safe havens like gold. Several factors could be contributing to this phenomenon.
Firstly, the prospect of tariffs can lead to concerns about slower global growth.8 If economic activity contracts, it could reduce overall demand, potentially impacting even safe-haven assets like gold, particularly if investors anticipate lower inflation in the long run. While gold is often seen as an inflation hedge, a significant deflationary shock could negatively affect its price.
Secondly, the imposition of tariffs can create uncertainty about future economic policies and international relations.9 This uncertainty can lead to increased volatility across all asset classes, prompting investors to reduce overall exposure and move towards cash or other highly liquid assets. In such scenarios, even assets perceived as safe havens might be sold off as part of a broader de-risking strategy.
Thirdly, the recent run-up in gold prices to record highs might have made it a target for profit-taking. After a significant rally, any negative news or shift in market sentiment can trigger a wave of selling as investors look to lock in gains. The tariff shock could have provided the catalyst for such profit-taking, exacerbating the downward pressure on gold prices.
Furthermore, the interconnectedness of global financial markets means that negative sentiment in one area can quickly spread to others.10 The fear of a trade war can impact equity markets, leading to margin calls or a general desire to reduce risk across portfolios, which could include selling gold holdings.
The extent of the gold selloff – a 2.4% drop in a single day is significant for a traditionally stable asset – underscores the severity of the market's reaction to the tariff news. This move also highlights the fact that even safe-haven assets are not immune to broad market dislocations and shifts in investor sentiment.
Looking ahead, the trajectory of gold prices will likely depend heavily on how the tariff situation unfolds and its actual impact on the global economy. If the tariff threats escalate into a full-blown trade war with significant negative consequences for growth and corporate earnings, we could see further volatility across all asset classes. In such a scenario, the initial reaction might be continued selling pressure on gold as investors prioritize liquidity and de-risking.
However, if the economic fallout from tariffs becomes more apparent and concerns about stagflation (slow growth with high inflation) resurface, gold's traditional safe-haven appeal could reassert itself. In a stagflationary environment, gold could once again become an attractive asset as a hedge against both economic stagnation and the erosion of purchasing power.
Moreover, any signs of easing monetary policy by central banks in response to slowing economic growth could also provide support for gold prices. Lower interest rates reduce the opportunity cost of holding non-yielding assets like gold and can also be inflationary in the long run.
In conclusion, the recent tumble in gold prices following the tariff shock demonstrates that even traditional safe-haven assets are susceptible to broad market selloffs triggered by significant economic uncertainties. The initial reaction appears to be driven by a general de-risking across asset classes and potential profit-taking after gold's recent record highs. However, the future performance of gold will depend on the evolving economic landscape, the actual impact of tariffs, and the response of monetary policy. While the immediate reaction has been negative, gold's role as a potential hedge against economic turmoil and inflation could see it regain its footing if the negative consequences of the tariff shock become more pronounced. Investors should closely monitor developments in trade policies and their broader economic implications to gauge the future direction of gold prices. The current volatility serves as a reminder that even in the realm of safe havens, market dynamics can shift rapidly and unexpectedly.
XAUUSD/GOLD RESISTANCE R1 & NEW ATH PROJECTION 01.04.25The green area represents the profit target (TP1).
The red area below indicates the stop-loss level.
The black zig-zag line suggests an expected price movement.
