Gold (XAU/USD) Long Setup: First Swing of the Year Amid NFP WeekI initiated a long position on Gold (XAU/USD) following a retracement to the 0.6 Fibonacci level on the 8-hour timeframe. This setup marks the first swing trade on Gold this year, targeting the $2,680-$2,687 price zone. Gold opened the year on a bullish note, aligning with mid-range technicals. This trade reflects a mid-term outlook, aiming to capitalize on potential momentum driven by this week’s major macroeconomic events, including the Nonfarm Payrolls (NFP) release and the FOMC’s intervention.
Fundamentals:
The Federal Reserve’s hawkish tone, suggesting a slowdown in interest rate cuts for 2025, is providing upward pressure on US Treasury bond yields. However, these signals are driving flows away from non-yielding assets like Gold. Alongside geopolitical risks and trade war fears, this creates a complex backdrop for Gold. Additionally, the pullback in the US Dollar from its November highs is offering some support for the precious metal. Traders will closely monitor Friday’s NFP report and the December FOMC meeting minutes for further direction.
Key bullish themes for metals:
• Rising inflation expectations and the Fed’s pause in rate hikes support Gold.
• China’s green initiatives boost demand for metals.
• Interest rate cuts could provide further upside for Gold.
• Stagflation fears increase Gold’s attractiveness as a safe-haven asset.
Technicals:
• Entry: Positioned after a 0.6 Fibonacci retracement.
• Target Zones: $2,680 - $2,687.
• Timeframe: 8-hour chart, aligning with the mid-range strategy.
• Outlook: Maintaining a close watch on price action, especially with upcoming macro releases that could create volatility.
Let’s keep the momentum strong and pay attention to market signals. Stay focused, and as always, pay yourself!
Note: Please remember to adjust this trade idea according to your individual trading conditions, including position size, broker-specific price variations, and any relevant external factors. Every trader’s situation is unique, so it’s crucial to tailor your approach to your own risk tolerance and market environment.
Xauusdforecast

Gold price up on safe-haven buying amid U.K. budget woesGold and silver prices are higher in early U.S. trading Thursday, on some fresh safe-haven demand due to a budget crisis in the U.K. that may spread. February gold was last up $18.10 at $2,690.50 and March silver was up $0.36 at $31.05. U.K. financial markets tumbled overnight on growing worries over the government’s budget deficit, with the British pound hitting the lowest level in more than a year against the U.S. dollar. The 10-year U.K. gilt yield jumped to 4.92% and the FTSE 250 Index dropped for a third day in a row. This situation is being closely watched by the global marketplace, which is worried about a ..

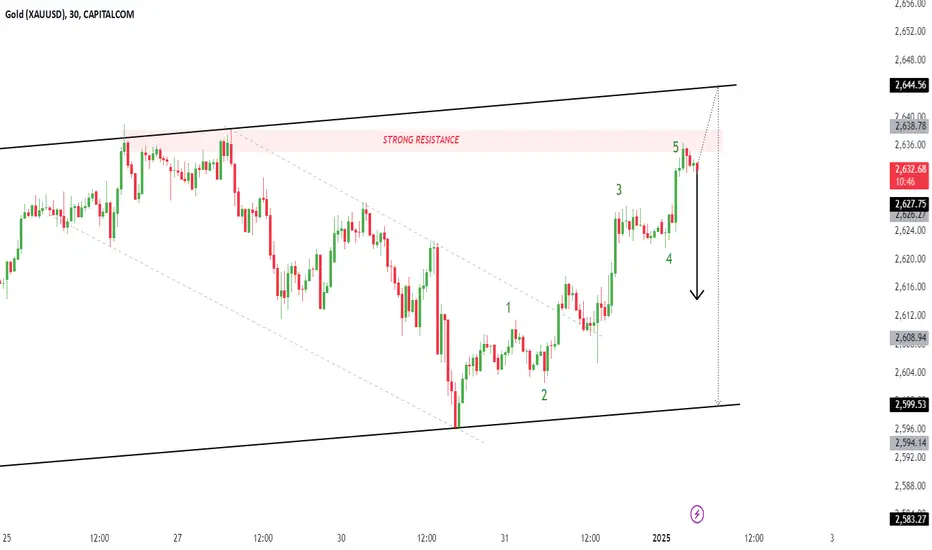
GoldXAUUSD ( Gold / U.S Dollar )
Symmetrical Triangle with the Breakout of UTL and Retest
Strong Resistance Level
Change of Characteristics
Completed " 12345 " Impulse Waves
Bullish Channel as an Corrective Pattern in Short Time Frame

XAUUSD Short Right Now!!!Some PRICE ACTION with FIB Retracement behind & Support/Resistance level!
I have no more to explain everything is described on the chart! Good Luck!

GoldXAUUSD ( Gold / U.S Dollar )
Bullish Channel as an Corrective Pattern in Short Time Frame
Demand Zone
Break of Structure
Completed " 12345 " Impulsive Waves and " AB " Corrective Waves
Change of Characteristics

XAUUSD/GOLD 1H BUY PROJECTION 07.01.25Import costs and currency fluctuations - Differences in currency exchange rates and higher import costs have contributed to rising gold prices in other regions. Local taxes, market conditions, and logistical challenges also add to the disparity between Indian and global rates.

XAUUSD GOLD 1H BUY PROJECTION 07.01.25With inflation issues looming and global uncertainty causing more investors to become interested in gold bars and coins, gold exchange-traded funds (ETFs) and gold individual retirement accounts (IRAs), rising demand for the precious metal helped to drive rapid price increases, leaving experts speculating the price

GoldXAUUSD ( Gold / U.S Dollar )
Exp Fiat as an Corrective Pattern in Short Time Frame
Break of Structure
Change of Characteristics
Point of Interest ( POI )
Completed " 12345 " Impulsive Waves

GoldXAUUSD ( Gold / U.S Dollar / U.S Dollar )
Change of Characteristics
Fibonacci Level - 261.80%
Symmetrical Triangle as an Corrective Pattern in Short Time Frame
Break of Structure
Completed " 12345 " Impulsive Waves

GoldXAUUSD ( Gold / U.S Dollar )
Completed " 12345 " Impulsive Waves
Fibonacci Level - 61.80% / 161.8%
Order Block
Break of Structure
Exp Fiat as an corrective pattern in Long Time Frame

GoldXAUUSD ( Gold / U.S Dollar )
Completed " 12345 " Impulsive Waves
Break of Structure
Bullish Channel as an corrective pattern in Short Time Frame
Resistance Level
Change of Characteristics
XAUUSD Possible bounce to resistance line!XAUUSD has created a strong up trending market structure on the lower timeframe. Weekly price action just has got bounce we may see the price bouncing back to the upside to the weekly liquidity zone at 2651.06. As of on 1 hour timeframe the price already has created smooth uptrend, price may continue to rise in the upcoming sessions.

S&P CoreLogic Case-Shiller Index records 3.6% annual gain S&P CoreLogic Case-Shiller U.S. National Home Price NSA Index, covering all nine U.S. census divisions, reported a 3.6% annual return for October, down from a 3.9% annual gain in the previous month. The 10-City Composite saw an annual increase of 4.8%, down from a 5.2% annual increase in the previous month. The 20-City Composite posted a year-over-year increase of 4.2%, dropping from a 4.6% increase in the previous month. New York again reported the highest annual gain among the 20 cities with a 7.3% increase in October, followed by Chicago and Las Vegas with annual increases of 6.2% and 5.9%, respectively. .

GoldXAUUSD ( Gold / U.S Dollar )
Break of Structure
Completed " 12345 " Impulsive Waves and " A " Corrective Waves
Fibonacci Level - 78.60%
Demand Zone
Bearish Channel as an Corrective Pattern in Short Time Frame

XAUUSD Top-down analysis Hello traders, this is a complete multiple timeframe analysis of this pair. We see could find significant trading opportunities as per analysis upon price action confirmation we may take this trade. Smash the like button if you find value in this analysis and drop a comment if you have any questions or let me know which pair to cover in my next analysis.

Is Gold the Best Investment in a Mixed Metals Market?Gold Shines in a Mixed Year for Metals Markets
In 2024, gold emerged as a standout performer in the often-volatile metals markets. While other metals experienced a mixed bag of results, gold surged by an impressive 27%, defying the broader market trends. This bullish run can be attributed to a confluence of factors, including US monetary easing, heightened geopolitical tensions, and strategic central bank purchases.
A Year of Contrasting Fortunes
The performance of base metals in 2024 presented a more nuanced picture. While some base metals witnessed healthy gains, others struggled. Iron ore, a key ingredient in steel production, witnessed a significant decline, and lithium, often touted as the white gold of the electric vehicle revolution, also faced headwinds.
Gold's Allure: A Haven in Uncertain Times
Gold's resilience throughout 2024 can be ascribed to its inherent characteristics as a safe-haven asset. When economic or political uncertainty clouds the horizon, investors often flock to gold, perceiving it as a store of value that can weather market storms.
• US Monetary Easing: In 2024, the US Federal Reserve implemented a series of monetary easing measures, injecting liquidity into the financial system and lowering interest rates. This dovish stance by the Fed weakened the US dollar, making gold, a dollar-denominated asset, more attractive to international investors.
• Geopolitical Upheaval: The year 2024 was marked by a heightened sense of geopolitical instability. Trade tensions, regional conflicts, and concerns over global security fueled investor anxieties. Gold, perceived as a hedge against geopolitical risks, benefited from this flight-to-safety bid.
• Central Bank Buying Spree: Central banks around the world were significant buyers of gold in 2024. This strategic accumulation by central banks bolstered investor confidence in the yellow metal, further solidifying its position as a valuable reserve asset.
The Road Ahead: A Look at 2025
As we enter 2025, the outlook for metals markets remains shrouded in some uncertainty. However, several key factors are likely to influence the trajectory of gold and other metals.
• The Trajectory of US Monetary Policy: The future course of US monetary policy will be a critical determinant of gold's performance in 2025. If the Fed maintains its dovish stance, it could continue to buoy gold prices. However, if the Fed signals a shift towards tighter monetary policy, it could dampen gold's appeal.
• The Evolving Geopolitical Landscape: The geopolitical landscape in 2025 will significantly impact investor sentiment. If geopolitical tensions escalate, gold could surge as investors seek a safe haven. Conversely, a period of relative geopolitical stability could lead to a pullback in gold prices.
• China's Growth Engine: China's economic growth prospects will also be closely watched. China is a major consumer of metals, and its demand can significantly influence prices. If China's economy strengthens in 2025, it could provide a tailwind for base metals.
Gold's Strong Gains: A Harbinger of Change?
Gold's stellar performance in 2024 may signal a fundamental shift in market dynamics. After years of dominance by riskier assets like equities, investors may be returning to safe-haven assets like gold in anticipation of a more uncertain economic and geopolitical environment.
In conclusion, the year 2024 was a year of contrasting fortunes for metals markets. While gold emerged as a clear winner, other metals painted a more mixed picture. As we look ahead to 2025, the trajectory of US monetary policy, the evolving geopolitical landscape, and China's growth prospects will be the key factors shaping the performance of metals markets. Gold's robust gains in 2024 serve as a reminder of its enduring allure as a safe-haven asset in times of uncertainty. Whether this marks a long-term trend or a temporary blip remains to be seen, but one thing is certain: gold will continue to be a closely watched asset class in the ever-evolving global financial landscape.

GoldXAUUSD ( Gold / U.S Dollar )
Ascending Triangle in Short Time Frame
Completed " 12345 " Impulsive Waves
Demand Zone
Break of Structure and Retracement
Bullish Channel as an Corrective Pattern in Long Time Frame

Gold A descending triangle is being drawn, Gold A descending triangle is drawn, with further breakdown of the support level
Review of previous trade:
- Gold successfully exited the triangle as expected.
- The trade worked out perfectly, bringing the expected profit.
Current Situation:
- Gold has now formed a “flag” pattern indicating the continuation of the upward movement.
- The height of the flag coincides perfectly with the strong resistance level at $2658, making this a key target.
New trade parameters:
- Entry point: on breakdown of the upper boundary of the flag.
- Target: $2658 (resistance level).
- Stop loss: hidden behind the flag boundary at $2618 to minimize risk.
- Risk/reward ratio: 1/4 - a low-risk trade with high potential return.
Recommendations:
- Wait for a confident breakdown of the flag before entering the trade.
- Control the position volume to comply with risk management rules.
- Follow market news that may affect the movement of gold.
🚀 Trade with the professionals of THS - Wave Theory!
🔹 All trades are based on wave analysis.
🔹 Fixed stop loss and take profit for risk management.
🔹 100% automation: copy trades through CopyFX service.
🔹 Reliability and transparency: the results are confirmed by the market.
📈 Don't miss the chance to earn steadily!
👉 Connect to CopyFX with THS and start copying profitable trades right now!
💡 Details on our channel and in the app!

XAUUSD Top-down analysis Hello traders, this is a complete multiple timeframe analysis of this pair. We see could find significant trading opportunities as per analysis upon price action confirmation we may take this trade. Smash the like button if you find value in this analysis and drop a comment if you have any questions or let me know which pair to cover in my next analysis.

GoldXAUUSD ( Gold / U.S Dollar )
Completed " 12345 " Impulsive Waves
Break of Structure
Bullish Channel as an corrective pattern in Short Time Frame
Fibonacci Level - 38.20%
Demand Zone

GoldXAUUSD ( Gold / U.S Dollar )
Double Top
Break of Structure
Bullish Channel as an Corrective Pattern in Short Time Frame
Fibonacci Level - 38.20% / 50.00%
Completed " 123 " Impulsive Waves

XAUUSD Top-down analysis Hello traders, this is a complete multiple timeframe analysis of this pair. We see could find significant trading opportunities as per analysis upon price action confirmation we may take this trade. Smash the like button if you find value in this analysis and drop a comment if you have any questions or let me know which pair to cover in my next analysis.

GoldXAUUSD ( Gold / U.S Dollar )
Bullish Channel as an Corrective Pattern in Long Time Frame
Break of Structure
Double Top
Symmetrical Triangle in Short Time Frame with the breakout of Lower Trend Line
Change of Characteristics
