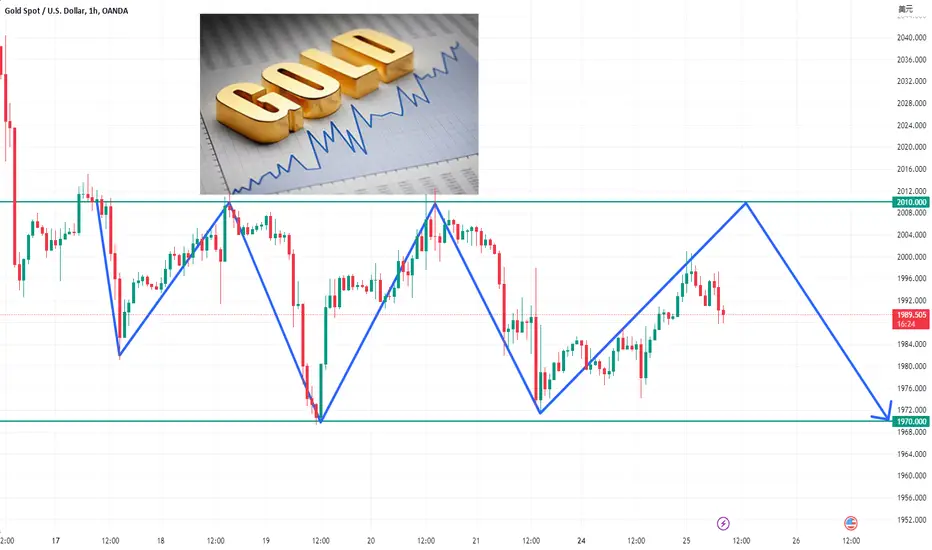
GOLD - Bulls are working hardAccording to the H4 chart, the short-term outlook for the XAU/USD pair seems favorable, despite a slight loss in upward momentum.
Technical indicators have flattened out after crossing into positive territory, as the pair consolidates near daily highs.
Gold has also recovered above the 34 EMA and is trending upwards.
However, the $1,970 level has seen resistance from sellers, and immediate resistance must be surpassed for the pair to extend its rally to the next Fibonacci retracement at 38.2%, located at 1,985.65$.
Keep an eye out for a potential breakout above the 1970 price zone , which could trigger a new uptrend for gold. If using the Temporary Breakout strategy, wait for a close above the zone and set a stop loss at the nearest price stop.
Xauusdforex

Gold Today - Falling momentum clearly establishedOn Wednesday, the US dollar experienced significant fluctuations, but ultimately ended the day with little change.
The main factor affecting gold prices was US Treasury yields, which supported the US dollar. Currently, gold prices are stabilizing after a recent decline, but if the market worsens, the US dollar may become a safe-haven investment, which could limit gold's rise.
Weak jobless claims in the US could also contribute to a continued decrease in the US dollar and a rise in gold prices.
If gold drops below the 1938 zone, it could trigger a strong sell-off towards the 1930-1920-1905 targets in the short term.
When trading based on this method, it's essential to place a stop loss after the nearest price resistance.

Gold's bottoming out is still volatile, and the US market is sti
In terms of gold, yesterday again bottomed out to test the 1951 line, the US market counter-pumped closing T-shape, and the 1951 position, tested three times, were bounced up, located at the 60-day moving average position, forming a short-term support level. However, in terms of rhythm, the price broke the last rising point in the previous period, and the daily line was overcast, and at the same time broke the short-term moving average rhythm, at least a shock correction, and will not restore the bullish pattern. Therefore, before this point, the bulls cannot enter the safe area, which is not suitable for the planned layout of the middle line long order.
In the short term, the bottoming out, the secondary support of 1951, can only indicate that this position is very supportive. But it does not mean that the fall stops, and this position has also become a watershed, in the break, the aforementioned position is coming.
In today's trend, the white line in the weakness, the highest point is 1985, and the time point of the US market is the key.
This trend has been emphasized to everyone before: close strongly, but do not look at Lianyang, then the European market must not break high, as long as the European market is suppressed below the previous day 1985, the US market will see a second fall.
The pattern is similar to Monday's movement.
That is to say, when the European market is still suppressed in the 1985-1965 range, then the US market looks at the second retracement.
Of course, today if the 1985 pre-high is reversed, directly short, TP: 1960-62
Some wealth is planned, rather than always thinking about windfalls. Follow me, follow the right people, and work hard to reap the profits that belong to you.

XAUUSD STRONG SELLERS SHORT GOLD hello Traders. this is my idea on GOLD today, am accepting XAUUSD push more downwards to make a new low before we see interest for buyers again.

Wednesday Gold moves in a narrowing bandGold prices have been trading in a narrow range of $1,950-1,980 for almost a week.
This comes after the prices dropped below $2,000 level due to the uncertainty around the US default. C
opper prices have hit a six-month low due to weakening demand and global manufacturing activity.
The metals market has been under pressure as the US dollar has strengthened, with traders speculating that the Federal Reserve will maintain higher interest rates this year.
SELL GOLD zone 1985 - 1983
Stoploss: 1992
Take Profit 1: 1980
Take Profit 2: 1975
Take Profit 3: 1965
Note : TP, SL full to be safe and win the market !

Gold has triggered a new downtrend??The US debt ceiling issue seems to be improving as President Joe Bidden and House Speaker Kevin McCarthy have both confirmed that there will be no default.
However, the markets are waiting for more clarity as there has been little response so far.
The US Dollar has been gaining momentum and may affect the price of precious metals.
On the other hand, if XAU/USD falls below $1,975, it may reach this month's low of $1,950, and further losses may occur if it drops below $1,920, which is the lower limit of an ascending channel since September 2020.
SELL GOLD zone 1972 - 1975
Stoploss: 1980
Take Profit 1: 1967
Take Profit 2: 1963
Take Profit 3: 1950
Note : TP, SL full to be safe and win the market !

XAUUSD SELL PROJECTION 21.05.23Reason Behind the Bearish in the Following Week
Tecnically Reason
1. Double Top formed the Major Top @ 2050 and tends teh bearish Moment in last week and continuation in Fowwing Week too
2. Bearish Reversal M Pattern Spotted ober the Zone and which make the contination to 1900 after the retest of Immedaiate Support @ 2000 which due to Powells increase in Intrest rate
3. Clear Break Below 1950 which Moves Safe heaven to 1900 and Lower
Fundamental Reason
1. Dxy Beaked the 4h downtrenfd 102 and which retest the 101 which helps to reach 2000 and continuation of breakout lead DXY to 105 anf make XAUUSD/GOLD to 1900
Overall Possible Outcomes
XAUUSD SELL @ 2000-2005
SL 2027
TP1 1950
TP2 1900

XAUUSD Gold Weekly MovePair : XAUUSD ( Gold / U.S Dollar )
Description :
Bullish Channel in Daily Time Frame as an Corrective Pattern
Break of Structure
Divergence - RSI
Completed " 12345 " and " abc " Corrective Wave
Triple Top

XAUUSD Next TargetBUY GOLD
Note: To reduce the risk on your balance
you have to use only 2% of your balance.
-
-
-
-
-
-❤️If you have any questions, please, ask me in the comment section.
Please, support my work with like, thank you!❤️.

XAUUSD ANALYSISAs per chart market creating a support above 1990 and waiting to hit 19797.6 and 2004.I previous chart setup we buy from 1987 and holing for 2003-4 as per chart I'm showing a good positive move in gold before a low towards today RANGE 2003-1976

XAUUSD - GOLD CURRENT SITUATION#XAUUSD
According to the analysis we gave to XAUUSS earlier, the DOWNSIDE WAVE, GOLD went down very fast. Because of the POSITIVE SENTIMENT against the dollar, US10Y rose due to this. Then Ibem became a GOLD SELL. Some FED COMMENTS and NFP DATA were very helpful.
But last day all those LABOR DATA and INFLATION DATA INDICATORS were POSITIVE, so GOLD was slightly SELL. It is definitely a very important indicator for the FED. Currently, MARKET RISK is being OFF. CPI DATA was quite POSITIVE this week.
Anyway we expect GOLD to go DOWN to 1936 LEVEL. Before that GOLD can go up to 2051 LEVEL with the FOMC UPDATE. Stay tuned.

XAUUSD - GOLD CURRENT SITUATION#XAUUSD
According to the analysis we gave to the previous XAUUSS, downside wave, GOLD went down very fast. Due to the positive sentiment of the dollar, the US10Y increased. Then It became Gold SELL. Some fed comments and nfp data were very helpful.
But the next day all those LABOR DATA and INFLATION DATA INDICATORS were positive, so GOLD was slightly SOLD. It's definitely the most important indicator for the FED. Market RISK is currently off. This week CPI DATA became quite positive.
Anyway, we expect GOLD to be down to level 1936. Before that GOLD 2072 level can be up with FOMC UPDATE. Pay attention

Big non-farm data is coming, are you ready?
The monthly nonfarm payroll data is coming soon. Do you know how it will affect gold prices?
The "nonfarm" data is released by the US Department of Labor on the first Friday of each month. It consists of three values: nonfarm employment, employment rate, and unemployment rate, which reflect the development and growth of the manufacturing and service industries. A decrease in these numbers represents a reduction in production by businesses and an economic downturn. Therefore, the following basic rules apply to the price trends of gold:
1. A decrease in nonfarm values indicates an economic downturn, a reduction in production by businesses, and a weakening of the US dollar, which is favorable for gold.
2. An increase in nonfarm values indicates a healthy economic condition, which is favorable for increasing interest rates, strengthening the US dollar, and unfavorable for gold.
In general, if the overall economic data in the United States is weak and the ADP employment data is favorable for spot gold before the nonfarm data is released, the market may start to show a bullish trend for gold prices on Thursday and Friday. On the other hand, if there are signs of economic recovery in the United States before the release of the nonfarm data and the economy is strong, it will be bearish for gold prices, and investors can take advantage of short positions.
Therefore, if the newly added nonfarm data exceeds the market's expectations, the Federal Reserve's expectation of raising interest rates may rise again. However, the uncertain global economic recovery has led to continued expectations of monetary easing by central banks, and the combined effects of these factors have led to extreme fluctuations in gold prices during nonfarm data releases. As a gold investor, you can actively pay attention to the nonfarm market, but there is no need to demand excessive profits from the market. Instead, it is essential to understand the impact of this data on gold price movements.
I will provide analysis and trading strategies for gold and crude oil every day. Please click to follow, maintain your reading habits, and create opportunities for yourself. If you agree with my views, please click the rocket to support me.
COMEX:GC1! MCX:GOLD1! BIST:XAUUSD1!

XAUUSD:will fall rapidly
xauusd:A sequence of 9 appears on the weekly line, which means that next week will be a window for change.
The trend line above the weekly line near 2060 has not been physically broken, so as long as the weekly line ends below 2060 today, it is 100% sure that it will fall next week.
From the hourly chart of gold,
The 2060 wave of rebound happens to be the 618 position of the trend from 2030-2080.
If it is still suppressed by 2060 in the future, then 2060 is likely to become the high point of wave B.
2080 is the high point of wave A, so judging from 123 to 4, gold may continue to break through 2030.
I also drew it in the picture. Next, the 618 position below is near the low point of 2030, and the next 100% position is here at 2010.
If my article is helpful to you, remember to pay attention and like it, welcome to express your opinion
COMEX:GC1! TVC:GOLD COMEX_MINI:MGC1! FXOPEN:XAUUSD

XAUUSD BUYHi fellow traders, XAUUSD has completed an expanding flat pattern and is ready for a move higher. The trade will be invalidated if we break the red line. Target the resistance levels. Good luck and trade safe!

Short-term gold trading will make huge profitsThe current rise in gold is more due to geographical risk aversion and the risk aversion of bank bankruptcies. After all, the First Republic Bank copied the trend of Silicon Valley Bank in the early stage, and fell by 97%. It shows that the market sell-off is worried about the chain caused by the failure of the bank again.At the beginning of the week, it seemed that the Federal Reserve had begun to take over the First Republic Bank, so whether the crisis could be resolved, we will continue to pay attention to the continuous news guidance.
From the point of view of the structure of gold's trend, gold is still oscillating in the large area from 1970 to 2015, but it has fluctuated sharply for two consecutive weeks, but it has always been unable to break the balance, and the large order appeared too normalized in 2000, so there is a certain disagreement between the long and short forces of gold here, then whether gold continues to fall or opens a new round of rise, in fact, it is just to look at the direction of the long and short breakthrough and participate in the trend.
However, on the whole, the impact on the news surface is ultimately to increase the volatility and intensity, and it will not change in the short term to adjust the sideways trend, so our trading strategy and signals are very clear. I have published the detailed trading signals in my channel, you can enter to receive it.

XAUUSD:1970-2010 Trading Signal
Going long on gold yesterday and shorting it today, the switch is perfect and seamless, and the empty orders in early trading in 1998 fell again and made a profit! Short, the rebound in the European market relies on 2000 and continues to short!
The current gold market is still volatile, and the interval remains within the range of 1970-2010! If the rebound encounters resistance, it is an opportunity to short, and if it falls to the support level, it will backhand and do long again!
Now the rebound in the European market still continues to be empty, relying on 2000 to continue to be empty, bearish, and pay attention to whether 1970 breaks below! The real support of the daily line is around 1950!
If you want to get specific trading signals, please contact me on the channel ↓↓↓!
OANDA:XAUUSD CURRENCYCOM:GOLD
The trend of gold is as expected, have you made money?Gold currently continues to maintain a wide range of oscillations in the daily trend, and the current range is temporarily compressed between 1975-2010.At present, gold is running below the moving average band, and 2010 is still regarded as the key resistance in the short term during the day. This is also the key resistance level that I prompted in the channel in the morning.
In the short term, gold has fallen rapidly since around 2000, as low as near 1974. Although the market did not give us the opportunity to short gold near 2010, it must have given us the opportunity to long gold in the short term. I have given tips to go long gold near 1980 and 1976 respectively, with a take profit position of 1986.Fortunately, gold rebounded to near the 1986.5 position in the short term, just reaching our take profit position.Our gold multi-orders have once again made a substantial profit, and today is another day worth celebrating.
At present, gold is trading near 1982. At this position, we must first observe the breakthrough of gold in support or resistance. For the time being, do not directly short or long gold. If there is a good trading opportunity, I will announce it on the channel as soon as possible. Please pay attention to the trading signals in the channel.

Gold Prices Are Back Lower. Are Your Trades Alright?Hello ladies and gentlemen, it is a pleasure to meet you here. I have been trading in gold, crude oil, foreign exchange, cryptocurrency, etc. for more than 13 years. Just like my name, we are the children of the ocean, and the future will be You show me how to use technical indicators to analyze the movement of trends. It is expected that the return will reach about 300% next week.
The U.S. dollar edged higher against major currencies on Friday, April 22 (Saturday), as business activity data showed that the world's largest economy remained resilient, supporting expectations that the Federal Reserve will raise interest rates by another 25 basis points at its policy meeting next month. Gold prices slumped and headed for their worst week in eight, while oil prices posted weekly losses.
Commodity close: U.S. gold futures settled down 1.4 percent at HKEX:1 ,990.50. Brent crude futures rose 56 cents to settle at $81.66 a barrel. U.S. crude was up 5 cents at $77.87.
U.S. stocks closed: the Dow Jones Industrial Average rose 0.07% to 33808.96; the S&P 500 rose 0.09% to 4133.52; the Nasdaq rose 0.11% to 12072.46.
Gold prices have fallen about 1.2% so far this week, pressured by a broader rise in the U.S. dollar, with Fed officials saying on Thursday that inflation remains "well above" the Fed's 2% target. Fed Governor Bowman reiterated that more needs to be done to curb inflation.
U.S. business activity accelerated to an 11-month high in April, an S&P global survey showed, at odds with growing signs that the economy could slip into recession as interest rates rise and demand cools. Gold is also under pressure as a result.
The market currently sees an 85.4% chance that the Fed will raise interest rates by 25 basis points at its May 2-3 meeting.
Gold is expected to trend lower in May if the U.S. dollar raises interest rates at the May 2-3 meeting.
Finally, I will give you a personal summary:
Generally speaking, people who like to chase up can make money, and they will tend to repeat the action of chasing up again. When this action is repeated and more or more money is made, it will affect the people around them, and they even complain about the lack of positions. mentality, so that the market is gradually pushed to a climax until this profit-making effect comes to an end, and if those who chase the rise start to lose money, they will feel self-punishing and tend to be cautious in their operations, which is reflected in the disk The above is a gradual decline in activity.
Similarly, there are also a group of people who like to buy bottoms in the market. If they can make money by buying bottoms, they will continue to buy bottoms. Punish the mind, and reduce the actions of bottom-hunting in operations. Once the number of bottom-hunting people starts to decrease, some stocks will fall without resistance after a little selling pressure.
Finally, I wish you all a happy weekend, and it is a pleasure to share knowledge with you.

Is gold rising or falling?How should I trade gold now?Intraday gold is currently operating between 1976 and 2002. According to the current structure of gold, gold will show a flag-shaped finishing structure in the short term, and the low and high points of gold's operation will also follow the flag-shaped channel line, thus limiting the gold fluctuation space.According to the current market, the announcement of the Federal Reserve's interest rate decision and non-farm payrolls data in early May will be an opportunity for gold to break through the flag-shaped consolidation structure.
In the short term, the top pays attention to the resistance of the 1998-2002 area, and further pays attention to the resistance of the 2008-2010 area; the bottom pays attention to the support of the 1976-1945 area, and further observes the support of the 1970 line below, while measuring the intraday gold strength balance area is 1988-1990.
In trading today, I announced on the channel that I sold gold around 1998-2000, and long gold below 1980. I traded back and forth many times, and reached the profit target for 4 consecutive trading orders, making huge profits.Because gold is currently running in the middle of the balance of strength and weakness area, do not directly short or long gold for the time being. If there is a good trading opportunity, I will announce it on the channel as soon as possible. Please pay attention to the trading signals in the channel.

Will gold eventually fall to 1936?Recently, gold has shown a volatile market in the range. After the rebound, the upward trend is under pressure simultaneously. While the rally is slow, it is accompanied by a decline, and the intensity of the second retracement has not been opened. After each decline, it seems that it is about to fall and break the level, but it always succeeds in a V-shaped reversal at the low level.
Gold's single-day volatility has gradually increased, and after a short-term surge or plunge, the continuity is not strong, and it is likely to come out of a V-shaped reversal market. Therefore, in this extreme market, I have reminded everyone not to easily chase up or short in operation, otherwise it will be easy to be swept back and forth.This undoubtedly increases the difficulty for us in short-term gold trading, so we must set the pace in trading.
Regarding the current gold market, a new volatility range has been formed in a short period of time. Before the direction of gold is chosen, I think gold will continue to fluctuate within the range. Once the long and short direction is determined on the fundamentals, gold may have a trend behavior.Judging from the current market situation, gold is still running short, and only when there is a complete stop-fall signal can there be a continued upward trend.
Then in the short-term operation, first observe the defensive situation of the 1980 first line below, and it is best to choose to sell gold after the gold rebounds; during the period, you can buy gold in small batches at strong support levels in a timely manner.
For the recent ups and downs of the market, over and over again, and frequent long and short conversions, there may be many friends in the trading, back and forth continuous loss orders.So whether it is a friend whose trading order is blocked or a friend who has recently lost money in a row, you can enter my channel through the link below.I have the real strength to help you solve the problem or satisfy your desire to make money. Welcome everyone to visit the channel!

XAUUSD Gold Next Possible MovePair : XAUUSD ( Gold / U.S Dollar )
Description :
Rising Wedge as an Corrective Pattern in Short Time Frame with the Breakout of the Lower Trend Line and Completed the Retracement
Break of Structure
Completed " ABC " Impulsive Wave
Divergence
Exp FIAT as an Correction in Short Time Frame
Fibonacci Level - 61.80%

XAUUSD - GOLD CURRENT SITUATION#XAUUSD
According to the analysis we gave to XAUUSS earlier, the DOWNSIDE WAVE, GOLD went down very fast. Due to the POSITIVE SENTIMENT against the dollar, US10Y rose due to this. Then Ibem became a GOLD SELL. Some FED COMMENTS and NFP DATA were very helpful.
But last day all those LABOR DATA and INFLATION DATA INDICATORS were POSITIVE, so GOLD was slightly SELL. It is definitely a very important indicator for the FED. Currently, MARKET RISK is being OFF. CPI DATA was quite POSITIVE this week.
Anyway we expect GOLD to go DOWN to 1855 LEVEL. Before that, GOLD can go up to 2033 LEVEL with the FOMC UPDATE. Be careful..
